Synergies with other policy areas, including climate, SDGs, and methane mitigation - UNECE
←
→
Page content transcription
If your browser does not render page correctly, please read the page content below
Synergies with other policy areas,
  including climate, SDGs, and methane mitigation

Zbigniew Klimont
Center for Integrated Assessment Modelling (CIAM)

Working Group on Strategies and Review (WGSR), 59th session, 18-21, May 2021
Context and key messages

• The obvious
  – Air quality policy has climate implications

  – Climate and SDG driven policies will have impacts on air pollutant and
    methane emissions and consequently their impacts

  – Costs of reducing air pollution and its impacts will be likely lower if
    climate policies are implemented

  – Not all what is good for climate is good for air quality…and vice versa
Context and key messages

• The ‘new’ and the ‘updated’
   – New EU Clean Air Outlook considering air quality and climate policies

   – New global and regional analysis of methane mitigation and benefits

   – New analysis of global/regional policies to address simultaneously air quality and
     climate

   – Fossil fuel reduction, as key element of decarbonization policy, not sufficient to release
     pressure from necessary reductions of air pollutants such as ammonia to reduce
     ecosystem impacts and in some areas also achieve air quality targets

   – Black carbon mitigation will not save the planet from heating but is nevertheless
     essential

   – Increasing role of methane mitigation, also from the perspective
     of air quality co-benefits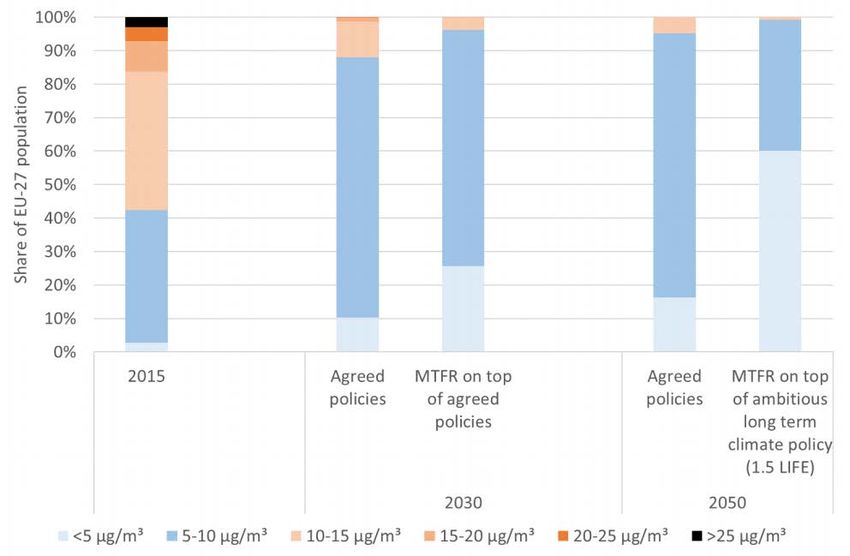
Second Clean Air Outlook (CAO2)

• Assesses prospects for achieving the objectives of the NECD for 2030 and beyond considering
  National Air Pollution Control Programmes (NAPCP) and an increased level of ambition for fighting
  climate change.

• CAO2 baseline and scenario including NAPCPs communicated in 2019; about -40% GHGs for 2030

• Additional climate policy variants:

    – (i) EU 2050 climate strategy vision (net zero GHG by 2050)

    – (ii) European Green Deal (-55% GHGs in 2030)

Published in January 2021: https://ec.europa.eu/environment/air/clean_air/outlook.htm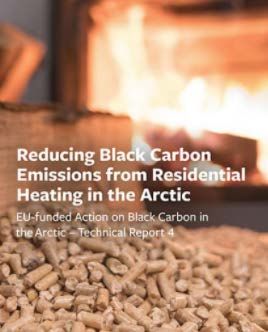
Emission projections for selected air pollutants under various scenarios for EU-27

Source: GAINS model (IIASA), Second Clean Air Outlook (2020)
Cases of premature deaths attributable to the exposure to PM2.5, ozone, and area of terrestrial ecosystems
                    where N deposition exceed the critical loads for eutrophication, EU-27

Premature deaths - PM                                                   Premature deaths - ozone

                                                                          Eutrophication
                                                                      Eutrophication - all ecosystems

       Source: GAINS model (IIASA), Second Clean Air Outlook (2020)
Distribution of population exposure to PM2.5 for key scenarios, EU-27

                                          Source: GAINS model (IIASA), Second Clean Air Outlook (2020)
Global Perspective: Moving towards the WHO air quality guideline requires a mix of policies
                                                                                                 Population exposed to PM2.5
Global anthropogenic CH4 emissions 1990-2050
500 500 Wastewater -industry
450 450 Wastewater -domestic Waste
Solid waste -industry
400 400 Solid waste -municipal
350 Baseline: with current legislation
350
Max technically feasible reduction: Gas distribution networks
Long-distance gas transmission
300 300
Unconventional gas production
Tg CH4
Tg CH4
250 250 Natural gas production
Oil refinery
200 200
Oil production
Energy
150 150 Abandoned coal mines
100 100 Coal mining
Combustion -fossil fuel
50 50
Combustion -biomass fuels
0 0 Agricultural waste burning
y1990
y1995
y2000
y2005
y2010
y2015
y2020
y2025
y2030
y2035
y2040
y2045
y2050
y1990
y1995
y2000
y2005
y2010
y2015
y2020
y2025
y2030
y2035
y2040
y2045
y2050
Rice cultivation
Sheep, goats & other livestock
Baseline Pigs
Agriculture
Marginal abatement costs cut-off MAC < 20 €/t CO2eq for Private investor excl. techn. developm. Non-dairy cattle
MAC < 20 €/t CO2eq for Social planner incl. techn. developm. Dairy cows
Max techn. feasible reduction excl. effects of techn. developm. USEPA (2019): Baseline
Max technical feasible reduction: ~120 (US-EPA-2019) to ~245 (GAINSv4) Tg CH4
Source: GAINSv4; Höglund-Isaksson et al., 2020 (https://doi.org/10.1088/2515-7620/ab7457)
Global CH4 mitigation potential estimates – 2050
                                        (estimates of mitigation potential for 2030 are quite similar)

                         Energy                               Solid waste and wastewater                                                                      Agriculture
                                     USEPA                                                         USEPA                                                                  USEPA
                             GAINSv4 (2019)                                                GAINSv4 (2019)                                                         GAINSv4 (2019)
                        0                                                               0                                                                    0
                                                                                      -10
                       -20                                                                                                                                   -5
                                                                                      -20

                                                               Tg CH4 reduced 2050
                                                                                      -30                       IAM average                                 -10
Tg CH4 reduced 2050

                                                                                                                                      Tg CH4 reduced 2050
                       -40                                                            -40                       (UNEP, 2021)*
                                                                                      -50                                                                   -15
                       -60
                                                                                      -60                                                                   -20
                                              IAM average
                       -80                    (UNEP, 2021)*
                                                                                      -70
                                                                                      -80                                                                   -25
                      -100                                                            -90
                                                                                                                                                            -30
                                                                                     -100
                      -120                                                            Industry wastewater                                                   -35
                      -140                                                                                                                                  -40
                                                                                      Domestic wastewater
                       Coal mining                                                                                                                            Agricultural waste
                                                                                                                                                              burning
                                                                                      Solid waste -industry
                       Gas downstream                                                                                                                         Rice cultivation
                                                                                      Solid waste -MSW                                                                             IAM average
                       Oil & gas -upstream                                                                                                                                         (UNEP, 2021)*
                                                                                      landfills                                                               Livestock
                       leakages
                                                                                      Solid waste -MSW                                 -60 Tg
                       Oil & gas -upstream
                                                                                      treatment
                       venting

   * Global Methane Assessment (UNEP, 2021)                                                           Source: GAINSv4; Höglund-Isaksson et al., 2020 (https://doi.org/10.1088/2515-7620/ab7457)
Large regional variation in sectoral emissions
and mitigation potentials
Marginal abatement costs cut-off
Source: GAINSv4; Höglund-Isaksson et al., 2020 (https://doi.org/10.1088/2515-7620/ab7457)Marginal abatement cost curves (ranges*)
for global and regional CH4 mitigation in 2050
Energy: -72%
Waste: -78%
Agriculture: -21%
------------------------------------------------------------------------------ 20 €/t CO2eq
* Ranges reflect private sector (upper) and social planner (lower) investment
perspectives as well as inclusion of technological progress/development
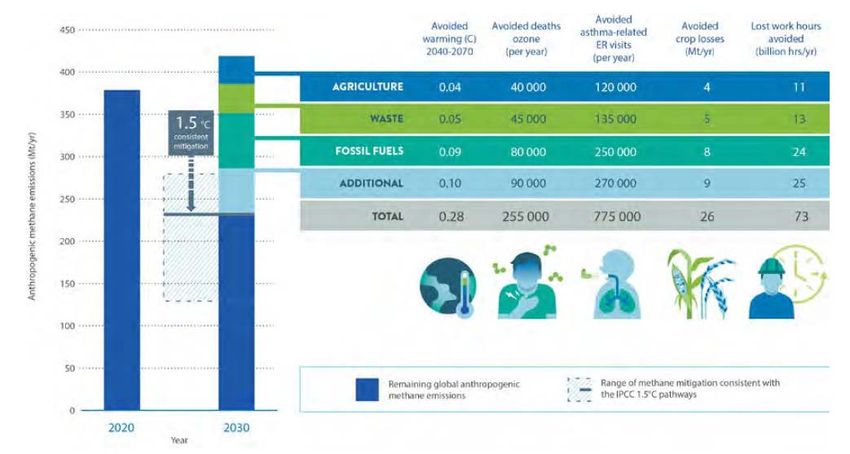
Source: GAINSv4; Höglund-Isaksson et al., 2020 (https://doi.org/10.1088/2515-7620/ab7457)Anthropogenic emissions of CH4, mitigation potential and several
benefits (UNEP, 2021)
Source: Global Methane Assessment (UNEP, 2021)Summary
• NH3 remains the most challenging pollutant for the achievement of the reduction commitments.
• The increased ambition of European climate policies leads to important reductions of energy-related air
pollutants and thereby reduces the pressure on other sectors for reaching compliance with the NECD
reduction commitments – but not for NH3.
• Local and regional analysis reconfirms the relevance of the international component of air pollution and
reveals the importance of (past and future) regionally coordinated policies
• A mix of policies (involving air quality, climate, and SDGs) needed to achieve WHO air quality guideline
targets
• Important role for methane in climate mitigation providing several (and significant) co-benefits on health,
crops and ecosystems
• Low-cost mitigation of methane available and provides a cost-effective way of reducing background ozoneYou can also read