World Fruit Map 2018 - Rabobank
←
→
Page content transcription
If your browser does not render page correctly, please read the page content below
February 2018
World Fruit Map 2018
Global Trade Still Fruitful
RaboResearch
Food & Agribusiness
far.rabobank.com
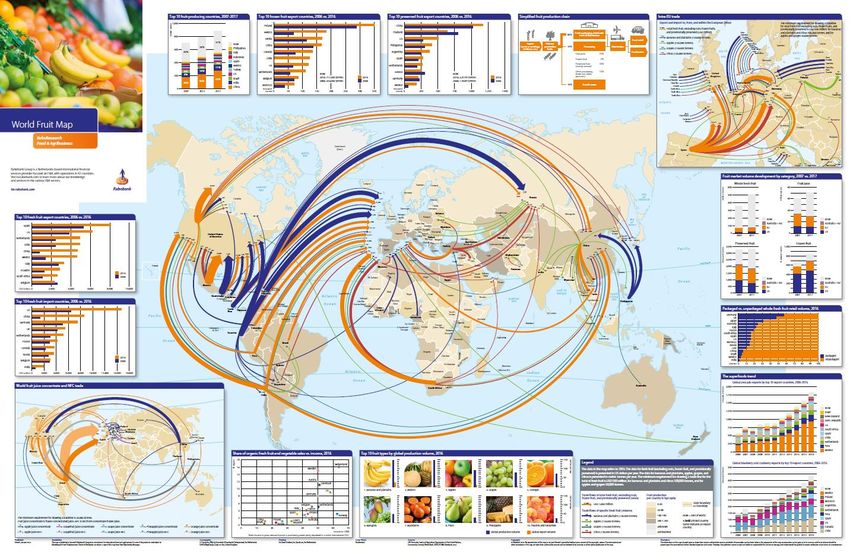
The 2018 World Fruit Map shows essential fresh fruit and fruit juice trade flows and
Cindy van Rijswick highlights some key global trends in the fruit sector. These highlights include the growing
Analyst - Fruit, Vegetables, global popularity of frozen fruit, tripling trade in avocados and blueberries, and the
Floriculture
+31 30 712 3830
significant rise in China’s fresh fruit imports.
Download
> Click here to download the World Fruit Map
Poster versions of the World Fruit Map are exclusively available to Rabobank clients. To receive one,
please contact your relationship manager.
Map summary: Globalisation Goes on
The fruit market is much more of a global market than the vegetable market. About 9% of all
fruits grown are traded internationally, and that share is still increasing. Bananas, apples, citrus
fruits and grapes are traded worldwide, with Latin America as a dominant global export force and
China as a giant and increasing import market. The fruit market also differs from the vegetable
market in that a large share of fruit is processed, with juice being a major industry. However,
consumption of juices as well as canned fruit is under pressure in mature markets like the US,
Europe, and Oceania.
1/4 RaboResearch | World Fruit Map 2018 | February 2018
Frozen and fresh fruit are gaining ground
      An estimated 80% of all fruits grown globally are sold as whole fresh fruit 1. That fresh fruit market
      is still growing, mainly outside of the US and the EU. In mature markets, consumer preferences
      seem to be shifting towards fruit with a more natural and fresh image, including frozen fruit. This
      is at the expense of shelf-stable products like juice and canned fruits. In the last decade, global
      demand for frozen fruit has increased by 5% a year. The popularity of berries, one of the main
      frozen fruit products, has definitely supported this trend. At the same time, global demand for
      preserved fruit (in cans, pouches, and bottles) has remained flat on a global basis and decreased
      by over 1% a year in Europe, Australia, and the US.

      Organic fruit is more than just a luxury item
      Organic fruit is another category profiting from changing consumer preferences. Organic foods
      are gaining market share around the world. In general, the market share of organic fruit is higher
      in the more affluent countries compared to emerging economies. But income is not the only
      determinant for buying organic, as the share of organic produce in total produce purchases is
      varying strongly per country, from 2% in Australia and 5% in the Netherlands to 9% in the US and
      15% in Sweden. The reasons behind this variation are likely to do with supermarkets’ decisions on
      the category, price availability, and quality of conventional vegetables, as well as cultural factors.
      Anyway, organic products fill a certain gap in the market for consumers who want to make
      conscious food choices, regardless of the evidence.

      Superfood trend boosts global fruit trade
      Social media seems to play an increasingly important role in fruit consumption trends. In
      particular the so-called superfoods that are perceived to be extra healthy are on the up. In order
      to have blueberries, avocados, and other popular fruit types available year-round, most countries
      in the world have to import them, at least for part of the year. As a result, trade in these products
      has risen steadily (see Figure 1).

      Figure 1: Rising trade in ‘superfoods’

      Source: UN-Comtrade, 2018

      China is setting its stamp on the global fruit market
      Most of the increase in international fresh fruit exports, nearly 7% a year over the last decade, has
      been absorbed by the main import markets: the US, China, and Germany (see Figure 2). But in
      relative terms, emerging markets like China and India are becoming more important in the global
      fruit market. China is the world’s number one producer, but has also rapidly expanded its imports
      and exports of fresh and processed fruits.

      1
          Fruit processing for alcoholic beverages like cider, wine, and spirits is excluded
           from our analysis.

2/4   RaboResearch | World Fruit Map 2018 | February 2018
Different factors are driving growth in fresh fruit trade, for the world as a whole, and for China in
particular: improved market access, changing consumer preferences, a more professional retail
environment, increasing purchasing power and last-but-not least the combination of improved
logistics, (controlled-atmosphere) storage and cold-chain facilities. Many fruits can be shipped
over long distances by transportation by sea. For Latin American countries like Chile, Peru,
Ecuador, and Brazil in particular this has opened up a world of opportunities.
Figure 2: Top 10 fresh fruit import countries, 2006 vs. 2016
Source: UN-Comtrade, 2018
3/4 RaboResearch | World Fruit Map 2018 | February 2018Imprint
RaboResearch
Food & Agribusiness
far.rabobank.com
Cindy van Rijswick Analyst - Fruit, Vegetables, cindy.van.rijswick@rabobank.com
Floriculture +31 30 712 3830
© 2018 – All rights reserved
This document has been prepared exclusively for your benefit and does not carry any right of publication or
disclosure other than to Coöperatieve Rabobank U.A. (“Rabobank”), registered in Amsterdam. Neither this
document nor any of its contents may be distributed, reproduced or used for any other purpose without the
prior written consent of Rabobank. The information in this document reflects prevailing market conditions and
our judgement as of this date, all of which may be subject to change. This document is based on public
information. The information and opinions contained in this document have been compiled or derived from
sources believed to be reliable, without independent verification. The information and opinions contained in this
document are indicative and for discussion purposes only. No rights may be derived from any potential offers,
transactions, commercial ideas et cetera contained in this document. This document does not constitute an offer
or invitation. This document shall not form the basis of or cannot be relied upon in connection with any contract
or commitment whatsoever. The information in this document is not intended and may not be understood as an
advice (including without limitation an advice within the meaning of article 1:1 and article 4:23 of the Dutch
Financial Supervision Act). This document is governed by Dutch law. The competent court in Amsterdam, The
Netherlands has exclusive jurisdiction to settle any dispute which may arise out of or in connection with this
document and/or any discussions or negotiations based on it. This report has been published in line with
Rabobank’s long-term commitment to international food and agribusiness. It is one of a series of publications
undertaken by the global department of RaboResearch Food & Agribusiness.
4/4 RaboResearch | World Fruit Map 2018 | February 2018You can also read