Cadence Design Systems, Inc - Investor Introduction April - June 2019
←
→
Page content transcription
If your browser does not render page correctly, please read the page content below

Cadence Design Systems, Inc.

Investor Introduction
April - June 2019

Safe Harbor Statement and Regulation G

Safe Harbor Statement
The following discussion contains forward looking statements, and our actual results may differ
materially from those expectations discussed here.

Additional information concerning factors that could cause such a difference can be found in our Form
10-Q for the quarter ended March 30, 2019, our Form 10-K for the year ended December 29, 2018, the
company’s future filings with the Securities and Exchange Commission and the cautionary statements
regarding forward-looking statements in our April 22, 2019 earnings press release for the quarter ended
March 30, 2019.

Regulation G
In addition to financial results prepared in accordance with Generally Accepted Accounting Principles, or
GAAP, this presentation will also contain certain non-GAAP financial measures. Cadence management
believes that in addition to using GAAP results in evaluating our business, it can also be useful to
measure results using certain non-GAAP financial measures. Investors and potential investors are
encouraged to review the reconciliation of non-GAAP financial measures with their most direct
comparable GAAP financial results, including those set forth in our April 22, 2019 press release and our
CFO Commentary for the quarter ended March 30, 2019, both of which can be found in the quarterly
earnings section of the investor relations portion of our website at cadence.com.

2    © 2019 Cadence Design Systems, Inc. All rights reserved.

Cadence-at-a-glance

                                                        • Leading provider of system design enablement
                                                          (SDE) solutions – software, hardware, and IP
                                                        • Mission critical technology for designing
                                                          today’s electronic systems
                                                        • Culture of innovation - more than 20 significant
                                                          new products in last 3 years
                                                        • Subscription software model with very high
                                                          customer renewal rates and loyalty
                                                        • Revenue: ~$2.14B
                                                        • Headquarters in Silicon Valley
                                                                ~7600 employees worldwide

                                                                         NASDAQ: CDNS; S&P 500 & Nasdaq 100 indexes

3    © 2019 Cadence Design Systems, Inc. All rights reserved.
Financial summary
                       2018
                                                                                   2500
                                                                                                            Revenue
                                                                                   2000

                                                                        ($ millions)
                   Revenue1                                                        1500
                     $2.14B
                                                                                   1000

                                                                                       500
                 Non-GAAP
                                                                                        0
                  operating                                                                  2012   2013   2014   2015     2016      2017      2018
                   margin1
                    30%
                                                                              $2.00
                                                                                                      Non-GAAP EPS1
                                                                              $1.75
                      Free                                                    $1.50
                                                                              $1.25
                    cash flow
                                                                              $1.00
                     $543M                                                    $0.75
                                                                              $0.50
                                                                              $0.25
                                                                              $0.00
                                                                                             2012   2013   2014   2015     2016      2017      2018
      Notes:
      1. Non-GAAP operating margin and non-GAAP EPS (excludes amortization of acquired intangibles, stock-based compensation, non-qualified deferred compensation expenses
          and certain non-recurring cash expenses. See quarterly earnings releases and CFO Commentary for reconciliations to GAAP measures.

4    © 2019 Cadence Design Systems, Inc. All rights reserved.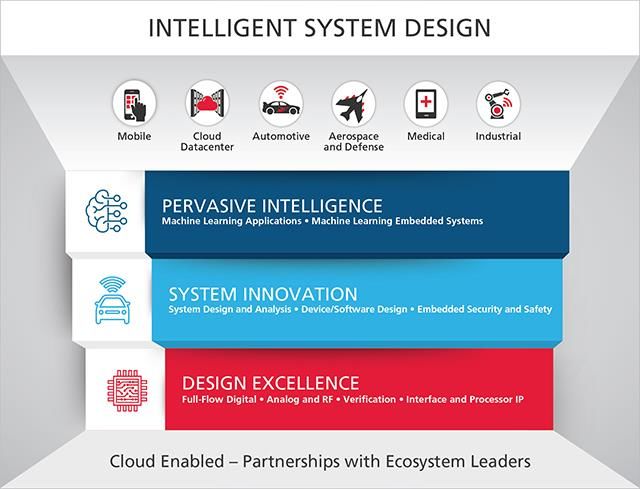
Industry landscape

    ▪ Cadence and its peers develop highly
      specialized software, hardware, and IP
      solutions for the automated design and
      verification of electronic products and                                                       SDE/EDA economics within
      systems                                                                                     the 2017 electronics framework

    ▪ Our technology is critical to semiconductors,                                                                      Applications

      and is increasingly deployed by a variety of
      systems companies                                                                                          Electronic Systems
                                                                                                                       $1.50T

                                                                                                              Semi $445B

                                                                                                             SDE/EDA
                                                                                                               & IP
                                                                                                              $9.8B

                                                                Source: The McClean Report, 2018, ESD Alliance Market Survey Service Q4 2017, Cadence analysis

5    © 2019 Cadence Design Systems, Inc. All rights reserved.
Data-driven economy (DDE) drives growth
    opportunities

                                                                  Data      Data
                                                                Creation   Storage

                                                              Data           Data
                                                          Transmission     Analytics

6    © 2019 Cadence Design Systems, Inc. All rights reserved.
Key technology waves propel DDE

                          Mobile                                            Edge computing

                                                         Machine learning

                      Automotive                                              Datacenter

7    © 2019 Cadence Design Systems, Inc. All rights reserved.
System Design Enablement (SDE) strategy

8   © 2019 Cadence Design Systems, Inc. All rights reserved.
SDE – expanding beyond traditional EDA

    ▪ The System Design Enablement strategy drives growth in our core EDA
      and IP business, broadens our reach in system companies and targeted
      verticals, and guides expansion into newer adjacent areas.

    ▪ The next phase of this strategy is Intelligent System Design.

    ▪ The foundation of the strategy continues to be delivering Design Excellence
      via our core EDA and IP business. In addition, we are building upon our core
      competency in computational software to expand into two new areas:

      − System Innovation, where we are expanding into new system domains,
        and

      − Pervasive Intelligence, where we will apply AI and our algorithmic know-
        how to our core business and specific verticals.

9    © 2019 Cadence Design Systems, Inc. All rights reserved.
Intelligent System Design

     ▪ The Intelligent System Design strategy will enable us to provide more
       capabilities and value to our customers, while also expanding our current
       total addressable market from about $10 billion to an estimated $30 billion
       over the next five years.

     ▪ Some of our recent activities in the System Innovation space includes:

       − A strategic partnership with Green Hills Software, which opens new
         opportunities in the estimated more than $3 billion embedded system
         safety and security space.

       − In April we entered the System Analysis market, an estimated $4.5 billion
         total addressable market opportunity, with our first product for this space,
         the Clarity 3D Solver, a next-generation solution for electromagnetic field
         simulation.

10    © 2019 Cadence Design Systems, Inc. All rights reserved.
Innovation – engine of growth
2019
Cadence
Announced in Q2 Clarity
CloudBurst
Tensilica
Virtuoso® HiFi 5 DSP
GDDR6 IP
RF Solution with AI Speech
processing Tensilica
Legato™
Cadence® 112G SerDes Vision C5
Reliability TSMC VDE
Cloud IP DSP
Solution
Tensilica® Pegasus™ Legato
DDR5 DIP Liberate™ Verification Memory
2016 - 2018 in TSMC 7nm Trio
Vision
Q6 DSP System Solution
Tensilica Modus DFT OrCAD® Tensilica
DNA 100 Software Capture Cloud HiFi 3z DSP
Processor Solution
Protium™ S1
JasperGold RTL Next-Gen Conformal®
Prototyping
Signoff Apps Virtuoso ADE Smart LEC
Platform
Tensilica Tensilica Virtuoso
Vision P6 DDR5 IP Fusion G3 System Design
DSP DSP Platform
Xcelium™
Parallel
Simulator
11 © 2019 Cadence Design Systems, Inc. All rights reserved.Recurring revenue model
High visibility software revenue stream
▪ Recurring revenue mix: 85 - 90% for 2019
▪ RPO: $2.8B (Q1’19)
Revenue
700
Revenue growth
600
▪ 12% (Q’19/Q1’18) 500
($ millions)
400
300
200
100
0
2012 2013 2014 2015 2016 2017 2018 2019
12 © 2019 Cadence Design Systems, Inc. All rights reserved.Diversified business across products and
regions
Verification Americas
12% 8%
Digital China
24%
Analog Other Asia
9% 19%
PCB/Pkg EMEA
45%
IP Japan
26%
18%
29%
10%
Revenue mix for 2018
13 © 2019 Cadence Design Systems, Inc. All rights reserved.Driving profitable growth
Strong operating profitability:
▪ Focus on growth and disciplined ROI-centric resource allocation
▪ Non-GAAP operating margin 30%1 (2018)
Non-GAAP Operating Margin1
35%
30%
25%
20%
15%
10%
5%
0%
2012 2013 2014 2015 2016 2017 2018
Notes:
1. Non-GAAP operating margin and non-GAAP EPS (excludes amortization of acquired intangibles, stock-based compensation, non-qualified deferred compensation expenses
and certain non-recurring cash expenses. See quarterly earnings releases and CFO Commentary for reconciliations to GAAP measures.
14 © 2019 Cadence Design Systems, Inc. All rights reserved.Cash flow, capital structure and uses of cash
Free cash flow
Free cash flow generation 600
500
▪ $543M (2018)
($ millions)
400
300
Capital structure (Q1 ‘19) 200
▪ Cash: $539M 100
▪ LT Debt: $400M 0
2012 2013 2014 2015 2016 2017 2018
▪ Credit facility: $350M
Stock repurchase
1200
Capital allocation
1000
▪ Internal investment
($ millions)
800
▪ M&A 600
▪ Repurchase stock 400
200
0
2012 2013 2014 2015 2016 2017 2018
15 © 2019 Cadence Design Systems, Inc. All rights reserved.In summary
▪ Mission critical solutions for designing semiconductors and electronic
systems
▪ Data-driven economy and its supporting technology waves combined
with our Intelligent System Design strategy expand TAM
▪ Culture of innovation creates the products for category leadership
and growth
▪ Growth, focus and discipline drive financial performance
16 © 2019 Cadence Design Systems, Inc. All rights reserved.© 2019 Cadence Design Systems, Inc. All rights reserved worldwide. Cadence, the Cadence logo, and the other Cadence marks found at www.cadence.com/go/trademarks are trademarks or registered trademarks of Cadence Design Systems, Inc. All other trademarks are the property of their respective owners.
You can also read