ASIAN PAINTS INVESTOR CONFERENCE - Q2 & H1 - FY2021 Results - Asian Paints Q2
←
→
Page content transcription
If your browser does not render page correctly, please read the page content below

ASIAN PAINTS
   INVESTOR
  CONFERENCE
Q2 & H1 - FY2021 Results
This communication, except for the historical information, may contain statements which reflect the
management’s current views and estimates and could be construed as forward looking statements.
The future involves certain risks and uncertainties that could cause actual results to differ materially
from the current views being expressed. Potential risks and uncertainties include such factors as
general economic conditions, foreign exchange and commodity price fluctuations, competitive
product and pricing pressures and regulatory developments.

3rd Largest            3
USD 2.8 Billion        Paint        Times nearest
Group revenue        Co. in Asia     Competitor
                                       in India

                                                                                   GROUP REVENUE SPLIT
     9th                                  26
   Largest          Operations in                                                           2% 2%
                                        Paint
 Coatings Co.            15
                                    Manufacturing                                         12%
 in the World         countries
                                       Plants
                                                                                                      84%

                                         Servicing
  50+ Years           75+ Years          150,000+
       of                  of       Re t a i l e rs d i re c t l y/
Market Leadership    Innovation           I n d i re c t ly
                                              in India                Deco India   International    Industrial   Home Improvement
     in India          in Paint
                                                                        Revenue Split based on FY19-20 financials
❖Covid cases in India still rising, but pace seems to have peaked
❖Real GDP shrinking by 23.9% in Q1 on expected lines
❖Demand recovery acceleration witnessed across sectors in Q2 led by progressive “unlock” phases by
 Central & State Governments
 ❖ Supply side concerns easing incrementally
 ❖ Pent up demand supporting the September quarter across industries
❖Recent releases on IIP print in line with this recovery
 ❖August reporting -8% y-o-y growth compared to -16% in June and -11% in July
❖Headline inflation (CPI clocking 7.34% for Sep’20) continues to remain elevated driven by food
 articles
  ❖Industrial input prices, though, remain largely stable
❖Foreign exchange movement (USD – INR) supportive in the second quarter
❖Paint Industry on a recovery mode, gaining from last month of Q1 - led strongly by tier 2 / 3 / 4
 markets
❖ Strong 11% volume growth in Q2 for the domestic decorative business
 ❖ Volume growth improved in each of the months in the quarter
❖ Demand recovery centered around Economy , Premium & some Luxury range of products
 ❖ Emulsion upgrade playing out strongly
 ❖ Undercoats continue to grow well
 ❖ Waterproofing portfolio expanding
 ❖Luxury Emulsions in certain categories doing well
❖ Continued strong response to ‘Safe Painting’ & ‘San Assure’ Services
❖ Strengthening the Décor play with introduction of offerings in Lightings, Furnishings & Furniture
❖ Gross margins supported by stable input material prices as well as continued work on driving
 sourcing / formulation efficiency

Continued momentum with double digit volume growth in Q2 after
          registering a double digit growth in June’20

                         Improving trend
                                        11%
                                                      6%

                Qtr 1                         Qtr 2

         -38%
                        -44%

                        Volume Gr%   Value Gr%
A tailor-made solution that offers design expert consultation,
                                   personalized designs, unparalleled project management and hassle-free
                                   execution, you can transform your space into the home of your dreams

Recently introduced Lightings, Furnishings and Furniture thus adding more products in the Home
                               décor and Interior Design category

                1500 + SKU’s across three brands : Nilaya , Royale and Ador
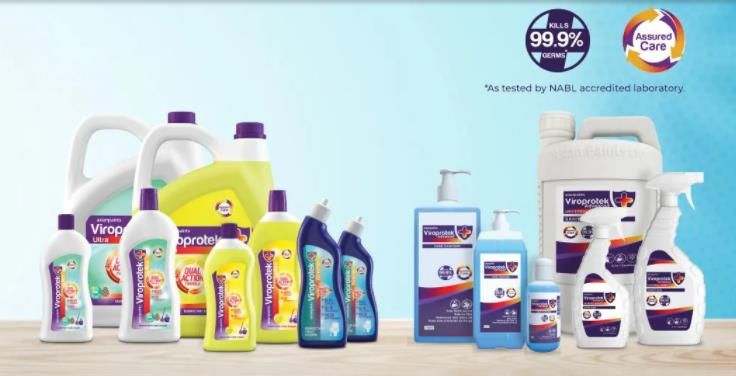
SANITIZERS &
DISINFECTANTS
WALL
PAINTS
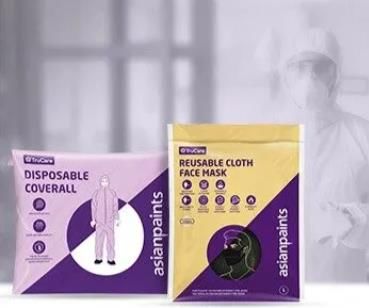
MASK & PPE
KITS
❖ Volume growth picked up across markets in Q2                                        REVENUE
                                                                                                         424
  ❖ Performance led by good volume growth in Africa &
   Middle East                                                           286          300          303

  ❖ Units in Sri Lanka and Bangladesh clocked double digit         163          168

   volume growths                                                                                                      56
                                                                                                                  32
  ❖ Nepal still under pressure due to large restrictions related
                                                                   Africa      Middle East             Asia    South Pacific
   to Covid
                                                                                             Q2   H1
❖ Strong push around new products / variants in Premium &
 Luxury emulsions to fill products gaps                                                      PBT
❖ Waterproofing also doing well across markets                           31
                                                                                                   34

❖ Margin improvement supported by lower material prices as         20
                                                                                      22
                                                                                                          20
 well as work on deriving sourcing & formulation efficiency                      14                                    13
                                                                                                                  8
❖ Overall, International Business revenue: Q2 ` 660 crores
 (+7.8%) and H1 ` 1056 crores (-9%)
                                                                   Africa      Middle East             Asia    South Pacific

❖ International Business PBT: Q2 ` 69 crores (+44.3%) and                                    Q2   H1

 H1 ` 73 crores (-4.9%)
❖ PPG-AP
 ❖ Strong uptick in Passenger vehicles & 2-wheelers builds indicative of a recovering trend
 ❖ OEM business reported good growth in Q2 after a sluggish Q1
 ❖ Refinish business, though better than Q1, still low

❖ AP-PPG
 ❖ Gradual recovery seen in Q2
 ❖ Powder business leading the recovery
 ❖ Industrial Liquid Paint demand still slow
  ❖ Demand from large consumption sectors like Oil & Gas and Capital Maintenance lagging

❖ Both the businesses benefiting from lower input material prices
❖ Kitchen Business
 ❖ Registered sales of ` 61 crores in Q2 touching base of previous year
  ❖ First half sales at ` 86 crores, lower than previous year by 26%
 ❖ Components as well as Full Kitchens segments recovered well in Q2
 ❖ Projects segment, too, saw some pick-up on a sequential basis
 ❖ PBT loss of ` 4.4 crores in Q2 (compared to a loss of ` 13.5 crores in Q1)

❖Bath Business
 ❖ Registered sales of ` 55 crores in Q2, lower than previous year by 4%
  ❖ First half sales at ` 80 crores, lower than previous year by 25%
 ❖Recovery led by Economy range of products
 ❖Business reported PBT break-even in Q2 (compared to a loss of ` 7.4 crores in Q1)
  ❖Supported by some improvement in Gross marings, cost control and lower spend in Marketing
QUARTER 2

                                                                       19.5%
        5.8%                                                                       FIRST HALF
4,527

                                                                     6,973

                                                                                                          21.5%

                                                                                                                         27.6%
                                                                                       17.7%
                        31.6%

                                             33.7%

                                                       0.3%
                1,150                1,060
                                                     793                       1,617                1,397         1045

                                                              0.6%
Revenue          PBDIT                    PBT        PAT             Revenue     PBDIT                   PBT        PAT
                                CY   LY                                                        CY   LY
                  Figures in ` crores                                             Figures in ` crores
                         PBDIT                                                             PBDIT
                         margin                                                            margin
                          +5%                                                              +0.5%
               PAT lower due to tax reversal in last year with lowering of Corp. Tax rate.
                      On a like to like basis, PAT growth in line with PBT growth
QUARTER 2 FIRST HALF
18.5%
5.9%
5,350
8,273
31.6%
18.4%
22.7%
29.5%
34.4%
0.8%
1,277
1,146 852 1,747
1,451 1072
Revenue PBDIT PBT PAT Revenue PBDIT PBT PAT
CY LY CY LY
Figures in ` crores Figures in ` crores
PBDIT
PBDIT
margin
margin
+4.7%
PAT lower due to tax reversal in last year with lowering of Corp. Tax rate.
On a like to like basis, PAT growth in line with PBT growthFY 2020-21
Interim Dividend 335%
(` 3.35 per share)
Interim Dividend 1050% (` 10.50 per share) *
FY 2019-20
Final Dividend 150% (` 1.50 per share)
* Two interim dividends of
` 3.35 per share and
Total Dividend 1200% (` 12.00 per share)
` 7.15 per share
Payout Ratio : 51.1%❖ Good Recovery in Q2 led by some seasonal demand in the market due to Festivals ❖ Real question is: Whether it will sustain beyond the Festive season? Still uncertain on that front ❖ Global recovery could support the Export sector in India ❖ Early signs of recovery with Sep’20 Exports growth in positive zone after a gap of 6 months ❖ Good monsoon could provide strong support to the rural economy and demand from that side ❖ Need to continuously watch on currency movement and raw material prices, though they remain stable currently ❖Continue to work on further cost optimization and take up only business critical spends, across all Businesses
You can also read


