Update for New Brunswick Oysters - John Sackton Seafood Datasearch Province of New Brunswick March 2021 - Government of New Brunswick

Page created by Willard Campos
 
CONTINUE READING
Update for New Brunswick Oysters - John Sackton Seafood Datasearch Province of New Brunswick March 2021 - Government of New Brunswick
Update for New Brunswick
         Oysters
       John Sackton
   Seafood Datasearch
Province of New Brunswick
        March 2021

                            1
Update for New Brunswick Oysters - John Sackton Seafood Datasearch Province of New Brunswick March 2021 - Government of New Brunswick
•
                      Background
    40+ Years in Seafood Industry
•   Crab, shrimp, lobster and cod market
    analyst since 1997
•   Price and market outlooks for Atlantic
    Canada, Alaska, and US West Coast
•   2005-2018 Price arbitrator for Alaska crab
•   Expert on Mussel and Oyster Markets
•   Co-Founder of NFI’s Global Seafood Market
    Conference
•   Annual Market Review for Fisheries Council
    of Canada
•   Founder of SeafoodNews and Seafood
    Datasearch

                                                 2
Update for New Brunswick Oysters - John Sackton Seafood Datasearch Province of New Brunswick March 2021 - Government of New Brunswick
0
                                                         20000
                                                                 40000
                                                                           60000
                                                                                      80000
                                                                                                     100000
                                                                                                                      120000
                                                                                                                                   140000
                                                                                                                                               160000
                                                                                                                                                         180000
                                                                                                                                                                  200000
                                   Ja
                                      n
                                 F e ua r
                                     br y
                                        ua
                                      M ry
                                        ar
                                           ch
                                       Ap
                                           ri l
                                        M
                                           ay
                                        Ju
                                           ne
                                         Ju

    Prince Edward Island
                                     A ly
                               Se ug
                                  pt us
                                     em t
                                  Oc ber
                               No tob
                                   ve er
                                De mb
                                   ce e r
                                       m
                                   J a be r

    New Brunswick
                                                                                                                                                        PEI

                                      nu
                                 Fe a r
                                     br y
                                        ua
                                      M ry
                                        ar
                                           ch
                                       Ap
                                           ri l
                                        M
                                           ay
                                        Ju
                                           ne
                                         Ju
                                     A ly
                               Se ug
                                  pt us
                                     em t

    Avg volume June-December
                                  Oc ber
                               No tob
                                   ve er
                                De mb
                                   ce e r
                                       m
                                   J a be r
                                      nu
                                 Fe a r
                                     br y

    NB volume
                                        ua
                                      M ry
                                        ar
                                           ch
                                       Ap
                                                                                                                                                                                 volume in 2020

                                           ri l
                                        M
                                           ay
                                        Ju
                                           ne
                                         Ju
                                     A ly
    PEI customs price

                               Se ug
                                  pt us
                                     em t
                                                                                                                                               NB

                                  Oc ber
                               No tob
                                   ve er
                                De mb
                                   ce e r
                                                                                                                                                                           Oysters suffered big drop in

                                       m
3

                                   J a be r
                                      nu
                                          ar
                                            y
    NB customs Price
                                                  0.00
                                                          2.00
                                                                    4.00
                                                                               6.00
                                                                                              8.00
                                                                                                              10.00
                                                                                                                               12.00
                                                                                                                                            14.00
                                                                                                                                                        16.00
                                                                                                                                                                  18.00
Update for New Brunswick Oysters - John Sackton Seafood Datasearch Province of New Brunswick March 2021 - Government of New Brunswick
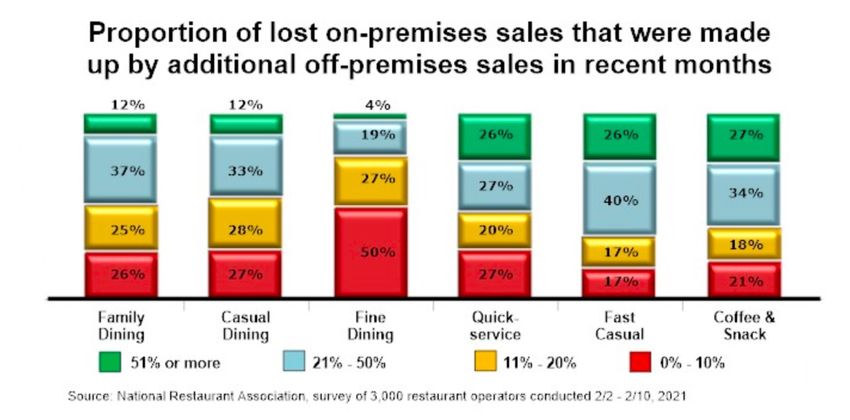
One Year into the Pandemic
     What Have We Learned
• After a sharp drop in price and output in April and May,
  most species recovered strongly in 2nd half of year.
• Major changes in food consumption patterns have
  occurred in North America, China, and Europe.
• In the US the timing of relief checks plus the shutdowns
  resulted in a surge in retail seafood
• This has led to higher overall seafood sales in 2020
  than in 2019.
• Recovery in 2021 is predicted to be very strong

                                                     4
Update for New Brunswick Oysters - John Sackton Seafood Datasearch Province of New Brunswick March 2021 - Government of New Brunswick
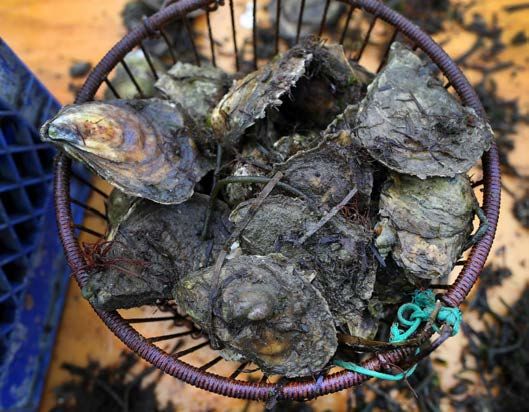
Oysters were hit harder by pandemic
     than many other products
 • Growth of farmed oysters came from
   foodservice
 • Because of need for shucking, could not
   make transition to retail
 • Little to no increase in retail customers
 • So structural change in markets could not
   be accomodated

                                        5
Update for New Brunswick Oysters - John Sackton Seafood Datasearch Province of New Brunswick March 2021 - Government of New Brunswick
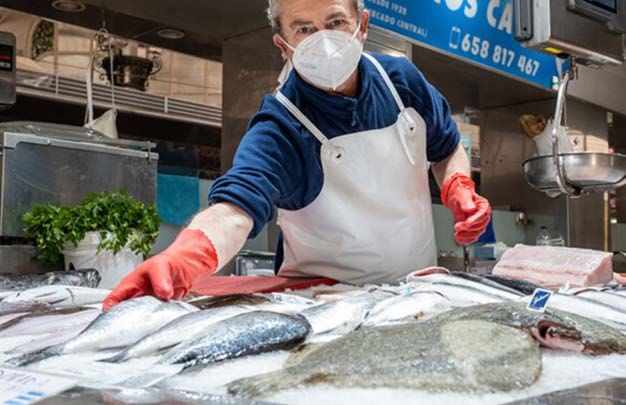
Major Structural Changes in Trade
 Patterns and Markets Will Persist
2019: Retail Seafood 50%                 2020: 64%
         US Seafood Sales 2019 vs 2020                   2020
$9,000

$8,000

$7,000

$6,000
                                          36%
$5,000

$4,000

$3,000

$2,000                                                                   64%
$1,000

   $0
              2019                2020

             Retail    Foodservice              Retail     Foodservice

                                                                     6
Update for New Brunswick Oysters - John Sackton Seafood Datasearch Province of New Brunswick March 2021 - Government of New Brunswick
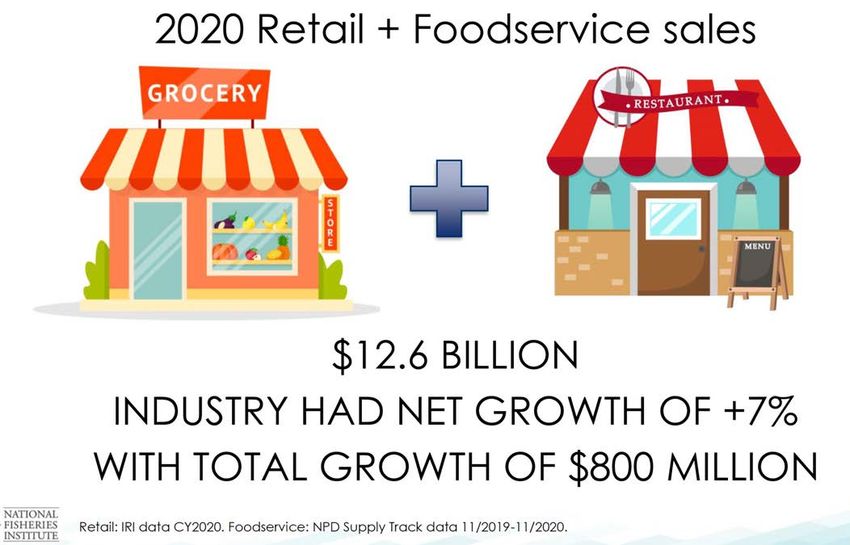
US Seafood Sales Grew in 2020

                           7
Update for New Brunswick Oysters - John Sackton Seafood Datasearch Province of New Brunswick March 2021 - Government of New Brunswick
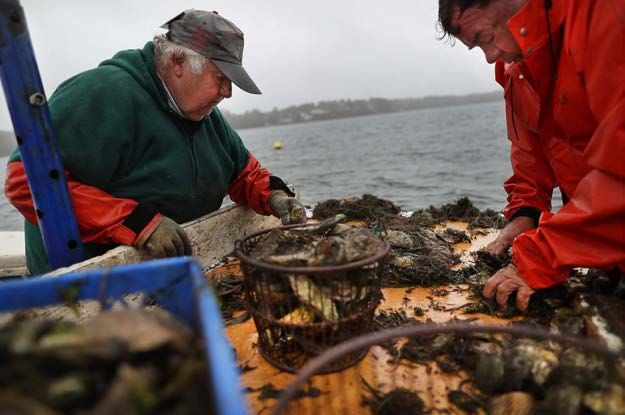
Industry got pandemic reprieve
             from retail seafood
       IRI Weekly Retail Data: Seafood,
               Meat, Deli Meat
             100=no change YOY
180

170           Seafood
160

150

140

130        Meat
120

110                       Deli Meat
100
        20

        20

        20
          0

          0

          0

          0

          0

          0

          0

          0

          0
       /2

       /2

       /2

       /2

       /2

       /2

       /2

       /2

       /2
     5/

     2/

     9/
  14

    21

    28

    12

    19

    26

    16

    23

    30
   7/

   8/

   8/
6/

  6/

  6/

  7/

  7/

  7/

  8/

  8/

  8/

              deli Meat       Meat    Seafood

                                                8
Update for New Brunswick Oysters - John Sackton Seafood Datasearch Province of New Brunswick March 2021 - Government of New Brunswick
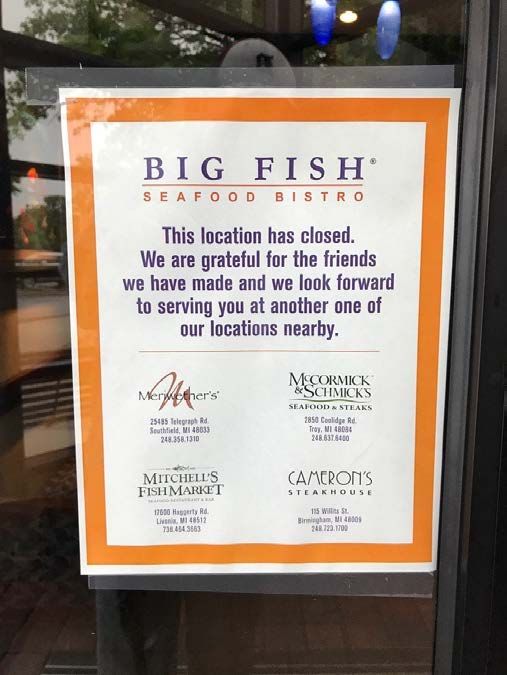
Frozen category very strong at retail

       IRI Weekly Retail Data: Frozen,
         General Food, Refrigerated
            100=no change YOY
135

130

125

120

115

110

105

100
        20

        20

        20
          0

          0

          0

          0

          0

          0

          0

          0

          0
       /2

       /2

       /2

       /2

       /2

       /2

       /2

       /2

       /2
     5/

     2/

     9/
  14

    21

    28

    12

    19

    26

    16

    23

    30
   7/

   8/

   8/
6/

  6/

  6/

  7/

  7/

  7/

  8/

  8/

  8/

           Frozen   General Food   Refrigerated

                                                  9
Update for New Brunswick Oysters - John Sackton Seafood Datasearch Province of New Brunswick March 2021 - Government of New Brunswick
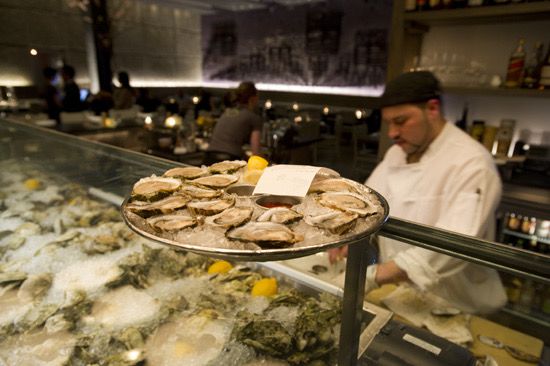
Frozen Seafood Had Better
 Performance than Fresh

                            10
Three trends helping seafood
           consumption
• Big Increase in home
  cooking
• Big increase in use of
  frozen food
• Continued emphasis
  on health during
  pandemic

Data from informal survey of changes in seafood consumption
                      by SeafoodNews
                                                              11
Pandemic has hit different
          sectors unevenly
• 70% of US Seafood dollar sales
  are at Foodservice
• Shut down of foodservice
  sector has had huge impact
• But impact was initially
  mitigated
• New round of shutdowns
  means more closures will be
  permanent
• Restaurant relief so far not a
  government priority

                                   12
Oyster recovery will depend on
      foodservice recovery
• Oyster consumption
  driven by younger
  people and oyster bars.
• They need to be in a
  social setting again to
  make oysters work.
• Pace of restaurant
  recovery will be critical
  to oyster farmers

                              13
Casual Dining and Fine Dining
     Restaurants Hit Harder

Source: Datassential Covid Tracker February 2021

                                                   14
Take-out is not making up for
        lost revenue

                           15
Operators Expect Some Recovery
80% Seeing lower revenue, but 54% expect higher sales in six months

                                                            16
Restaurant traffic has not yet recovered
                              Daily Change in Seated Restaurant Diners by Country
100

  Jan-Feb 2021              Feb 2020 to dec 2020

 50

  0
   1-Jan    1-Feb   1-Mar    1-Apr   1-May    1-Jun        1-Jul      1-Aug   1-Sep   1-Oct   1-Nov    1-Dec

 -50

-100

-150

                                     Canada           US           Germany       UK           Open table data

                                                                                                      17
March shows some recovery,
      more in US than in Canada
US Diners                       Canadian Diners

          -30%
                                       -60%

  Source: open table database

                                                  18
Restaurant industry recovery
        will be slow
              • March data remains 40%
                down in US, 60% in
                Canada
              • Changes don’t affect all
                seafood equally
              • Worst for oysters and
                items that didn’t have
                huge retail uptake
              • Will add to overall
                demand rather than shift
                retail demand

                                    19
Economic factors are key
risk for first half of this              Outlook for strong Canadian
year                                     seafood export performance has
•   US Gov’t and Economists and
    Federal Reserve all agree on large   improved
    scale stimulus boosting debt to
    WWII levels
•   After the 2008-2009 financial
    crash it consumers traded down to    Ramped up vaccine distribution
    lower value seafood. Prices took
    years to recover.                    in the US may lead to strong
•   Under current fiscal conditions,     economic recovery visible by
    stage is set for demand for
    seafood to outstrip current          summer
    supplies
•   Upward price pressure is likely
•   This rosy forecast could be
    upended by new virus variant
                                         Increased seafood buying helped
    outbreaks                            by maintenance of income levels.
                                         Stimulus package may provide
                                         income continuity

                                                                    20
Seafood met the moment in
             2020
• 33% of US adults
  bought seafood up
  from 25% in 2019
• 44% bought seafood
  online, up from 19%
  in 2019
• Consumers want
  more education               + 30% cooking at home
  about seafood
                   FMI power of seafood

                                                21
Oysters
• Oyster growers hit harder than other
  sectors
• Unlike lobster and snow crab, oyster
  price/volumes have not recovered after
  plunging this spring.
• Export price levels maintained by drastic
  cuts in volume
• US producers have seen a 50% price drop

                                       22
Oyster pricing is not changed,
     but volume has collapsed
• YTD farmed oyster     700,000                                                $5.00

  volume to the US is   600,000
                                                                               $4.50

  down 45%              500,000
                                                                               $4.00

                        400,000
                                                                               $3.50
                        300,000

                                                                               $3.00
                        200,000

                                                                               $2.50
                        100,000

                             0                                                 $2.00

                                                                        r
                                     ri l

                                     ne

                                                             De b e r
                                     ry

                                    ay

                                                                        t

                                                            No ber
                             Fe ry

                                                               Oc r
                                                       ly
                                    ch

                                                            Se gus

                                                                     be

                                                                    be
                                                   Ju
                                  ua

                                 Ap
                                   a

                                  ar

                                  M

                                  Ju

                                                                  m
                                nu

                                                                  to

                                                                  m
                                                                em
                                                        Au
                                M
                               br

                                                               ce
                                                               ve
                              Ja

                                                              pt
                                  2018   2019   2020         $/lb   $/lb    $/lb

                                                                    23
0
                            200,000
                                      400,000
                                                600,000
                                                          800,000
                                                                    1,000,000
                                                                                1,200,000
              1/1/18
              2/1/18
              3/1/18
              4/1/18
              5/1/18
              6/1/18
              7/1/18
              8/1/18
              9/1/18
              10/1/18
              11/1/18
              12/1/18
              1/1/19
              2/1/19
              3/1/19
              4/1/19
              5/1/19

     Canada
              6/1/19
              7/1/19

     Mexico
              8/1/19
              9/1/19
              10/1/19
              11/1/19
                                                                                            Monthly Farmed Oyster Imports

              12/1/19
              1/1/20
              2/1/20
              3/1/20
              4/1/20
              5/1/20
              6/1/20
                                                                                                                                to US, Mexico up 27%

              7/1/20
              8/1/20
              9/1/20
              10/1/20
              11/1/20
24

              12/1/20
                                                                                                                            Canadian shipments down 37%

              1/1/21
US Oyster Growers having
              difficult time

•   Massachusetts oyster farm sales down 50% from 2019; 43% from five year
    average.
•   Many oysters are being dumped because too large to sell
                                                                  25
Oyster support program pays
 farmers to put oysters on reefs
• $2 million in funding from Pew and US
  gov’t
• buy at least 5 million oysters to populate
  27 acres of reefs
• more than 100 shellfish companies will
  sell to the program,
• supports 200 jobs in New England, the
  Mid-Atlantic, and Washington state.
                                         26
East coast industry is suffering
• Some farmers say business
  down 75%
• Lack of restaurants is key
  reason
• Also, can’t sell oysters
  without license directly to
  consumers due to health
  issues
• Normal pricing is around $.60
  per oyster
• Reef program is buying at
  $.45
• Current market value is $.30

                                  27
Pandemic relief is supporting
           farmers
• 76 growers
  participated in       • PPP program
                          forgivable loans
  shucking project in
                        • USDA Crop Failure
  Mass.                   Payments
                        • CARES Act, NOAA
                          fisheries relief
                        • Reef building
                          payments

                                      28
After rapid growth, East coast
farmed oyster supply stabilized

                            29
Restaurant recovery could lead to
  expanded sales fairly quickly
•   Diners still have appetite for oysters
•   Part of missed experiences
•   Pricing is favorable, has not increased
•   Oyster consumers in the demographic
    most likely to resume restaurant and
    social activities

                                          30
Outlook
• Larger companies are better at managing crisis
• Farmed production is more stable than wild
  harvest
• A certain level of restaurant buying is
  continuing, and NB producers are taking
  advantage of that.
• Revitalizing restaurant sales of oysters will be
  critical to recovery

                                              31
Time for Questions
• Please put questions
  in chat and they will
  be presented.

                               32
You can also read