GEMS Presentation Health Market Inquiry - 1 March 2016
←
→
Page content transcription
If your browser does not render page correctly, please read the page content below

GEMS Presentation
Health Market Inquiry

            1 March 2016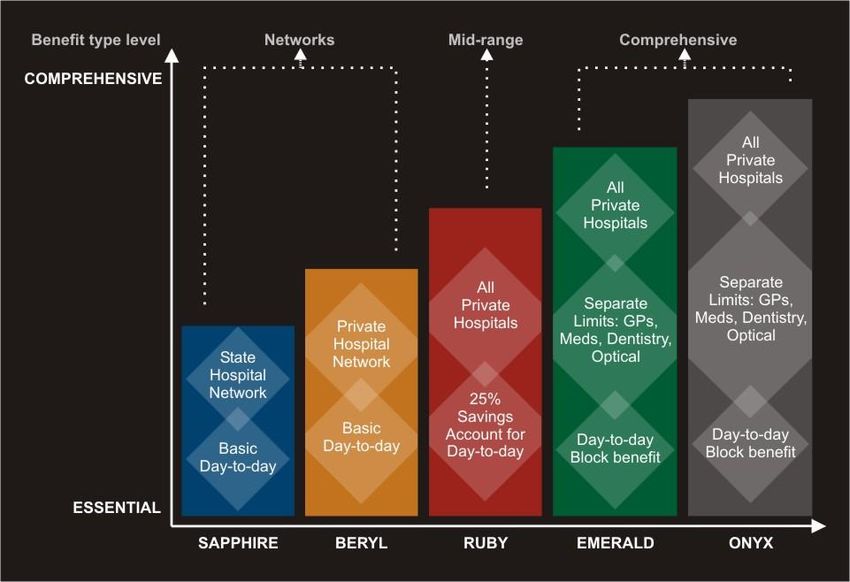
Structure
About GEMS
o   Background
o   Mandate, Mission, Vision and Values
o   Role of a Medical Scheme (Operating Framework)
o   Products (Plans) and Enrolment Criteria (Income Bands)
o   Governance and Service Structure
o   Scheme Statistics
o   Strategy and Approach
Impact of GEMS
o Industry Growth
o Access (No Underwriting)
o Decrease in non-healthcare Spend
Our Challenges
o PMBs
o Absence of Tariff and Pricing Structure
Considerations

ABOUT GEMS
(Who We Are)
Background
The public service is the country's largest employer with
approximately 1.3 million employees
In fulfilment of its obligation as an employer, the public service
provides its employees with a remunerative package structured to
include and cover:
o Retirement/Pensions (GEPF/GPAA)
o Housing Benefits (Allowance)
o Medical Benefits (Subsidy)
Prior to 2005, one of the challenges faced by the Employer was that
a significant and growing number of its employees were unable to
gain entry into existing medical schemes due to the high cost
structure
o To address this challenge it was resolved to establish a single restricted
  membership medical scheme to cover public service employees
Our Mandate, Mission, Vision and Values

To ensure that there is adequate provisioning
of healthcare coverage to public service
employees that is efficient, cost-effective and
equitable; and to provide further options for
those who wish to purchase more extensive           Mandates
cover.

                                                                 To provide all public service
                                                                 employees with equitable access to
                                             Vision              affordable and comprehensive
                                                                 healthcare benefits.

   An excellent, sustainable and
   effective medical scheme for all
   public service employees.
                                                     Mission

                                                  Values
                                                               Excellence
                                                               Member-centricity
                                                               Integrity
                                                               Value for money
                                                               Innovation
Evolution of the GEMS Mandate and Role Since 1999: Equitable Access to Medical Assistance Cabinet approved the registration of GEMS in 2004 Registered in 2005 and commenced enrolment in 2006 July 2006 a new medical subsidy policy was introduced GEMS like all medical schemes operates within the legal framework provided by the Medical Schemes Act
The Role of a Medical Scheme
 “Business of a medical scheme” means the business of undertaking liability in
 return for a premium or contribution:
  a) To make provision for the obtaining of any relevant health service;
  b) To grant assistance in defraying expenditure incurred in connection with the rendering of any relevant
     health service; and
  c) Where applicable, to render a relevant health service, either by the medical scheme itself, or by any
     supplier or group of suppliers of a relevant health service or by any person, in association with or in
     terms of an agreement with a medical scheme
 “restricted membership scheme” means a medical scheme, the rules of which
 restrict the eligibility for membership by reference to:
  a)    Employment or former employment or both employment or former employment in a profession,
        trade, industry or calling;
  b)    Employment or former employment or both employment or former employment by a particular
        employer, or by an employer included in a particular class of employers;
  c)    Membership or former membership or both membership or former membership of a particular
        profession, professional association or union; or
  d)    Any other prescribed matter
 “rules” means the rules of a medical scheme and include:
   a)    The provisions of the law, charter, deed of settlement, memorandum of association or other
         document by which the medical scheme is constituted;
   b)    The articles of association or other rules for the conduct of the business of the medical scheme; and
   c)    The provisions relating to the benefits which may be granted by and the contributions which may
         become payable to the medical scheme
Critical Aspect s for GEMS as a
Medical Scheme
Scheme
Members
Contributions
Advisors o Scheme rules
Bank account
Actuaries o Registrar and
Auditors Benefit options Council
o Medical Schemes
Investment Claims
Act
Managed care
AdministratorsGovernance & Operational Structure
Governance , Direction & Oversight
Members
Employer
Employees
Board of Trustees Committees Support Services
Advisory,
Actuaries,
Auditors
Execution of Strategy & Investment
determination of Operational Principal Officer
deliverables Executive & Head Office
OUTSOURCED SERVICES
Performance of
Operational Administration Managed Care
Functions o Enrolment and Registration o Authorization Management
o Benefit Management and o Disease Management
Claims Payment o Claims Adjudication
o Member servicing (Contact
Centre Support).Conceptualisation and establishment
“The state as an employer seeks to ensure that there is adequate provisioning of healthcare
coverage to public service employees that is efficient, cost-effective and equitable”
Cabinet Mandate (2004)
Registration (2005)
Funding R28 Billion (2015)GEMS’ Strategy and Plan
The Scheme’s Strategy is based on a Three Year Planning
Cycle (Currently 2014 – 2016)
The GEMS Strategy is underpinned by four key pillars of:
Making healthcare spending a progressively smaller portion of
Affordability household income, while minimising member out-of-pocket spending
on healthcare for government employees from all income groups
Understanding member profiles and needs, promoting healthy
behaviours through well incentivised loyalty programmes that
Understanding Members
encourage members to lead healthier lives, minimising their risk of
developing lifestyle-related diseases
Promoting effective disease management of members and improving
Healthier Members the clinical outcomes so that they remain healthy and productive
members of the public service
Working together with government bodies and leading industry
Partner to Organs of the players, both local and international, to bring about innovative
State methods and leading practices in healthcare for the ultimate benefit
of societyPrioritising healthcare
GEMS has realised significant savings on non-healthcare costs.
Non-healthcare costs Cost savings
15%
13,0%
11,8%
12%
9%
8,7%
7,4%
R1 200 000,000
6%
per year
3%
0%
Open Schemes Closed Schemes GEMS Total
(excluding GEMS) (excluding GEMS)Prioritising healthcare
The R1,2 billion saved on non-healthcare expenditure allows for more healthcare services to
be funded.
3 million consultations
with family practitioners
500 000 radiology Or the total healthcare costs of
investigations
70 000 beneficiaries per year
12 000 hospital
admissionsScheme Statistics
2015
Principal Members 674,936
Beneficiaries 1,781,770
Eligible Members on GEMS 55%
Average Age 30.78
Level 1-5 46%
Average Family Size 2.64
Pensioner Ratio 13.70%
Claims Ratio 92.63%
• Hospital Spend 38.22%
Gross Contributions 28,139,221,000
Claims 25,539 ,196,000
Non Healthcare Cost 2,043,505,000Major Utilisation Cost Drivers
Practice Type Cost Paid (R)
Medical Specialists 2 824 183 078
General Practitioners 1 925 785 906
Optometrist 529 751 877
Pathologists 1 488 219 231
Radiologist 975 135 470
Dentist 534 044 298
Supplementary & Allied Health Services 2 823 406 633
Emergency Medical Services (EMS) 287 282 331
Private Hospitals 9 606 324 013
Provincial hospitals 101 395 668
Medicines 4 346 497 705
Private Hospital and Medical Specialists comprises of more than 45% of
the total
Scheme paid R1.8 billion above Scheme rates as PMBUtilisations Statistics
2014 Beneficiaries vs. Claims
14 000 000 000
5% of beneficiaries incur 51% of costs in any given year
12 000 000 000
Benefit amount paid
10 000 000 000
8 000 000 000
6 000 000 000
4 000 000 000
5 : 51
2 000 000 000
0
0% - 5%
65% - 70%
10% - 15%
15% - 20%
20% - 25%
25% - 30%
30% - 35%
35% - 40%
40% - 45%
45% - 50%
50% - 55%
55% - 60%
60% - 65%
70% - 75%
75% - 80%
80% - 85%
85% - 90%
90% - 95%
5% - 10%
95% - 100%
Band of beneficiariesClaims Ratio
2014 Claims ratio per family
1800%
1600% 79% of beneficiaries pay more than is claimed back in any given
year
1400%
1200%
1000%
800%
600%
79%
400%
200%
0%Medical Plans/Options
Enrolment Criteria (Income Bands)
                                       Sapphire and Beryl
                      Income Bands                          2016 Contribution per Member
         2015                               2016             Sapphire             Beryl
      R0 - R6 860                        R0 - R7 340          R776                R895
    R6 861 - R9 625                  R7 340.01 - R10 299      R813                R971
   R9 626 - R16 490                  R10 299.01 - R17 644     R864               R1 059
       R16 491+                           R17 644+            R961                R1270
                                       Ruby and Emerald
                      Income Bands                          2016 Contribution per Member
         2015                               2016              Ruby               Emerald
     R0 - R10 330                       R0 – R11 053         R1 796              R1 996
   R10 331 - R17 840                 R11 053.01- R19 089     R2 000              R2 210
       R17 841+                           R19 089+           R2 224              R2 477
                                              Onyx
                      Income Bands
         2015                               2016            2016 Contribution per Member
     R0 - R10 330                        R0 - R11 053                  R3 193
  R10 331 - R22 010                  R11 053.01 – R23 551               R3 322
       R22 011+                          R23 551.01+                    R3 587
Impact of no change in Subsidy Member portion of contributions increased from 35% to 48%
Impact of New Subsidy
                                              2011                2015          2016
                                             Monthly             Monthly       Monthly
        Family structure
                                            medical aid         Medical Aid   Medical Aid
                                             subsidy             Subsidy       Subsidy
Principal Member without
                                              720.00                 925.00   1,008.00
dependants
Principal Member with one
                                            1,440.00            1,850.00      2,017.00
dependant
Principal Member with two
                                            1,880.00            2,415.00      2,633.00
dependants
Principal Member with three
                                            2,320.00            2,980.00      3,249.00
dependants
Principal Member with four or
                                            2,760.00            3,545.00      3,865.00
more dependants
   2015 Subsidy increase of 28.5% in line with the PSCBC Resolution

   2016 Subsidy increase of 9% linked to Medical Price Index (MPI)
Affordability
\ On average, GEMS’ contributions represent 8% of income after allowing for
employer subsidies (and 20% of income before allowing for subsidies).
Before subsidy After subsidy
Sapphire 19% 1%
Beryl 16% 4%
Ruby 20% 7%
Emerald 21% 9%
Onyx 17% 11%
Total 20% 8%Affordability
\ On average, GEMS’ is 19% more affordable than comparable plan options
Less expensive than
comparative Schemes
Sapphire 26%
Beryl 15%
Ruby 1%
Emerald 27%
Onyx 25%
Total 19%Understanding members
Understanding member profiles and needs, promoting healthy behaviours through
incentives that encourage members to lead healthier lives.
Mammograms Pap smears
(annual) (annual)
PSA tests Bone density
(annual) scans
GEMS will offer industry leading preventative
care and screening test benefits in 2016.
Glaucoma Occult blood
screening screening
Influenza Pneumococcal
vaccinations vaccinations
GEMS is now participating in the Health Quality Assessment (HQA) – this is further
indication of the Scheme’s commitment to improving healthcare outcomes.Disease Management Programmes Chronic Disease Management Numbers (2015) Programme Diabetes 90 634 Hypertension 210 825 HIV 119 894 Mental Health 48 446 Oncology 11 133 More than 20% of beneficiaries have Chronic Diseases Number of
The Funding Challenge
2014 Cost ratio examples

                 27
  Chronic Renal Disease

                3           For every beneficiary with hypertension,
                           GEMS requires 3 healthy members to cross-
          Hypertension
                                           subsidise

                 3
                   HIV

                 3
       Hypothyroidism
Hospital-centric Care is Dominant
In- and out-of-hospital spend Spend by discipline
10%
13%
38% 39%
43%
38%
19%
Hospital spend Hospital related spend Out of hospital spend Family Practitioners Specialists Hospitals Other
Only 10% of spend pertains to family
Nearly 60% of expenditure pertains to hospital
practitioners (which is higher than the industry
or hospital-related costs
average of 7,0%)Healthier members Disease management programmes • Disease specific programmes aimed at improving clinical outcomes HIV programmes • Holistic wellness and prevention of avoidable hospitalisations Maternity programmes • Early detection and treatment of comorbidities and complications Back management programmes • Promotion of conservative treatment where clinically appropriate Diabetes management programmes • Holistic wellness and prevention of avoidable hospitalisation
2015 Healthcare Indicators
                                Q1    Q2    Q3    Q4    FY    Target

Disease Outcome Measures:

- HIV/AIDS

Enrolment on HIV DMP as a %
                                76%   79%   82%   83%   79%   77%
of Scheme prevalence rate

Viral Load 6
months who show an              83%   88%   84%   90%   86%   85%
improvement in CD4 count
2015 Clinical Statistics
HIV/AIDS Q1 Q2 Q3 Q4 FY Target
Health Outcomes
Pneumonia hospital 13 110 16 974 14 760 12 121 56 965
admissions
2 299 1 763 1 957 1 913 7932
TB hospital admissions
% increase/decrease
Reduce by 5%
over previous year - -11% 4% -19% 5% -5%
per year
Pneumonia hospital
admissions
Reduce by 5%
% increase/decrease -22% -25% -20% -4% -17%
per year
over previous year - TB
hospital admissionsPartner to organs of state
Working together with government bodies and leading industry players to bring
about innovative methods and leading practices in healthcare to the ultimate
benefit of society.
Data sharing and support of strategic initiatives
Supporting NHI pilot site in Eastern Cape
Benchmarking SA private hospital costs
Data sharing on male medical circumcisionsGEMS Model
Efficient practitioner networks Comprehensive disease
management programmes
Family practitioner networks
(already well established)
HIV Maternity
Specialist networks
(obstetricians and paediatricians) Diabetes Back pain
Hospital networks And more
(Currently in Development) …Impact of GEMS
Growth

GEMS has realised significant and sustained growth and is now the second largest medical
                                 scheme in South Africa

2007   2009    2011   2013   2014

Over 1,7 million beneficiaries      1 in 5 beneficiaries       1 in R10 spent on healthcare
Impact of GEMS Growth on Industry
Medical scheme membership is flat in 2014 (CMS)Prioritising healthcare
GEMS has realised significant savings on non-healthcare costs.
Non-healthcare costs Cost savings
15%
13,0%
11,8%
12%
9%
8,7%
7,4%
R1 200 000,000
6%
per year
3%
0%
Open Schemes Closed Schemes GEMS Total
(excluding GEMS) (excluding GEMS)Balancing Sustainability with Social
Solidarity
GEMS has achieved solid financial results in the context of social solidarity.
No waiting periods
No late joiner penalties
Income-related contributions
2010 2011 2012 2013 2014 2010 2011 2012 2013 2014
Increasing reserves Stable loss ratio Broad beneficiary definitions
Aligned to the Principles of Universal Healthcare CoverageOur Challenges
Industry Dynamics
Healthcare is increasing in real terms (CMS)
The PMB Challenge

The regulation stipulates that PMBs must be paid at cost
When PMBs were introduced the “pay in full” provision wasn’t a risk for
medical schemes
Healthcare tariffs were collectively negotiated by medical schemes and
healthcare providers at the time
Tariffs were published in a “reference price list”
Professional healthcare organisations published “ethical” charging
guidelines setting limits
o Claims that are not PMBs are subject to benefit limits, co-payments and being paid
  at scheme tariff
PMB claims may be limited to scheme tariff if the scheme has a DSP for
that healthcare service and the member voluntarily used a provider who
is not a DSP
o This creates an incentive for providers to change the way they apply clinical coding
  to claims in order to ensure that claims will be paid as PMBs
The PMB Challenge
Like all Schemes a significant challenge for GEMS is the issue of PMBs
In 2015 the cost of PMB benefits alone was in excess of R760 per life per month
PMB cost for GEMS have almost doubled over the past five years and accounts
for more than 50% of claims
          PMB and non-PMB claims PLPM
        900
        800
        700
        600
        500
        400
        300
        200
        100
          0
              Jan MarMay Jul Sep Nov Jan MarMay Jul Sep Nov Jan MarMay Jul Sep Nov
                       2013                   2014                   2015
                                  Non-PMB claim      PMB claim
Incidence
The proportion of claims classified as PMBs has increased significantly in recent years. In 2010, 60.7% of
expenditure was classified as a PMB. By 2015, 72.3% of expenditure was classified as a PMB. This
amounts to an increase of 19.0%.
100%
90%
80%
72% 72% 72%
70% 66%
61% 63%
% of expenditure
60%
50%
39% 37%
40% 34%
28% 28% 28%
30%
20%
10%
0%
2010 2011 2012 2013 2014 2015
PMB Non-PMB
In this context, PMBs refer to claims flagged as PMBs as well as potential PMB claims on according to ICD
10 codes. Pharmacy claims are not considered given their limited impact on Prescribed Minimum Benefits.Disaggregating Trends
By discipline By diagnosis
% PMB
% PMB
2010 2011 2012 2013 2014 2015 2010 2011 2012 2013 2014 2015
Increases are evident across provider types. Increases are evident across diagnosis categories.
Whether such substantial and consistent Whether such consistent increases across
increases can simply be attributed to variances in diagnoses is a function of changes in the mix of
the clinical characteristics of patients is diagnoses is questionable
questionableCost
Payments in excess of tariff Payments in excess of tariff, as a % of PMB
R 2 000 000 000 R 100 expenditure
12,0%
R 1 800 000 000 R 90
11,5%
R 1 600 000 000 R 80 11,0%
R 1 400 000 000 R 70 10,5%
10,0%
R 1 200 000 000 R 60
9,5%
R 1 000 000 000 R 50
9,0%
R 800 000 000 R 40
2011 2012 2013 2014 2015 8,5%
Payments in excess of tariff
8,0%
Payments in excess of tariff PLPM 2011 2012 2013 2014 2015
In 2011, payments in excess of tariff amounted to In 2011, the amount paid in excess of tariff was
R839 million. This increased by 22.2% per year to 9.2% of the PMB expenditure. By 2015, this had
R1,869 billion in 2015. increased to 11.4%.Considerations
Potential for Way Forward

There should be consideration of a pricing framework
through a collective bargaining structure for fees and tariffs
Develop national PMB billing rate file that provides a ceiling
or cap
o Regulation 8 to be amended to reflect billing and payment for PMBs
  to be at a national PMB billing rate
o Enforce uniform billing between PMB and non PMB services without
  a significant difference in the rates
o Opening up healthcare to competitive pricing below the cap
The current PMB framework is hospital centric and
consideration should be given to revise PMB entitlements in
the regulations with a shift to primary care
Thank You
You can also read