Genetic Analysis of Brain Images from 21,000 People: The ENIGMA Project
←
→
Page content transcription
If your browser does not render page correctly, please read the page content below
Genetic Analysis of Brain Images from
 21,000 People: The ENIGMA Project
                Paul M.Thompson1
      on behalf of the ENIGMA Consortium2
               1Professor  of Neurology & Psychiatry,
       Imaging Genetics Center, Laboratory of Neuro Imaging,
             David Geffen School of Medicine at UCLA,
                        Los Angeles, CA, USA
                   2 http://enigma.loni.ucla.edu

                      thompson@loni.ucla.edu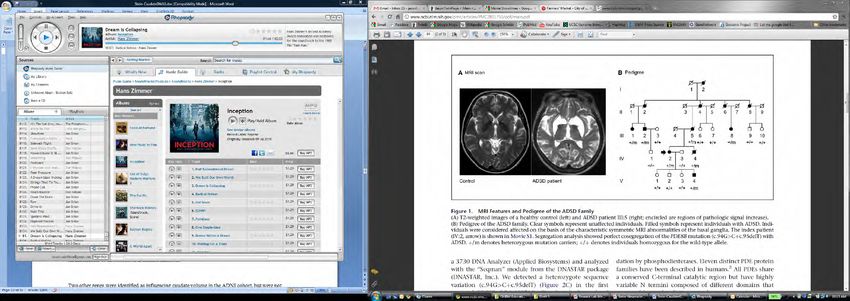
Introduction: What is the ENIGMA
Project?
Worldwide Consortium – we relate human brain images to
genome-wide scans (>500,000 common variants in your DNA)
Discover genetic variants that affect brain / may also affect
disease risk
Enabled largest brain imaging studies ever performed (Nature
Genetics, Apr 15 2012; 21,151 subjects, now increasing)
207 co-authors, 125 institutions, >500,000 SNPs, range of brain
measures (massive global collaboration; “Crowd-sourcing”)
Founded 2009 by triumvirate of imaging genetics labs: Thompson
(UCLA), Wright/Martin (Queensland), Franke (Netherlands), many
more PIs & their teams run Working Groups
Working Groups assess different brain measures – ENIGMA2
(morphometry), ENIGMA-DTI, ENIGMA-PIB, ENIGMA-Mouse,
ENIGMA-PGC, Case-Control Working Groups ….
Why screen 21,000 brain images?
Amass a sample so vast that we can see how single-letter
changes in your DNA affect the brain, in the midst of all the
other factors that affect your brain (age, education, abused
drugs, alcohol, body mass index, ..)
Do epidemiology with images (exercise, diet, medication)
Discover genes that:
- promote brain degeneration / risk for disease, affect brain wiring
and organization (new leads in autism, Alzheimer’s disease)
- help estimate our personal risk of mental decline
- genetic profiling can empower drug trials (we do this now)
Discover new drug targets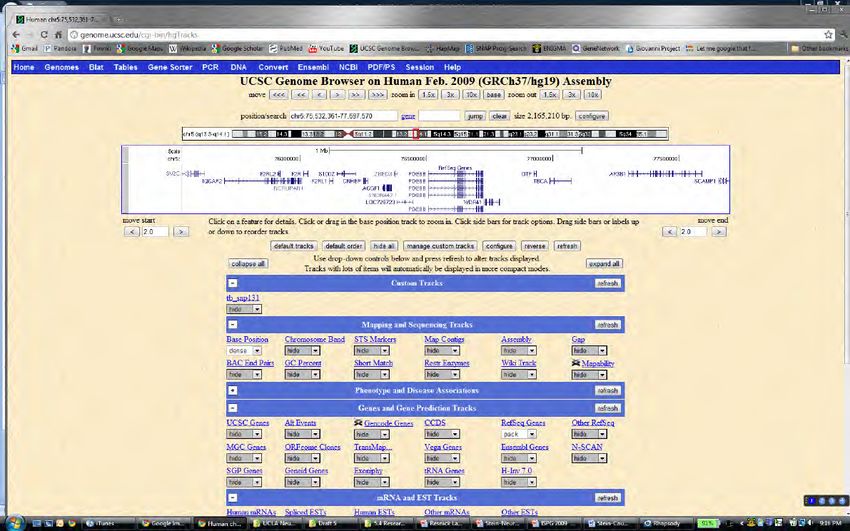
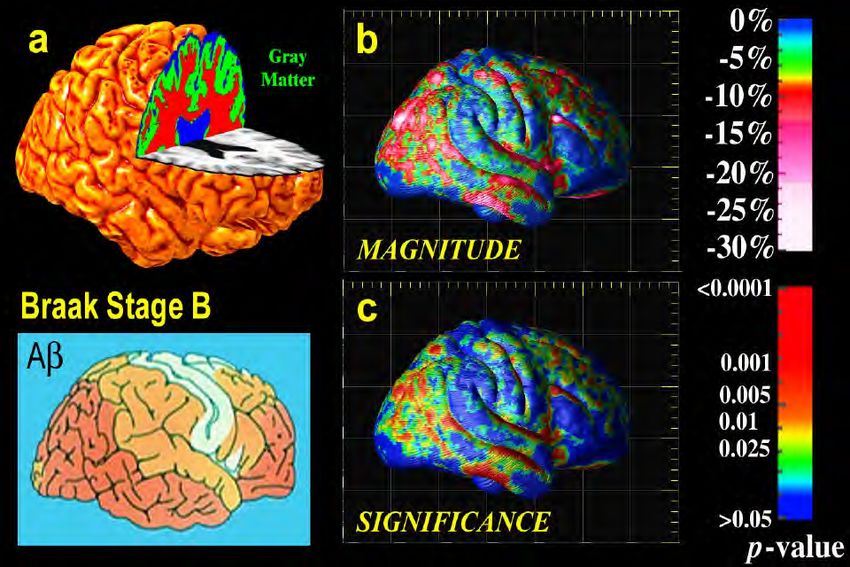
What factors harm the brain? 1. Diseases, such as Alzheimer’s – several commonly carried
genes boost our risk for this (ApoE4: 3x; CLU, CR1, PICALM: 10-20% more risk each)
What helpful or harmful factors affect the brain? 1. Diseases, such as Alzheimer’s Disease – several
commonly carried genes boost our risk for this (ApoE4: 3x; CLU, CR1, PICALM: 10-20% more risk)
Imaging can pick up very subtle modulatory effects -
        Olanzapine Slows Gray Matter Loss;
           Imaging Reveals Differences;
       maybe it can also pick up gene effects

               Thompson/Bartzokis/Lilly-HGDH Drug Trial/Lieberman 2008
‘Obese’ People have 8% more brain atrophy locally (N=432 MRI scans).
Maps show % tissue deficit per unit gain in body mass index (BMI)

  1Raji   et al. Brain Structure and Obesity. Human Brain Mapping, Aug. 2009.
Geneticists discovered an “obesity susceptibility
gene” (FTO) – surprisingly, we were able to pick
up the effect of this common variant in brain
images (Ho PNAS 2010)

                BMI                              FTO association
 (N=206 healthy elderly; corrected for   (N=206 healthy elderly; corrected for
       multiple comparisons)                   multiple comparisons)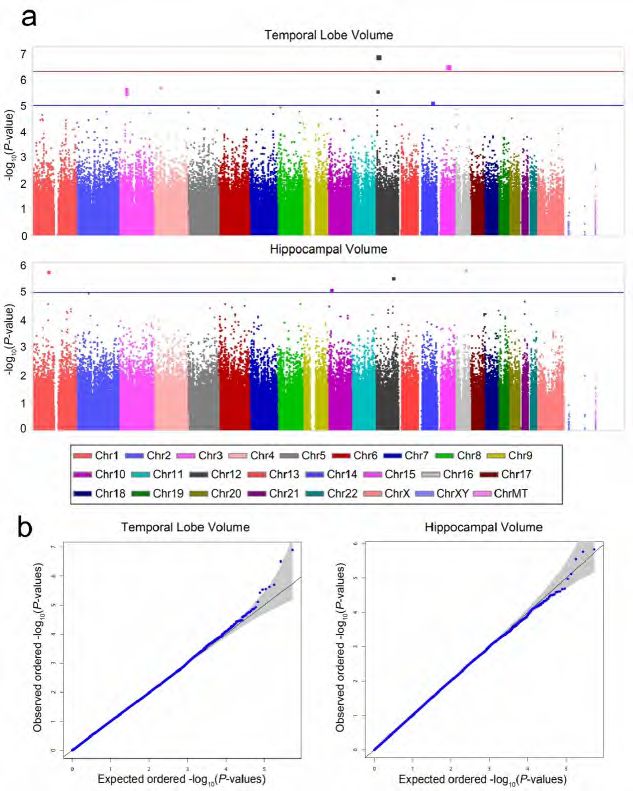
Obesity Risk Gene Carriers have Greater Brain Atrophy
  46% of Western Europeans carry at least one adverse allele at this
              obesity risk locus, in FTO gene; for each ‘bad’ allele:
gain 3 lbs, 1/2 inch waist circumference, crave ~200 more calories/day
  They have a regional ~10% frontal lobe, ~15% occipital lobe deficit
locally – regions with atrophy in people with higher BMI.
      May be direct effect on brain, or mediated by BMI, or both
Significance
Maps in
N=206
normal
subjects

  April J. Ho1*, Jason L. Stein1*, Xue Hua PhD1, Suh Lee1, Derrek P. Hibar1, Alex D. Leow MD PhD1,2, Ivo D. Dinov PhD1, Arthur W. Toga PhD1,
        Andrew J. Saykin PsyD3, Li Shen PhD3, Tatiana Foroud PhD4, Nathan Pankratz4, Matthew J. Huentelman PhD5, David W. Craig PhD5, Jill
        D. Gerber5, April N. Allen5, Jason J. Corneveaux5, Dietrich A. Stephan6, Bryan M. DeChairo PhD7, Steven G. Potkin MD8, Clifford R. Jack
        Jr MD9, Michael W. Weiner MD10,11, Cyrus A. Raji PhD12,13, Oscar L. Lopez MD17, James T. Becker PhD14-16, Owen T. Carmichael PhD18,
        Charles S. DeCarli MD19, Paul M. Thompson PhD1,*, and the ADNI (2010). Commonly carried allele within FTO, an obesity-associated
        gene, relates to accelerated brain degeneration in the elderly, PNAS 2010.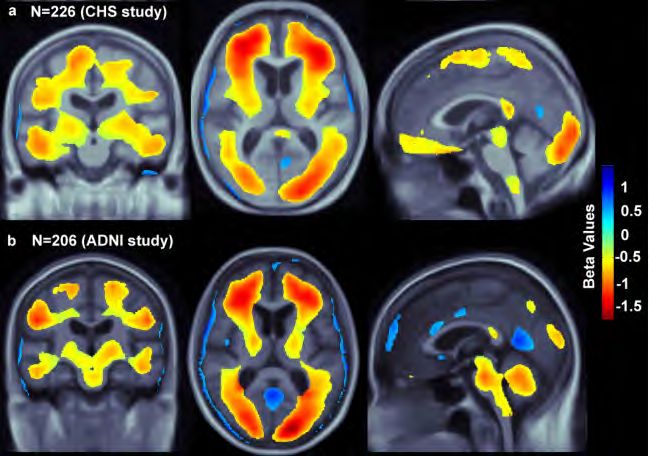
Depending on your FTO genotype,
 BMI may affect you in a different way

     1 or 2 risk alleles

                                N=128, critical P=0.016

       2 risk alleles

                                N=33; critical P=0.0022

       1 risk allele

                               N=95; critical P= 0.0113

*Does not pass FDR
at 5% in non-carriers (N=78)

                                               Ho et al., PNAS 2010
Alzheimer’s risk gene carriers (CLU-C) have lower fiber integrity even when young (N=398), 50 years before disease typically hits [News covered in 20 countries] Voxels where CLU allele C (at rs11136000) is associated with lower FA after adjusting for age, sex, and kinship in 398 young adults (68 T/T; 220 C/T; 110 C/C). FDR critical p = 0.023. Left hem. on Right Braskie et al., Journal of Neuroscience, May 4 2011
Effect is even stronger for carriers of a
           schizophrenia risk gene variant, trkA-T (N=391 people)

a.  p values indicate where NTRK1 allele T carriers (at rs6336) have lower FA after adjusting for age, sex, and kinship in 391
    young adults (31 T+; 360 T-).
FDR critical p = 0.038.

b. Voxels that replicate in 2 independent halves of the sample (FDR-corrected). Left is on Right.
                                                                                      Braskie et al., Journal of Neuroscience, May 2012
…also found for BDNF gene (N=455 people). This is a well-known
growth factor gene. Has been associated with working memory.
Can we use these discoveries to develop a genetic test to
help predict your brain integrity?
To some extent yes. Use a polygenic prediction
model based on all these SNPs.
Chiang et al., Neuroimage 2011We developed a polygenic test that can predict a small
proportion of the variance in brain integrity (7 SNPs) and rate
of brain loss (empower drug trials)
Neuro-chemical COMT
genes
NTRK1
Neuro- ErbB4
developmental
genes BDNF
Neuro- HFE
degenerative A significant fraction of variability in white matter
CLU structure of the corpus callosum (measured with
risk genes
DTI) is predictable from SNPs;
Holds up in independent, non-overlapping samples.
Kohannim O, et al. Predicting white matter integrity from multiple common genetic variants. Neuropsychopharmacology 2012, in press.Brain measures are arguably* a good target for
genetic analysis – may be easier to find genetic
variants that directly affect the brain
difficult
May require 10,000-30,000 people
e.g., the Psychiatric Genetics
Consortium studies
easier?
Gene variants may affect brain
measures directly, many brain
measures relate to disease
status, they can be precisely
and reproducibly measuredFinding Genetic Variants
Influencing Brain Structure
CTAGTCAGCGCT
CTAGTCAGCGCT
CTAGTCAGCGCT
Intracranial Volume
CTAGTCAGCGCT
…
CTAGTAAGCGCT
CTAGTAAGCGCT
CTAGTAAGCGCT C/C A/C A/A
CTAGTCAGCGCT
SNP
Phenotype Genotype AssociationWhat do genome wide association studies (GWAS) try to find?
- common genetic variants related to a brain measure, or a disease,
or a trait such as obesity, found by searching the genome
99.9% of DNA is the same for all people - DNA variation causes
changes in height, personality, predisposition to disease, and
brain structure.
One type of variation is a single nucleotide polymorphism (SNP)
- Single letter change in the DNA code
23 pairs of chromosomes
In a particular part of the chromosome 5 there are many genes
Within a gene there are exons,
introns, and SNPs
Single Nucleotide Polymorphism (SNP)Genome-wide Association Study
One SNP Screening
“Candidate gene” approach 500,000 SNPs – 2,000,000 SNPs
e.g., BDNF
Intracranial Volume
-log10(P-value)
Position along genome
An unbiased search to find where in the genome a
C/C A/C A/A variant is associated with a trait.Genome-wide association study
Which genomic variants are associated with a trait?
One SNP 500,000 to 2 million SNPs
Caudate Volume Change
P-value
Position along genome
A/A A/C C/C
You hope to find a statistical association that is stronger than
Genotype
20 million to 1, as you are testing so many SNPs
Usually need large samples (20,000 people)
GWAS = Finding common variants that explain some of the variation in a trait.First Genome-Wide Screens of Brain Images (2009-2010)
GRIN2b genetic variant was suggestively associated with 2.8% temporal
lobe volume deficit; this was later replicated in a non-overlapping cohort
The NMDA-type glutamate receptor is a target of memantine therapy;
first detected with GWAS in N=742 subjects from the ADNI cohort
GRIN2b is over-represented in AD
- could be considered an Alzheimer’s disease risk gene
- needs replication
Jason L. Stein1, Xue Hua PhD1, Jonathan H. Morra PhD1, Suh Lee1, April J. Ho1, Alex D. Leow MD PhD1,2, Arthur W. Toga PhD1, Jae Hoon Sul3, Hyun Min Kang4, Eleazar Eskin PhD3,5,
Andrew J. Saykin PsyD6, Li Shen PhD6, Tatiana Foroud PhD7, Nathan Pankratz7, Matthew J. Huentelman PhD8, David W. Craig PhD8, Jill D. Gerber8, April Allen8, Jason J. Corneveaux8,
Dietrich A. Stephan8, Jennifer Webster8, Bryan M. DeChairo PhD9, Steven G. Potkin MD10, Clifford R. Jack Jr MD11, Michael W. Weiner MD12,13, Paul M. Thompson PhD1,*, and the ADNI
(2010). Genome-Wide Analysis Reveals Novel Genes Influencing Temporal Lobe Structure with Relevance to Neurodegeneration in Alzheimer's Disease, NeuroImage 2010.GRIN2b (glutamate receptor) genetic variant associates with brain volume
in these regions; TT carriers have 2.8% more temporal lobe atrophy
Effect was later
replicated in
a younger cohort
(Kohannim 2011)
Jason L. Stein1, Xue Hua PhD1, Jonathan H. Morra PhD1, Suh Lee1, April J. Ho1, Alex D. Leow MD PhD1,2, Arthur W. Toga PhD1, Jae Hoon Sul3, Hyun Min Kang4, Eleazar Eskin PhD3,5,
Andrew J. Saykin PsyD6, Li Shen PhD6, Tatiana Foroud PhD7, Nathan Pankratz7, Matthew J. Huentelman PhD8, David W. Craig PhD8, Jill D. Gerber8, April Allen8, Jason J. Corneveaux8,
Dietrich A. Stephan8, Jennifer Webster8, Bryan M. DeChairo PhD9, Steven G. Potkin MD10, Clifford R. Jack Jr MD11, Michael W. Weiner MD12,13, Paul M. Thompson PhD1,*, and the ADNI
(2010). Genome-Wide Analysis Reveals Novel Genes Influencing Temporal Lobe Structure with Relevance to Neurodegeneration in Alzheimer's Disease, NeuroImage, 2010.Effect of carrying adverse SNP is ~1.4%
lower volume per allele, same as ENIGMA’s
top SNP GRIN2B SNP
intergenic SNP
GRIN2B SNP (rs10845840)Brain measures are a good target for genetic
analysis – common DNA variation affects them
and they relate to disease status
STEP 1 – THIS
CONNECTION
STEP 2 – OUR STUDY FOUND
WAS WELL-ESTABLISHED
THIS CONNECTION
P = 1.26x10⁻⁷; later replicated
P = 5.19x10⁻¹¹
STEP 3 – CAN LATER CHECK IF IT IS
ASSOCIATED WITH DISEASE, P = 0.039;
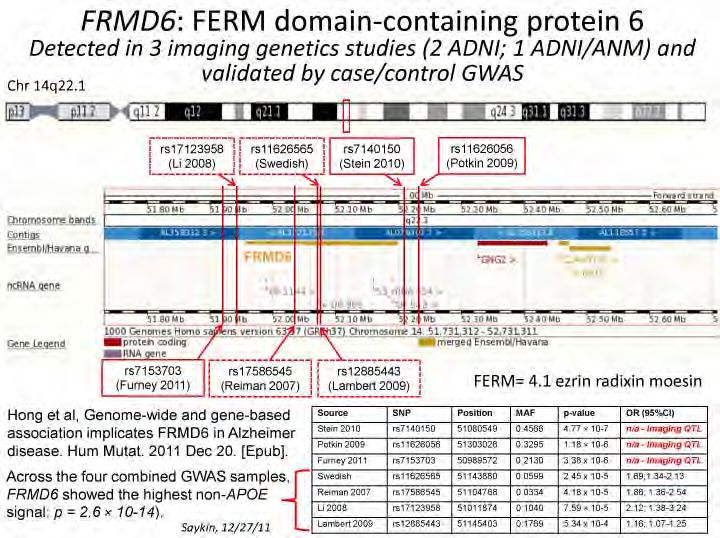
NEEDS REPLICATIONFRMD6 gene story - Imaging Genetics can take the lead
in uncovering disease-relevant genes
Novel candidate gene for AD
First recognized in several imaging genetics analyses
- later replicated in a large case/control cohort
- and by reanalysis of prior case/control GWAS data.
Furney et al phenotype was ventricular volume
Potkin et al was local hippocampal volume
Stein et al was a voxel-based map of regional brain volume differences.
Odds ratios for FRMD6 SNPs from the 4 GWAS studies in Hong et al
range from 1.16 to 2.12 - larger than most top AD genes (Nature Genetics, April 2011)
But still well below APOE (OR ~ 3).
FRMD6 appears promising as a replicated candidate gene.
Little data so far on its biological function.
Jason L. Stein1, Xue Hua PhD1, Jonathan H. Morra PhD1, Suh Lee1, April J. Ho1, Alex D. Leow MD PhD1,2, Arthur W. Toga PhD1, Jae Hoon Sul3, Hyun Min Kang4, Eleazar Eskin PhD3,5,
Andrew J. Saykin PsyD6, Li Shen PhD6, Tatiana Foroud PhD7, Nathan Pankratz7, Matthew J. Huentelman PhD8, David W. Craig PhD8, Jill D. Gerber8, April Allen8, Jason J. Corneveaux8,
Dietrich A. Stephan8, Jennifer Webster8, Bryan M. DeChairo PhD9, Steven G. Potkin MD10, Clifford R. Jack Jr MD11, Michael W. Weiner MD12,13, Paul M. Thompson PhD1,*, and the ADNI
(2010). Genome-Wide Analysis Reveals Novel Genes Influencing Temporal Lobe Structure with Relevance to Neurodegeneration in Alzheimer's Disease, NeuroImage 2010.Beginnings of ENIGMA – 2 large populations; discover genes in
one, then see if they replicate in the other
Study Name Subjects Genetic Age/Sex
Information Distribution
Alzheimer’s 734 healthy Illumina 610K 75.5 ± 6.8 years
Disease elderly, MCI, GWAS 432 male/302
NeuroImaging and AD female
Initiative (ADNI)
Brisbane 464 young Illumina 610K 23.7 ± 2.1 years
Adolescent/ healthy MZ/DZ GWAS 188 male/276
Young Adult twins (239 female
Longitudinal families)
Twin Study
(BLTS)Finding the Caudate Nucleus Automatically in 1198 MRI
Scans – we can measure its volume reliably
Reliability in repeated scans of 40 subjects – same answer if person is scanned again
ICC = 0.986 ICC = 0.985 ICC = 0.990
P. Hibar1, Sarah
Stein JL, Derrek K. Madsen1, Mathew Khamis1, Katie L. McMahon2, Greig Zubicaray3, Narelle
I. de K. Hansell4, Grant W. Montgomery4,
Nicholas G. Martin4, Margaret J. Wright4, Andrew J. Saykin5, Clifford R. Jack, Jr6, Michael W. Weiner7,8, Arthur W. Toga1, Paul M. Thompson1,
and the Alzheimer’s Disease Neuroimaging Initiative* (2011). Discovery and replication of dopamine-related gene effects on caudate volume in
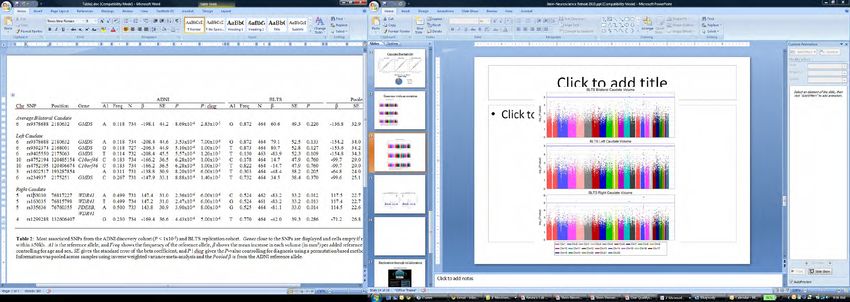
young and elderly populations (N=1198) using genome-wide search, Molecular Psychiatry, 16: 927-937, September 2011.Caudate association peak in PDE8B gene, replicates
in 2nd young cohort (N=1198 people total)
Same Gene implicated
in Autosomal Dominant
-Striatal Degeneration - Very
severe effect on Caudate
volume
-In healthy people, affects
Caudate volume
-Phosphodiesterase = key
protein in the dopamine
signaling cascade
-still not GW-significant in
any one cohort aloneInitial Creation of the ENIGMA Consortium Many sites were collecting MRI and DNA – needed each other for replication
Replication through collaboration
http://ENIGMA.loni.ucla.edu
>200 scientists, 12 countries; must have DNA and MRI scans
Many new members joining, several Working GroupsMeta-Analysis – each site uploads its genome-wide scans - see if any of 500,000+ common genetic variants affect brain volume, brain integrity on DTI, brain amyloid measured with PET - each site’s “vote” depends on how many subjects they assessed
Genetic Imputation – allows ENIGMA
members to compare and combine their data

            Differences in genotyping chips used require
           imputation to the same reference sample
           so each group is studying the same SNPs.
   Imputation is similar to resampling in imaging – put everything on the same grid
                         ENIGMA1 – HapMap reference panel
                ENIGMA2 – “1000 Genomes” (1KG) reference panel;
                    Use imputation protocol on ENIGMA website
Sites had to measure regional brain volumes from MRI
with validated, automated software programs (e.g.,
Freesurfer, FSL; some sites ran both; there was
extensive QC, outliers left in if visually verified)
The correlation between software programs is
comparable to human interrater variability (ICC=0.75-0.95);
important in deciding which structures to prioritize
(Stein, Medland, Vasquez, Hibar, et al., Nature Genetics, 2012)4 Nature Genetics papers (April 15 2012) - largest brain imaging studies in the world
Chromosome 12 variant in HMGA2 boosts brain volume by 9cc, IQ by 1.3 points
HP volume SNP ~ 3 years of aging,
Assoc. with 1.2% decrease in vol per allele
FOREST
PLOT
Hippocampal Volume SNP – equivalent to ~3 years of aging; also HMGA-C
carriers had 9cc bigger brains,
+1.3 IQ points
After Replication: N = 21,151; P = 6.7 x 10⁻¹⁶
(Stein, Medland, Vasquez, Hibar + 207 authors, Nature Genetics, 2012)The hippocampal volume SNP (or the closest
available proxy) was associated
with differences in the expression of a nearby gene,
TESC, in brain tissue
Proxy SNP
UCL Epilepsy SNPExpress
Cohort Database
UK Brain Expression Database
(Stein, Medland, Vasquez, Hibar + 207 authors, Nature Genetics, 2012)Previously Studied Candidate Genes
Previously studied candidate polymorphisms showed little association to
hippocampal volume; Het. P-value – tests for heterogeneity of allele
frequency across cohorts; some cohorts include AD patientsHMGA2 gene, Brain Size, and IQ
rs10784502 ICV Intelligence
• Carriers of the C allele of rs10784502 in the HMGA2 gene had 0.5%
bigger intracranial volume (9 cc, or 2 teaspoons)
• Also had 1.3 points higher full-scale IQ per allele (N=1642;
Beta(SE)=1.29(0.47); P=0.0073).
• This genetic variant is associated with height
• Has a known role in cancer cell proliferation
This result was quite widely reported (New York Times, TIME Magazine; 30
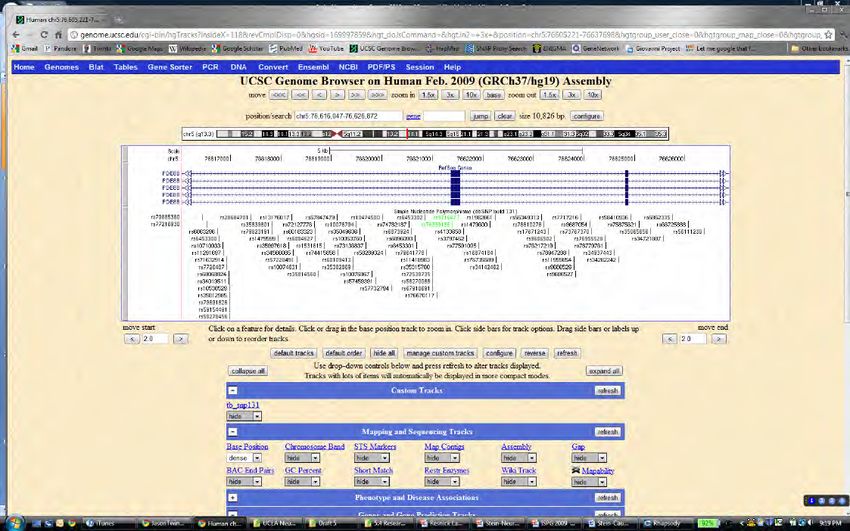
countries worldwide); needs to be replicatedENIGMA-Vis
You can look up any genes or SNPs you
are interested in; see if they associate with brain
measures; psychiatric GWAS and mouse QTL researchers
have had success with it (try it)
Nic Novak
http://enigma.loni.ucla.edu/enigma-vis/ (Novak et al., 2012)ENIGMA Working Groups
Project Name Summary Stage
ENIGMA2 Subcortical Morphometry Image processing and new 1KG
(caudate, amygdala, …) genetic imputation protocols
now completed
ENIGMA-DTI Diffusion Imaging Phenotype harmonization;
Measures – integrity (FA, N=4000+; many cohorts joining;
MD) of tracts, TBSS, Protocol being beta-tested at 6
anatomical connectivity, sites (Kochunov et al., OHBM 2012)
NxN connectomes
ENIGMA-PIB Amyloid PET based Just began – 4 large
measures cohorts with PIB (AIBL in
Australia, U. Pittsburgh,
ADNI, [Wash U]) and
several smaller ones
ENIGMA-PGC How do psychiatric risk 4-pronged approach:
genes affect the brain? reciprocal look-up;
Do “brain genes” affect statistical conjunction;
risk for SCZ, MDD, BPD, enrichment; polygenic
AUT, ADHD, … testingENIGMA + PGC Schizophrenia
Start with simple univariate look-ups,
then move on to polygenic tests, ENIGMA2 structures
Enrichment Test - QQ Plot Conjunction Analysis – very stringent test
Do ENIGMA SNPs that may affect hippocampal Is there evidence that any SNP is associated with
volume (at pYou can search the entire brain and the
genome at the same time:
“Voxelwise” GWAS (Stein 2010)
1. Volume difference at each voxel
relative to a template serves as
phenotype
2. Scan the genome for associations at
each brain location (each voxel)
3. Select only the most associated SNP
at each voxel
4. Adjust P-values through an inverse
beta transformation (max of N null
uniform distributions)
5. Correct for multiple comparisons
across voxels using FDRVoxelwise Genome-Wide Association Study (vGWAS; 719 subjects)
545,871 SNPs x 252,408 voxels = 138 billion tests [10 days to run]
Discovers Most Associated SNP at each Voxel
Discovered XKR4, PIP4K2A, CSMD2, CADPS2, and PIP3-E genes relevant to
brain and cytoskeletal structure; some previously associated with psychiatric disease.
Jason L. Stein1, Xue Hua PhD1, Suh Lee1, April J. Ho1, Alex D. Leow MD PhD1,2, Arthur W. Toga PhD1, Andrew J. Saykin PsyD3, Li Shen PhD3, Tatiana Foroud PhD4, Nathan Pankratz4, Matthew J. Huentelman PhD5, David W. Craig
PhD5, Jill D. Gerber5, April N. Allen5, Jason J. Corneveaux5, Bryan M. DeChairo PhD6, Steven G. Potkin MD7,Clifford R. Jack Jr MD8, Michael W. Weiner MD9,10, Paul M. Thompson PhD1,*, and the ADNI (2009). Voxelwise
Genome-Wide Association Study (vGWAS), NeuroImage 2010.…..but Image-wide GWAS
only tests one voxel at a time,
as if they were totally
independent
Overlooks coherent patterns
of gene action
in the image
Want to Cluster Voxels
with Common Genetic Influences
Boosts the Power of GWAS in Images
(Chiang et al., J Neuroscience 2012)Cluster voxels based on their genetic
correlation 4876x4876 matrix
1. In twin or family designs, we can
estimate the genetic correlation
between any two traits, e.g. brain
size and IQ, i.e., there may be a
correlation between the genetic factors
affecting the 2 traits
2. Apply same logic to pairs of voxels in
an image – is there any genetic
correlation? (cross-twin, cross-trait
method)
3. Rg(x,y) gives very dense network; thin it
down by transforming to Topological
Overlap index network, TO(x,y) (Zhang
& Horvath, 2005; better clusters)
4. Do hierarchical clustering of voxels with
common genetic determination
5. Treat largest clusters as regions of
interest
6. Run GWAS on these new ROIs
7. Much faster; does it also boost power?Genetic clustering boosts GWAS power 1. Many top hits now reach genome-wide significance (N=472) and replicate 2. Several SNPs affect multiple ROIs 3. Can form a network of SNPs that affect similar ROIs 4. It has a small-world, scale-free topology (for more, see Chiang et al., J. Neurosci., 2012)
Genetic correlation between a blood
biomarker and an image
1.   Suppose you have a gene that affects a known blood or CSF biomarker, and
     you want to see if it also affects the brain, and if so, where

HFE gene -> transferrin levels in blood (buffers iron, vital for myelination)
MTHFR gene -> homocysteine levels in blood (causes atrophy)
2. Find the parts of the brain that show genetic correlations with the blood
     measure (voxel-based cross-twin cross-trait association)
3. Test the SNP’s association in just those regions of the brain, to boost power
(for more, see Jahanshad et al., PNAS, 2011; Rajagopalan et al., submitted)
D. Shattuck & P. Thompso
D. Shattuck & P. Thompson
D. Shattuck & P. Thompson
D. Shattuck & P. Thompson
Genome-Wide Screen of the Human Connectome
discovers an Alzheimer risk gene (ENIGMA-DTI)

Discovery sample – Young Adults
                                  Jahanshad/Thompson, under review
Replication sample – ADNI
Autism Risk Gene linked to Differences in Brain Wiring
CNTNAP2-CC Carriers have different networks
Circles show hubs with different eccentricity (a measure of isolation;
N=328 people)
E. Dennis
et al., Brain
Connectivity,
2012Acknowledgments
Jason Stein Derrek Hibar Neda Jahanshad
UCLA UCLA UCLA
Sarah Medland Alejandro Arias Vasquez
Queensland Inst. Med. Radboud University, The
Research, Australia Netherlands
207 co-authors and the 21,151* participants
Funding agencies in U.S., Australia, Europe
*Thanks to CHARGE (S. Seshadri et al.)
207Working Groups:
co-authors
ENIGMA1, ENIGMA2, ENIGMA-DTI,
ENIGMA-PIB, ENIGMA-PGC, …You can also read