Ghana Fertilizer Value Chain Optimization Study
←
→
Page content transcription
If your browser does not render page correctly, please read the page content below
Ghana Fertilizer Value Chain
        Optimization Study

                              Revised August 2019

DISCLAIMER:
This report is made possible by the generous support of the American people through the
United States Agency for International Development (USAID) under the Feed the Future
initiative. The contents are the responsibility of IFDC and do not necessarily reflect the views
of USAID or the United States Government.
Table of Contents
1. BACKGROUND .................................................................................................................... 10

2. OBJECTIVES ....................................................................................................................... 10

3. FERTILIZER TRADE AND CONSUMPTION IN GHANA ........................................................ 10
     3.1 Summary of International and West African Fertilizer Contexts ................................... 10
     3.2 Fertilizer Trade and Consumption in Ghana .................................................................... 14
            3.2.1    Apparent Consumption Increased by 50% from 2013 to 2017 ................................................. 15
            3.2.2    Improvement in Timing of Imports .......................................................................................... 17
            3.2.3    Structure of Fertilizer Distribution in Ghana ............................................................................ 18
     3.3 Fertilizer Consumption per Crop ....................................................................................... 19

4. FERTILIZER PROCUREMENT PROCESSES AND COST BUILDUP IN GHANA ...................... 20
     4.1 Fertilizer Import Procedures .............................................................................................. 20
            4.1.1    Import Clearance Process.......................................................................................................... 20
            4.1.2    Duties and VAT ........................................................................................................................ 21
     4.2 Fertilizer Supply Cost Buildup ........................................................................................... 21
            4.2.1    Costs of Importing Fertilizers through the Port of Tema .......................................................... 21
            4.2.2    Domestic Distribution Costs ..................................................................................................... 26
            4.2.3    Subsidized Fertilizer Cost Estimation ....................................................................................... 29
            4.2.4    Cost of Procuring Subsidized Fertilizer vs. Commercial Distribution ..................................... 31
     4.3 Some Options to Reduce Domestic Costs of Supplying Fertilizers .................................. 33
            4.3.1    Facilitating Delivery of Import Permits .................................................................................... 33
            4.3.2    Improving Port Operations........................................................................................................ 33
            4.3.3    Transport ................................................................................................................................... 33
            4.3.4    Investing in Warehousing Capacities ........................................................................................ 34

5. DEVELOPING THE FERTILIZER (BLENDING) MARKET..................................................... 34
     5.1 Potential Market Demand for Fertilizers........................................................................... 34
     5.2 The Current Blend Market Situation ................................................................................. 35
     5.3 Potential Market Demand for Blends................................................................................. 36
            5.3.1    Potential Market Demand for Different Blends ........................................................................ 36
            5.3.2    Supplying Balanced Fertilizer Based on Ghanaian Soil Characteristics .................................. 37
            5.3.3    Potential and Feasibility for Fertilizer Formulation Shifts ....................................................... 39
            5.3.4    Developing Local Raw Materials to Produce Blends ............................................................... 39
     5.4 Producing Blends in Ghana ................................................................................................. 40
            5.4.1    Current Blending Facilities and Capacities ............................................................................... 40
            5.4.2    Blending Unit Investment, Economic Benefit, and Profitability .............................................. 40
            5.4.3    The Small Blending Plant Option ............................................................................................. 41
            5.4.4    Deploying Additional Blending Units and/or Optimizing Current Blending Capacity? .......... 41
     5.5 Needed Changes to Unlock the Potential of the Blend Market ........................................ 42
            5.5.1    Introducing Blends into the Subsidy Program .......................................................................... 42
            5.5.2    Investing in Education .............................................................................................................. 42

6. FERTILIZER VALUE CHAIN OPTIMIZATION ..................................................................... 43
     6.1 Background of the Ghana Fertilizer Subsidy Program .................................................... 43
            6.1.1    Since 2008: Reintroduction of Fertilizer Subsidy Programs .................................................... 43

Ghana Fertilizer Value Chain Optimization Study                                                                                                                    i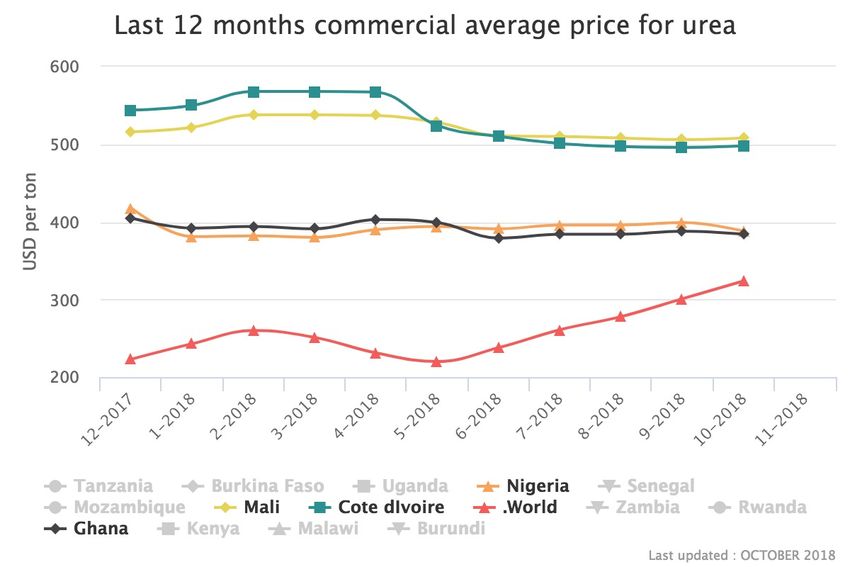
6.1.2      2016: Prioritizing Agriculture ................................................................................................... 43
            6.1.3      2017: Planting for Food and Jobs Program ............................................................................... 43
            6.1.4      2018: Adjusting the Planting for Food and Jobs Program ........................................................ 44
     6.2 The Fertilizer Subsidy Scheme............................................................................................ 45
            6.2.1      Determining Subsidy Allocation ............................................................................................... 45
            6.2.2      Selecting Fertilizer Suppliers .................................................................................................... 45
            6.2.3      Companies Involved in the Subsidy Program ........................................................................... 46
            6.2.4      Distributing Fertilizers to Farmers ............................................................................................ 47
     6.3 Costs of the Program and Prices ......................................................................................... 49
            6.3.1      Funding of the 2018 PFJ and Beyond ....................................................................................... 49
            6.3.2      Pricing, Payment Scheme, and Timelines ................................................................................. 49
     6.4 Preparing for the 2019 Planting for Food and Jobs Campaign ....................................... 52

7. FERTILIZER VALUE CHAIN OPTIMIZATION ..................................................................... 54
     7.1 Key Findings and Challenges in the Fertilizer Value Chain ............................................ 54
            7.1.1      Limited Capacity to Enforce Regulatory and Policy Framework for Product Quality Control 55
            7.1.2      Low Margins Along the Domestic Distribution Channels........................................................ 55
            7.1.3      Weak Distribution Networks Served by Agents With Limited Capacity and Knowledge ....... 56
            7.1.4      Limited Incentives for Private Sector to Invest Beyond Government-Sponsored Programs.... 56
            7.1.5      High Financial Costs and Limited Access to Finance .............................................................. 56
            7.1.6      High Logistic Costs ................................................................................................................... 56
            7.1.7      Lack of Farmer Access to Reliable and Remunerative Markets ............................................... 57
     7.2 Policy Implications and Recommendations (Medium- to Long-Term) ........................... 57
            7.2.1      Toward Smart Subsidies: Policy Reform Approach and Tool to Reform the Current Subsidy
                       Program ..................................................................................................................................... 57
            7.2.2      Promote Inclusive and Fair Participation of Key Business Actors in the Subsidy Program .... 59
            7.2.3      Promoting a More Transparent and Collaborative Environment in the Fertilizer Sector ......... 61
            7.2.4      Enforce Fertilizer Regulatory Framework and Increase Quality Control Capabilities ............. 63
            7.2.5      Properly Target Beneficiaries (Farmers, Zones, and Crops)..................................................... 64
            7.2.6      Invest in Knowledge and Research Capacity in the Fertilizer Sector ....................................... 65
            7.2.7      Offer Financial Incentives by Easing Access to Finance .......................................................... 66
            7.2.8      Reduce Logistics Costs by Investing in Infrastructure ............................................................. 67
            7.2.9      Improve the Business Environment in the Agriculture Sector ................................................. 68
     7.3 Specific Recommendations for the 2019 PFJ Campaign (Short-Term) .......................... 71
            7.3.1      Eight Measures Proposed for the PFJ 2019 Campaign ............................................................. 72
            7.3.2      How MoFA Intends to Implement the Measures? .................................................................... 76
            7.3.3      Preparing for the 2020 PFJ Campaign (Medium-Term) ........................................................... 77

8. ANNEX................................................................................................................................ 78
            Reference Documents/Bibliography ...................................................................................................... 78
            Methodology .......................................................................................................................................... 79
            Essential Agricultural Statistics ............................................................................................................. 81
            Detailed Structure of Fertilizer Distribution in Ghana .......................................................................... 82
            ECOWAS Customs Harmonized System Codes, Tariffs, and Taxes Applicable to Fertilizers ............ 83
            Import Process Flow .............................................................................................................................. 84
            Estimated Fertilizer Use by Crop (1990-1999) ..................................................................................... 86
            Nutrient Removal Factors to Estimate Fertilizer Requirements ............................................................ 87
            2017 Fertilizer Subsidy Model of the Planting for Food and Jobs Program ......................................... 88
            Fertilizer Allocations by Fertilizer Suppliers Under the PFJ Program (2015-2018) ............................. 89
            Packages Provided in 2018 to Farmers per Crop at 50% Subsidy ........................................................ 90
            Key Principles and Proposed Actions to Design Smart Fertilizer Subsidy Programs........................... 91
            List of Companies/Institutions Met/Interviewed ................................................................................... 95

Ghana Fertilizer Value Chain Optimization Study                                                                                                                      ii
Figures
Figure 1. Strong Growth of Major Fertilizer Markets in Sub-Saharan Africa .................. 11
Figure 2. FOB Fertilizer Prices – Increasing Steadily Since Mid-2017 ............................ 12
Figure 3. Retail Fertilizer Prices – Not Yet Impacted by the FOB Price Increase ............ 13
Figure 4. Commercial and Subsidized Urea and NPK 15-15-15 Prices (October 2018) .. 14
Figure 5. Evolution of Apparent Fertilizer Consumption in Selected Countries in West
Africa .................................................................................................................. 15
Figure 6. 2017 Fertilizer Imports in Ghana and Breakdown by Type of NPK ................. 16
Figure 7. Country of Origin of Fertilizers Imported in 2017 and Breakdown by Product
Type .................................................................................................................... 16
Figure 8. Ghana Fertilizer Monthly Cumulative Imports (2013-2017) ............................. 17
Figure 9. Crop Calendar for Food Crops ........................................................................... 18
Figure 10. Illustration of the Fertilizer Distribution in Ghana............................................. 18
Figure 11. Estimated Fertilizer Use by Crop and by Product .............................................. 20
Figure 12. FOT Cost of Importing Urea in Ghana (U.S. $/mt) ........................................... 23
Figure 13. Cost Breakdown of GA Storage Beyond FOB Cost .......................................... 25
Figure 14. Cost Breakdown of Distribution to Retail, Beyond GA Storage ....................... 27
Figure 15. Average Cost of Fertilizer in Ghana Across All Regions (Non-Subsidized
Costs) .................................................................................................................. 29
Figure 16. Average Domestic Distribution Cost of Fertilizer Across All Regions as
Negotiated by MoFA Under the Subsidy Program ............................................ 30
Figure 17. Cost of Procuring Subsidized Fertilizers vs. Commercial Distribution ............. 31
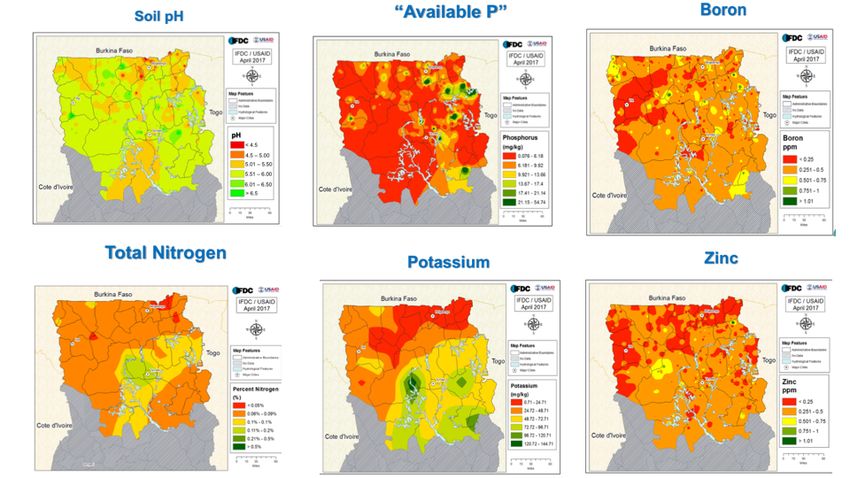
Figure 18. Some Results of the Soil Analysis Conducted by IFDC in Northern Ghana
(2017) ................................................................................................................. 37
Figure 19. 2018 Fertilizer Subsidy Model of the Planting for Food and Jobs Program ...... 45
Figure 20. Fertilizer Subsidy Allocation in Ghana per Company (2015-2018) .................. 47
Figure 21. Sample of Subsidy Coupons .............................................................................. 51
Figure 22. MoFA Announcement for Pre-Qualification of Fertilizer Suppliers for the 2019
PFJ Campaign .................................................................................................... 53
Figure 23. Challenges Faced by Actors in the Fertilizer Value Chain ................................ 54
Figure 24. Fertilizer Subsidy Allocations per Type (2015-2018)........................................ 89
Ghana Fertilizer Value Chain Optimization Study iii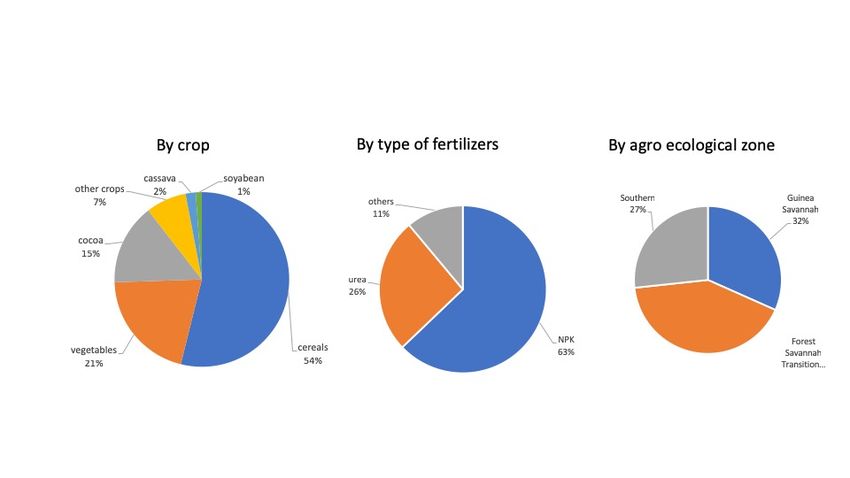
Tables
Table 1.      Apparent Fertilizer Consumption in Ghana 2013-2017 ..................................... 15
Table 2.      Fertilizer Export Trends from 2013-2017 .......................................................... 17
Table 3.      Main Fertilizer Importers in 2017 ...................................................................... 19
Table 4.      Estimated Distribution of Fertilizer Sales by Regions (1997-2001) .................. 19
Table 5.      FOT Cost of Importing Urea in Ghana .............................................................. 22
Table 6.      Procurement and Importation Cost of Fertilizer at Greater Accra Storage ........ 24
Table 7.      Average Domestic Distribution Cost of Fertilizer in Ghana Across All Regions
              ............................................................................................................................ 26
Table 8.      Cost of Fertilizer Delivery at Retail to All Regions in Ghana ........................... 28
Table 9.      Average Domestic Distribution Cost of Fertilizer in Ghana Across All Regions
              as Negotiated by MoFA ..................................................................................... 30
Table 10.     Impact of FOB Price Increases on GA Costs ..................................................... 32
Table 11.     Main Fertilizer Grades Used per Crop in Ghana................................................ 36
Table 12.     Current and Potential Blended Fertilizer Consumption ..................................... 37
Table 13.     New Fertilizer Recommendations for Maize, Rice, Soybean, and Cassava Based
              on Soil Nutrient Maps ........................................................................................ 38
Table 14.     Fertilizer Blending Capacity in Ghana ............................................................... 40
Table 15.     Subsidized Fertilizer Consumption by Region for 2016-2017........................... 47
Table 16.     Target Beneficiaries for PFJ, 2017-2020 ........................................................... 48
Table 17.     Estimated Cost of Planting for Food and Jobs Program, 2017-2020 ................. 49
Table 18.     Projected Fertilizer Requirement for PFJ Program, 2018-2020 ......................... 49
Table 19.     Subsidized vs. Market Prices of Fertilizers from 2008 to 2018 ......................... 50
Table 20.     Expected Results for Policy Scenarios .............................................................. 59
Table 21.     Proposed Recommendations and Smart Subsidy Principles .............................. 70
Table 22.     Eight Measures to Improve the Efficiency of the 2019 PFJ Program ................ 73
Table 23.     Priority Measures Recommended for PFJ 2019 ................................................. 76
Table 24.     Cultivated Areas and Average Yields of Some Major Crops in Ghana
              (2010-2015) ........................................................................................................ 81
Table 25.     Ghana 2017 Fertilizer Statistics Summary ......................................................... 81
Table 26.     ECOWAS Customs HS Codes, Tariffs, and Taxes Applicable to Fertilizers .... 83

Ghana Fertilizer Value Chain Optimization Study                                                                                           iv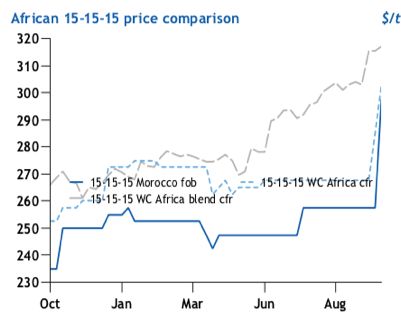
List of Acronyms
 ADB                  Agricultural Development Bank
 AEZ                  Agroecological Zone
 AFAP                 Africa Fertilizer and Agribusiness Partnership
 AFFM                 African Fertilizer Financing Mechanism
 AfSIS                Africa Soil Information Service
 AGR                  Annual Growth Rate
 AGRA                 Alliance for a Green Revolution in Africa
 AGRIS                Agriculture and Rural Integrated Survey
 B                    Boron
 Ca                   Calcium
 CAN                  Calcium Ammonium Nitrate
 CAPEX                Capital Expenditure
 CIF                  Cost, Insurance, and Freight
 COCOBOD              Ghana Cocoa Board

 CSIR                 Council for Scientific and Industrial Research
 DAP                  Diammonium Phosphate
 DCS                  Directorate of Crop Services (MoFA)
 DDA                  District Department of Agriculture
 DSSAT                Decision Support System for Agrotechnology Transfer
 ECOWAS               Economic Community of West African States
 EDIF                 Export Development and Investment Fund
 EnGRAIS              Feed the Future Enhancing Growth through Regional Agricultural
                      Input Systems in West Africa
 FAO                  Food and Agriculture Organization of the United Nations
 FBO                  Farmer-Based Organization
 FOB                  Free on Board
 FOT                  Free on Truck
 FSP                  Fertilizer Subsidy Program
 GA                   Greater Accra
 GAIDA                Ghana Agro-Input Dealers Association
 GCNet                Ghana Community Network
 GCX                  Ghana Commodity Exchange
 GFAC                 Ghana Fertilizer Advisory Committee
 GFEP                 Ghana Fertilizer Expansion Program
 GHS                  Ghana Cedi
 GoG                  Government of Ghana
 GPHA                 Ghana Ports and Harbours Authority
 GRA                  Ghana Revenue Authority

Ghana Fertilizer Value Chain Optimization Study                                        v
GSARS Global Strategy to improve Agricultural and Rural Statistics
GSFP Ghana School Feeding Programme
GSS Ghana Statistical Services
ha hectare
HDP High-Density Poly
ICT Information and Communications Technology
IFA International Fertilizer Association
IFDC International Fertilizer Development Center
IFPRI International Food Policy Research Institute
ISFM Integrated Soil Fertility Management
IT Information Technology
K Potassium
KeFERT Kenya Fertilizer Platform
kg kilogram
MAP Monoammonium Phosphate
METASIP Medium-Term Agriculture Sector Investment Plan
Mg Magnesium
MoFA Ministry of Food and Agriculture
MOP Muriate of Potash
mt metric ton
mtpd metric tons per day
N Nitrogen
NAFCO National Buffer Stock
NAIP National Agriculture Investment Plan
NFP National Fertilizer Platform
NHIL National Health Insurance Levy
NTT National Task Team
OFRA Optimized Fertilizer Recommendations in Africa
P Phosphorus
PFJ Planting for Food and Jobs Presidential Initiative
PFRD Pesticide and Fertilizer Regulatory Division
PPRSD Plant Protection and Regulatory Services Directorate (MoFA)
RDA Regional Department of Agriculture
S Sulfur
SARI Savanna Agricultural Research Institute
SMaRT Soil testing, Mapping, Recommendations development, and Transfer to
farmers
SME Small and Medium Enterprises
SoA Sulfate of Ammonia
SOP Sulfate of Potash
SRI Soil Research Institute (CSIR)
Ghana Fertilizer Value Chain Optimization Study viSRID Statistics Research Information Directorate (MoFA) SSA Sub-Saharan Africa SSP Single Superphosphate TSP Triple Superphosphate USAID United States Agency for International Development VAT Value-Added Tax WAFA West Africa Fertilizer Association Zn Zinc Ghana Fertilizer Value Chain Optimization Study vii
Executive Summary
The following Fertilizer Value Chain Optimization Study was commissioned by the
Government of Ghana (GoG), represented by the Ministry of Food and Agriculture (MoFA)
under the GoG’s Ghana Fertilizer Expansion Programme (GFEP). This study includes
extensive data and a thorough analysis of cost buildups, blending, and subsidies for fertilizer
in Ghana and provides guidance on how these and other aspects of the fertilizer value chain
could be optimized to greatly expand the availability and use of appropriate and affordable
fertilizers across the country, particularly by smallholders for food crops, which is the stated
purpose of the MoFA fertilizer subsidy program (FSP).
However, to analyze and recommend proper changes to the Ghana fertilizer value chain, it is
important to understand the current international and regional fertilizer context. The first
aspect to understand is that, in general, international free-on-board (FOB) prices were rising
(+10-30% year-to-year increase for feedstock, +18% for NPK 15-15-15) at the time of data
collection for this study in September 2018, and 2019 prices were affected. There has been a
boon in the development of manufacturing and blending capacity across sub-Saharan Africa
(SSA), particularly in West Africa. An additional 4.7 million metric tons (mt) or more of
(granular) urea will be available soon from Nigeria; the majority will be exported, primarily
outside the continent. Ghana enjoys competitive open market prices, but has the highest
fertilizer subsidy rate (50%) in West Africa, which has created incentives for smuggling to
neighboring countries, where prices are generally higher and subsidy rates are lower.
In terms of the Ghanaian market, 2017 apparent consumption was estimated at 440,000 mt, a
record high. However, 2017 real consumption was much lower at approximately 350,000-
380,000 mt. Official exports are minimal, but a great deal of anecdotal evidence supports
claims of large-scale smuggling of subsidized fertilizer from Ghana to neighboring countries,
especially Burkina Faso, as well as substantial carryover stocks. Half of imports are NPK
fertilizers, mainly compounds, and 20% are urea and raw materials for blending. The GoG
Planting for Food and Jobs (PFJ) Program/MoFA FSP and the Ghana Cocoa Board
(COCOBOD) control 80% of the fertilizer market to serve smallholder farmers who cultivate
food crops/vegetables and cocoa, respectively. The Ghanaian market is mainly served by 10
private importers, most of them well-skilled and financially capable, who blend and/or
distribute through a dense network of 3,500 small, licensed agro-dealers.
In terms of fertilizer cost buildup and procurement processes in Ghana, almost all fertilizers
are imported through the Port of Tema, where the main importers, largest warehouses, and
most blending units are located. No duties or value-added taxes (VAT) are levied on
fertilizers, except for a 5% duty on compounds. Urea arriving at the Port of Tema at a free-
on-board (FOB) price of U.S. $280/mt reaches Greater Accra (GA) warehouses at U.S.
$395/mt bagged, a port cost of U.S. $115/mt, or +41%. This is comparable to port costs at
Dar es Salaam, Tanzania, and cheaper than those for Mombasa. Domestic distribution costs
add 40-45% to free-on-truck (FOT) costs for imported and locally blended fertilizers.
Financial costs are 38% on average and operational costs are 42%, accounting for 80% of the
cost from Greater Accra storage to retail. Analysis shows that FOB price increases of raw
materials increase competitiveness of local blends over imported compounds. Investing in
general (roads and railways) and dedicated infrastructure (priority berths and warehouses)
and fast-tracking import procedures (permits, etc.) would ensure reduced in-country costs for
fertilizers.

Ghana Fertilizer Value Chain Optimization Study                                               viii
In terms of developing the fertilizer (blending) market, depending on which model is used,
the total fertilizer market potential in the next five years ranges between 500,000 and 760,000
mt, unless the sector is enhanced by major policy and technical improvements. Regardless,
blends are expected to represent 50-60% of the total market. Ongoing GoG efforts, including
accurate soil maps, trials, and validation of fertilizer formulations and recommendations,
have begun yielding results that can lead to the development of more suitable crop- and soil-
specific blends. This is the first step toward fully balanced crop nutrition, which requires the
inclusion of micronutrients. The 2019 PFJ introduced eight new blends for maize, rice,
soybean, and cassava to be mostly blended locally. Six blending units, all located in Tema
except one (GloFert), were expected to be in operation by the beginning of the 2019 planting
season. All can blend new formulations in small or large batches. The current installed
capacity can easily serve the current, short-, and at least medium-term market requirements in
Ghana. If the market moves toward more balanced fertilization requiring more complex crop-
and soil-specific formulations, a couple of additional small blending units, requiring small
investments, could have a comparative advantage if located closer to crop production belts
(e.g., Brong-Ahafo and Northern regions).
However, improvements in fertilizer recommendations and the increase in blended products
will have little impact on smallholder farmers growing food crops, unless there are major
changes to improve the effectiveness of the PFJ/MoFA FSP. As noted above, its 50% subsidy
is by far the highest among neighboring countries, and indications are that many smallholder
farmers are either unable to access or unable or unwilling to pay the remaining cost for
subsidized fertilizer. Problems with the administration of the 2015-2018 FSPs included late
solicitations, contracts, and payments to suppliers and deliveries to farmers, poor
productivity/results from commodity standard formula fertilizers, smuggling, limited and
inefficient/ineffective use of the private sector suppliers, difficult GoG requirements for
accessing subsidized fertilizers, poor accounting/voucher/coupons systems, and fake coupons.
Indications are that some of these problems were reduced in the 2019 FSP, but comprehensive
changes are required if the next FSP is to be more successful.
The following actions are recommended to optimize the fertilizer value chain in Ghana.
Almost half the cost of retail fertilizer prices is derived from high, in-country costs, primarily
due to the lack of priority given to fertilizer imports and poor port and transportation
infrastructure. Reasonable priorities and targeted investments in infrastructure important to
fertilizer importation, blending, and local deliveries would lower retail prices. This could start
with improving capacity at the ports for fertilizer berthing and unloading and improving
roads or rail to warehouses and blending operations. Blending capacity in Ghana is already
more than twice what is required, and current blending operations are operating at only 20-
25% of capacity. Therefore, expansion of blending capacity is not needed and doing so would
inevitably drive current local operations out of business, deterring other blenders and
eliminating current employment for hundreds of Ghanaian workers. The issues with the
current MoFA FSP could be eliminated by modifying it to adhere to the validated Regional
Fertilizer Subsidy Program Guide, which will soon be issued by the Economic Community of
West African States (ECOWAS) as a directive. The Guide is built on 13 key principles,
including inclusive participation, specialization, fair competition, efficiency, better targeting,
transparency, timeliness, appropriate and quality products, incentives, complementary inputs,
exit strategy, sustainability, and accountability, with 36 associated activities. Adhering to
these principles and combining them with the associated activities would make the Ghana
FSP a “smart” program that effectively accomplishes its purpose – improving the availability
and use of fertilizers by smallholder farmers in Ghana to ensure greater productivity and food
security.

Ghana Fertilizer Value Chain Optimization Study                                                 ix
1.      Background
The GoG, represented by MoFA, requested IFDC to complete a Fertilizer Value Chain
Optimization Study under the GFEP. The findings of this study, which includes an update of
the IFDC 2016 Ghana Cost Buildup Study, will help inform the development and
implementation of GFEP by adding key information on a host of elements in the fertilizer value
chain. This will, in turn, help MoFA make better decisions on logistics, procurement, and
pricing under the National Fertilizer Subsidy Program, which was absorbed by the PFJ. Aspects
of this study will also inform the redesign of the subsidy program going forward.

2.      Objectives
The objectives of this study are to:
•    Describe structure and functioning of the current fertilizer market;
•    Assess costs of procuring, blending, and distributing fertilizers to farmers;
•    Define the current potential for market growth for fertilizers in general and for new
     blends or formulations in particular; and
•    Analyze Ghana’s subsidy scheme and offer policy and program changes that will make it
     more effective and efficient.
Methodologies and approaches used to address these objectives and conduct this study are
described in the annex.

3.      Fertilizer Trade and Consumption in Ghana
3.1      Summary of International and West African Fertilizer Contexts
In SSA, the six main fertilizer markets have recorded a steep increase in fertilizer consumption,
reaching close to 6 million mt in 2017, a record increase of 63% in just two years. This
exceptional growth was sustained by: (i) favorable commodity and fertilizer prices in the global
market; (ii) massive private sector investments in fertilizer production (especially urea
production in Nigeria); installation and refurbishment of blending plants (over 50 blending
units are now operational); extension/outreach programs for smallholder farmers; and
(iii) unprecedented government plans and programs aimed at supplying balanced fertilizers to
more smallholder farmers through more targeted subsidized/public programs (Ethiopia is on
the forefront of this new strategy).
According to the International Fertilizer Association (IFA), the average fertilizer application
rate in SSA is up by an average of 1 kilogram (kg) of nutrient per hectare (ha) per year and will
reach 20 kg/ha by 2021. This translates into 32% relative regional growth, making SSA the
fastest-growing market in the world. Area planted has expanded as well but at a slower pace
than fertilizer application rates. However, SSA represents only 2% of the world demand, with
Ethiopia, South Africa, Nigeria, and Kenya accounting for 50% of the total.

Ghana Fertilizer Value Chain Optimization Study                                               10
7,000,000
Total consumption (tons)
6,000,000
5,000,000
6 countries
3,472,718 in West
4,000,000
Africa
2,521,833
3,000,000
1,781,555
6 countries
2,000,000 in East
> 800
Africa
2,490,583
1,000,000 1,884,459 1,974,329 200,
- < 20
2015 2016 2017
on (tons)
6 countries
18
in West
Africa
6 countries
in East > 800,000 MT
Africa
83
200,000-450,000 MT
< 200,000 MT
Figure 1. Strong Growth of Major Fertilizer Markets in Sub-Saharan Africa
Ghana Fertilizer Value Chain Optimization Study 11This impressive picture has been clouded by a sharp increase in the price of most fertilizer
products since the second half of 2018 (urea +17%; diammonium phosphate [DAP] +30%;
TSP +15%; and MOP +10% over the past 12 months), which continues well into 2019.
1400
US$ / ton
Urea (granular, Middle East - FOB bulk)
1200
DAP (Russia Baltic/Black Sea)
MOP (Israe l - FOB bulk)
1000
800
600
400
200
0
Jan-05
Jul-05
Jan-06
Jul-06
Jan-07
Jul-07
Jan-08
Jul-08
Jan-09
Jul-09
Jan-10
Jul-10
Jan-11
Jul-11
Jan-12
Jul-12
Jan-13
Jul-13
Jan-14
Jul-14
Jan-15
Jul-15
Jan-16
Jul-16
Jan-17
Jul-17
Jan-18
Jul-18
dle East - FOB bulk)
/Black Sea)
bulk)
Jan-15
Jul-15
Jan-16
Jul-16
Jan-17
Jul-17
Jan-18
Jul-18
Source: Argus
Figure 2. FOB Fertilizer Prices – Increasing Steadily Since Mid-2017
Although this price increase was not reflected in 2018 retail prices in West Africa, it eventually
will have a significant impact on fertilizer costs and prices, whether fertilizers are used directly
or as feedstock to produce blends locally.
Ghana Fertilizer Value Chain Optimization Study 12Source: AfricaFertilizer.org Figure 3. Retail Fertilizer Prices – Not Yet Impacted by the FOB Price Increase Finally, Ghana has implemented one of the many FSPs in West Africa (Nigeria, Togo, Burkina Faso, Senegal, Niger, Mali, etc.), with the highest subsidy rate (50%). Consequently, the program offers farmers the cheapest urea and NPK 15-15-15 in the region, although rent- seekers and smugglers see an opportunity to supply neighboring countries. Ghana Fertilizer Value Chain Optimization Study 13
Source: AfricaFertilizer.org
Figure 4.    Commercial and Subsidized Urea and NPK 15-15-15 Prices
             (October 2018)

3.2     Fertilizer Trade and Consumption in Ghana
Over the 2015-2017 period, fertilizer consumption substantially increased in most of the main
fertilizer markets in West Africa, driven by three main factors: (i) favorable international
commodity and fertilizer prices; (ii) government interventions, including subsidy programs;
and (iii) private sector investments in production, distribution, and marketing of fertilizers.
Although fertilizer imports and use in Ghana have increased substantially since the global oil
and food crisis of 2008, its market is considerably smaller than some other countries in the
region, including Nigeria and Mali.

Ghana Fertilizer Value Chain Optimization Study                                             14
1,800,000
1,600,000
2015 2016 2017
1,400,000
1,200,000
1,000,000
800,000
600,000
400,000
200,000
0
Nigeria Mali Ghana Cote d'Ivoire Burkina Faso Senegal
Source: AfricaFertilizer.org, 2018
Figure 5. Evolution of Apparent Fertilizer Consumption in Selected Countries
in West Africa
Most fertilizer importation in Ghana is in response to government FSP requirements (MoFA
for food crops and COCOBOD for cocoa), commercial plantations, and other private farmers.
The reintroduction of government subsidies on fertilizer in 2008 has resulted in at least a
perceived corresponding increase in fertilizer use in Ghana. According to MoFA statistics, the
estimated average annual fertilizer demand in Ghana was previously between 250,000 and
350,000 mt per year. Subsidized fertilizer sponsored by MoFA in support of the food crops
sector has recently absorbed a larger proportion of imported fertilizer; this is attributed to the
simultaneous implementation of two FSPs since 2017: the ongoing MoFA FSP and the subsidy
on fertilizer under the PFJ Presidential Initiative. However, these general figures do not factor
in large quantities of subsidized fertilizer smuggled to mostly contiguous countries.
3.2.1 Apparent Consumption Increased by 50% from 2013 to 2017
According to AfricaFertilizer.org, mainly based on Ghana Statistical Services (GSS) and
customs data,1 apparent consumption2 of fertilizers in Ghana increased from 239,900 mt in
2016 to 440,700 mt in 2017, or about 84% within one year.
Table 1. Apparent Fertilizer Consumption in Ghana 2013-2017
2013 2014 2015 2016 2017
Fertilizer (mt)
NPK 113,812 39,344 137,902 132,632 210,387
Urea 36,104 – 18,253 39,035 88,259
Ammonium sulfate 54,863 6,282 64,015 23,268 43,865
Organic fertilizers 6,465 5,523 7,818 8,747 37,568
TSP 47,173 19,613 32,052 13,802 26,766
MOP 19,801 22,702 18,707 13,842 24,235
Other fertilizers 16,287 10,223 11,077 8,532 9,582
Total 294,505 103,688 289,822 239,858 440,661
Source: AfricaFertilizer.org, 2018.
1
See https://africafertilizer.org/blog-post/2017-fertilizer-statistics-validation-workshop-report-ghana-nigeria/.
2
Apparent consumption = local production + imports – exports – non-fertilizer uses (mainly mining and chemical
industries).
Ghana Fertilizer Value Chain Optimization Study 15Of the 2017 apparent consumption, 48% were NPK products (mainly compounds), 20% urea,
10% ammonium sulfate, 6% TSP, and 5% MOP, according to AfricaFertilizer.org. The
remaining 11% were other fertilizer products used in blending, including organic fertilizer
products.
Other
fertilizers Other
MOP
2% NPK NPKs
5% NPK 15-15-15
TSP 48% 18%
6% 32%
NPK 21-5-5
Organic 7%
fertilizers
9%
Ammonium
sulphate
10%
NPK 27-6-6
10% NPK 23-10-5 + 3S +
Urea 2MgO + 0.3Zn
NPK 20-10-10
20% 19%
14%
Source: AfricaFertilizer.org, 2018
Figure 6. 2017 Fertilizer Imports in Ghana and Breakdown by Type of NPK
Ten countries accounted for 85% of the fertilizer imported into Ghana in 2017. Morocco is
the most important supplier of fertilizers to Ghana, accounting for 17% of the total supply,
100% of TSP, and 22% of the NPKs imported.
Finland Morocco
80,000 100%
90%
70,000
80%
Others
60,000 70%
Estonia
China
Latvia
60%
50,000
Italy
Latvia
Italy
50%
Belgium
40,000 40% China
Libya
30%
Turkey
Estonia
Germany
30,000
20%
Finland
20,000 10%
0% Morocco
10,000
ea
c
rs
P
OP
K
Or oA
ni
TS
NP
he
mt
Ur
S
ga
M
-
Ot
Figure 7. Country of Origin of Fertilizers Imported in 2017 and Breakdown by
Product Type
According to official statistics, only 3,575 mt of fertilizers were officially exported from Ghana
to neighboring countries, mainly Burkina Faso and Togo.
Ghana Fertilizer Value Chain Optimization Study 16Table 2. Fertilizer Export Trends from 2013-2017
2013 2014 2015 2016 2017
Fertilizer (mt)
NPK 3,235 5,536 238 – 3,500
Urea – 339 95 – –
TSP – 1,645 – – –
Other fertilizers 248 – – 25 75
Total 3,483 7,520 333 25 3,575
Source: AfricaFertilizer.org, 2018.
3.2.2 Improvement in Timing of Imports
Most fertilizers imported to Ghana reach the port between the first and third quarters. Fertilizers
imported in the last quarter are mostly used in the following year.
In 2017, 87% of the total quantity of fertilizers was imported into Ghana by the end of the
second quarter, i.e., in time for the main planting season (see crop calendar below), with a peak
in June of over 129,000 mt imported (vs. 81% in 2016, 57% in 2015, 60% in 2014, and 55%
in 2013).
500,000
450,000
400,000
350,000 2013
300,000
2014
250,000
2015
200,000
2016
150,000
2017
100,000
50,000
-
mt Jan Feb Mar Apr May Jun Jul Aug Sep Oct Nov Dec
Figure 8. Ghana Fertilizer Monthly Cumulative Imports (2013-2017)
Ghana Fertilizer Value Chain Optimization Study 17SEASON CROPS Jan Feb Mar Apr May Jun Jul Aug Sep Oct Nov Dec
Cassava(1st year) u u u
Cassava(2nd year)
Maize(North main*) u u u
Major Season Maize(South main*) u u u
(Long Rains) Sorghum & Millet u u u u
Rice(North) u u u u
Rice(South) u u u
Yams u u u u
Minor Season Cassava, Maize, Millet,
u u u
(Short Rains) Sorghum, Rice, Yams
Source: IFDC, adapted from FAO/GIEWS Key: u Fertilizer Peak Demand Sowing Growing Harvesting
Figure 9. Crop Calendar for Food Crops
3.2.3 Structure of Fertilizer Distribution in Ghana
Figure 10 illustrates the flow of fertilizer from importers to farmers. This structure is partially
influenced by the setup that resulted from the private-public partnerships for both of the
government subsidy programs.
International Fertilizer Suppliers
Importers (with blending units )
Yara Chemico AMG AFCOT OmniFert MacroFertil Others
19% 19% 17% 11% 7% 6% 11%
20% 10% 60%
10%
COCOBOD Agribusinesses MoFA Subsidy Program
(cocoa) (fruits, rubber, oil palm) + PFJ (food crops)
Distributors/
Outlets
Licensed
Agro-Dealers
Retailers
Out-Growers/Small-Scale Farmers Small-Scale Farmers
Cocoa Farmers
(maize, cotton, oil palm, rubber, sugar) (food crops, vegetables)
Figure 10. Illustration of the Fertilizer Distribution in Ghana
In 2017, 10 importers accounted for almost all of the fertilizers imported into Ghana (98%),
supplying 35 to 50 large distributors and a dense network of more than 3,500 retail shops
Ghana Fertilizer Value Chain Optimization Study 18across the country. A more detailed description of the various players in the supply chain can
be found in the annex.
Table 3. Main Fertilizer Importers in 2017
Volume
Importers Main Types of Fertilizers (mt) %
Chemico SoA, DAP, MOP, NPK, SOP, TSP, urea 84,219 19%
Yara Ghana SoA, CAN, MAP, MOP, NPK, P rock, SOP, TSP, urea 84,195 19%
AMG SoA, NPK 74,313 17%
Afcott SoA, NPK, urea 48,844 11%
Ghana COCOBOD SoA, NPK, organic fertilizers 45,126 10%
Omnifert SoA, DAP, MAP, MOP, SOP, urea 32,190 7%
Macrofertil SoA, CAN, MAP, MOP, NPK, P nitrate, SOP, urea 24,838 6%
Agricult Ghana NPK, organic fertilizers, urea 20,130 5%
RMG NPK, urea 16,671 4%
ETC Agro Urea 2,935 1%
Jubaili Agrotec MOP 2,896 1%
Other 7,878 2%
Total 444,236 100%
Source: AfricaFertilizer.org, 2018.
3.3 Fertilizer Consumption per Crop
The lack of detailed data from official sources, such as GSS or the Statistics Research
Information Directorate (SRID), and the lack of sales records at the retail level make it very
difficult to assess the actual fertilizer use by crop and by product at the national level.
As a reference, the Food and Agriculture Organization of the United Nations (FAO) published
a report3 in 2005 on fertilizer use by crop in Ghana. The report was prepared in collaboration
with the Land and Plant Nutrition Management Service’s Land and Water Development
Division. Table 4 provides estimates of fertilizer use by region in the late 1990s, which can be
used as an indication of today’s geographical distribution.
Table 4. Estimated Distribution of Fertilizer Sales by Regions (1997-2001)
1997 1998 1999 2000 2001
Region (mt)
Ashanti 5,167 3,893 2,023 4,046 7,438
Brong-Ahafo 7,582 5,712 2,969 5,937 10,914
Central 1,629 1,229 638 1,275 2,345
Eastern 1,011 762 396 792 1,455
Greater Accra 1,236 931 484 967 1,779
Northern 15,220 11,467 5,960 11,917 21,910
Upper Regions 15,501 11,679 6,070 12,137 22,314
Volta 8,481 6,390 3,321 6,640 12,208
Western 337 254 132 264 483
Total 56,164 42,317 16,593 43,975 80,846
In 2014, IFDC commissioned a study with SRID, GSS, and the Ghana Agro-Input Dealers’
Association (GAIDA) to reassess fertilizer consumption and fertilizer use by crop in Ghana,
3
See http://www.fao.org/tempref/agl/agll/docs/fertuseghana.pdf.
Ghana Fertilizer Value Chain Optimization Study 19but the team could not accomplish this objective due to the unavailability of reliable data. Key
recommendations from the study included the addition of fertilizers to the Multi-Round Annual
Crop and Livestock Surveys conducted by SRID and investment in financial and human
resources by MoFA in SRID and in District Agricultural and Extension Offices.
In the absence of detailed data, the team used available fertilizer consumption statistics,
allocated by product and region by the MoFA subsidy programs, and sales estimates for other
crop segments (cocoa, agribusiness) to estimate the current fertilizer use by crop as shown in
Figure 11.
Figure 11. Estimated Fertilizer Use by Crop and by Product
The pilot Agriculture and Rural Integrated Survey (AGRIS) in Ghana was launched in January
2018 as part of the FAO Global Strategy to improve Agricultural and Rural Statistics (GSARS).
The pilot was conducted in four selected districts of the Ashanti Region in Ghana, in
collaboration with GSS and MoFA. If and when the pilot is extended to the entire country, it
should provide accurate and reliable data needed to estimate fertilizer use by crop. Meanwhile,
IFDC recommends that a standalone study on fertilizer use by crop be conducted as soon as
possible, ahead of the 2020 planting season (ideally before September 2019).
4. Fertilizer Procurement Processes and Cost Buildup in
Ghana
4.1 Fertilizer Import Procedures
4.1.1 Import Clearance Process
Customs Act 2015, Act 891, Section 43 directs all importers, except “Self-Declarants,” to
engage the services of licensed Customs House Agents (freight forwarders) for the clearance
of cargo at any freight station in Ghana.
The importation clearance process4 comprises the following:
• Declaration of cargo onto the Ghana Community Network (GCNet);5
• Customs document verification, system validation, cargo classification and valuation, risk
assessment and quality assurance, payment of duty, and cargo verification;
4
See https://www.ghanaports.gov.gh/page/25/Port-Processes.
5
GCNet: https://giccs.gcnetghana.com/giccs/jsf/login/GICCSLoginpage.jsf.
Ghana Fertilizer Value Chain Optimization Study 20• Release of cargo by the shipping agent;
o Delivery by the port and other receipt delivery service providers; and
o Customs physical examination or scanning of cargo before it can exit the port.
A detailed port clearance flow/roadmap is available online.6 The process follows existing GoG
and port authority rules and regulations. The annex provides more details on the import
processes.
4.1.2 Duties and VAT
Although most imported fertilizer does not incur VAT, it does incur other levies. Single
nutrient products, such as urea, TSP, and MOP, typically used for blended formulations
demanded for certain crops and climatic conditions (e.g., blended fertilizer formula for the
cocoa sector), do not incur VAT or import duties. However, NPK compound products, such as
NPK 15-15-15, incur an import duty of 5%.
4.2 Fertilizer Supply Cost Buildup
This section presents the fertilizer supply cost buildup in Ghana, based largely on data and
information gathered during field work in the country. Tables 5 and 6 and Figures 12 and 13
present the fertilizer supply cost buildup estimations from procurement to storage facilities
within the Tema and Greater Accra areas for six fertilizer products:
1. Urea;
2. TSP;
3. MOP;
4. NPK compounds (NPK 15-15-15); and
5. NPK blended formulations (NPK 15-15-15 and NPK 23-10-5).
The reason for differentiating NPK products as formulations and blended products is to
compare the costs of imported compound formulations versus the same blended formulations
manufactured from imported straight nutrient products.
4.2.1 Costs of Importing Fertilizers through the Port of Tema
Although Ghana has two ports (Tema and Takoradi) with good connections to the road network
and other logistics, the vast majority of fertilizer is imported through Tema. Table 5 illustrates
the cost of urea importation, FOT at port (Tema). Considering that fertilizer importation
experiences economies of scale, import estimations per metric ton are based on a 15,000-mt
vessel and four-month average international market FOB prices and international freight,
according to Argus Media, assuming the nearest source for procuring the products in relation
to Ghana.
6
See https://www.ghanaports.gov.gh/Files/TEMAPORT/PaperlessRoadMap.pdf.
Ghana Fertilizer Value Chain Optimization Study 21Table 5. FOT Cost of Importing Urea in Ghana
Importer Costs and Charges U.S. $/mt GHS/mt FOT Bulk FOT Bagged
A FOB 279.40 1,341.10 74.8% 70.5%
1 Vessel freight 24.00 115.20
2 Freight insurance 1.70 8.00
B Cost, insurance, and freight (CIF) 305.10 1,464.30 81.7% 77.0%
3 Import duty – –
4 Value-added tax (VAT) – –
5 Customs processing fee 3.10 14.60
6 NHIL 7.60 36.60
7 EDIF 1.50 7.30
8 ECOWAS levy 1.50 7.30
9 GCNet 1.30 6.30
10 EXIM levy 2.30 11.00
11 African Union levy 0.60 2.90
12 IRS charges – –
13 Inspection fee (PPRSD) 3.10 14.60
C Total taxes, tariffs, and levies 21.00 100.80 5.6% 5.3%
14 Port dues per vessel 1.20 5.90
15 Plant quarantine 0.10 0.50
16 Stevedoring 34.00 163.20
17 Port dues per mt 4.00 19.20
D Total port charges 39.30 188.70 10.5% 9.9%
18 Shipping admin and handling charges 1.00 1.00
E Shipping charges 1.00 1.00 0.1% 0.1%
19 Documentation 0.10 0.50
20 Forwarder admin charges 1.00 4.80
21 Forwarder clearing charges 3.50 16.80
22 Other contingencies 0.50 2.20
F Total forwarder charges 5.10 23.80 1.3% 1.3%
G FOT cost Tema in bulk 371.40 1,793.30 100.0% 94.2%
23 Bagging operations per mt 12.00 57.60
24 Poly-sacks 10.80 51.80
H Bagging charges 22.80 109.40 5.8%
I Total FOT bagged at port 394.20 1,902.70 100.0%
Note: GHS to U.S. $ assumed exchange rate is GHS 4.8/U.S. $, three-month average, up to September 2018.
Ghana Fertilizer Value Chain Optimization Study 22Table Notes
A FOB price is a four-month (June through September 2018) average international bulk price of urea,
at Baltic/Morocco/Black Sea in U.S. $/mt (Argus).
1 International freight was estimated based on Argus freight reports for the months of September 2018
between Baltic/Morocco/Black Sea-Tema in U.S. $/mt for a vessel between 15,000 to 30,000 mt.
2 Freight insurance is estimated at 0.6% of FOB value of the good plus shipping charges, according
to: http://www.priorityworldwide.com/resources/cargo_insurance_guidelines.aspx.
3-4 There is no import duty or VAT for single nutrient products, such as urea.
5 Customs processing fee.
6 National Health Insurance Levy (NHIL) is imposed on all imports at a rate of 2.5% of CIF.
7 Export Development and Investment Fund (EDIF) is a levy charged to all imports at a rate of 0.5%
of CIF.
8 The ECOWAS levy charge is imposed on all imports at a rate of 0.5% of CIF.
9 GCNet Services Limited is a duty on imports at a rate of 0.4% of FOB, to support a public-private
partnership investment in electronic infrastructure and development of an electronic “one-stop
shop/single window” to facilitate trade. This tax includes 15% VAT + 2.5% NHIL on the GCNet
0.4% of FOB for a GCNet effective tax rate of 0.47%.
10 EXIM levy is at a rate of 0.75% of CIF.
11 African Union levy is imposed at 0.2% of CIF.
12 Inspection fee charges are 1% of CIF.
14 Port charge per vessel is a flat charge of U.S. $6,103/vessel (estimated), which includes berth
occupancy, pilotage charges, towage, and mooring/unmooring.
15 Quarantine is another fixed charge based on product weight at a rate of 1% of CIF.
14 Stevedoring charges are labor charges estimated at $34/mt for unloading the vessel, according to the
Tema Port Customers Guide. This includes crane operation for dry bulk cargo, cargo handling, bulk
in-bag out (BIBO) operation, documentation, and shore handling.
16 Port charges per metric ton are estimated at $4/mt, according to the Tema Port Customers Guide.
18-22 Freight forwarder charges are self-descriptive.
23-24 Bagging operation at port is estimated considering equipment rental and poly-sacks only.
72% 7% 5% 10% 2% 6%
0 50 100 150 200 250 300 350 400 450
U.S. $/mt
FOB (bulk) CIF
Total taxes, tariffs and levies Total port charges
Total shipping and forwarding charges Bagging charges
Figure 12. FOT Cost of Importing Urea in Ghana (U.S. $/mt)
The cost increase for NPK compound fertilizer formulations (15-15-15 compound in this case)
relative to CIF is higher than for single nutrient fertilizers, considering that it has a 5% import
duty on CIF, increasing the cost by U.S. $99.80 FOT-Tema relative to CIF (or between
U.S. $10 and $14 relative to single nutrient products). Blended NPK 15-15-15 has a higher cost
Ghana Fertilizer Value Chain Optimization Study 23since it is the result of blending imported single nutrient products and has the added cost of
blending. Table 6 shows the cost of procurement and importation of various fertilizer products
placed at a Greater Accra (GA) warehouse.
Table 6. Procurement and Importation Cost of Fertilizer at Greater Accra
Storage
NPK NPK NPK
15-15-15 15-15-15 23-10-5
Urea TSP MOP Kieserite Compound Blend Blend
Cost Items (U.S. $/mt)
A FOB 279.40 342.60 275.90 70.00 263.90 280.60 252.40
1 Vessel freight 24.00 21.00 28.00 21.00 36.00 23.70 23.10
2 Freight insurance 1.70 2.10 1.70 0.40 1.60 1.70 1.50
B CIF 305.10 365.70 305.60 91.40 301.50 306.00 277.00
3 Taxes, tariffs, and levies 17.90 21.50 17.90 5.30 32.70 18.00 16.30
4 Port charges per mt (Tema) 39.30 39.30 39.30 39.30 39.30 39.30 39.30
5 Forwarder/clearing charges 5.10 5.10 5.10 5.10 5.10 5.10 5.10
6 Shipping charges 1.00 1.00 1.00 1.00 1.00 1.00 1.00
7 Customs inspection and 3.10 3.70 3.10 0.90 3.00 3.10 2.80
processing fees
8 Blending 12.00 12.00
9 Bagging/bags 22.80 22.80 22.80 22.80
10 Transport charges to local 7.90 7.90 7.90 7.90 7.90 7.90 7.90
warehouse (GA)
11 Storage cost in the GA region 25.50 25.50 25.50 25.50 25.50 25.50 25.50
(3 months)
12 Importer financial/operational 61.70 68.40 58.80 24.80 63.10 59.90 55.80
cost of capital
13 Other importation cost 14.30 15.70 13.50 5.90 14.60 14.70 13.70
C Total cost U.S. $/mt at 503.60 553.70 477.70 207.10 516.50 515.20 479.10
Greater Accra (GA) storage
Cost per 50-kg bag in U.S. $ 25.20 25.80 25.80 24.00
Cost per 50-kg bag in GHS 120.90 124.00 123.70 115.00
Table Notes
Descriptions of rows 1 through 8 are the same as in Table 1.
9 Blending cost is estimated at U.S. $12/mt, according to interviewed importers and blenders.
10 Bags and bagging charges assume the operation takes place at port and include bagging equipment,
bags, and liner. NPK compound formulation is assumed to be procured already bagged, therefore having
no bagging charges, while NPK 15-15-15 is blended and bagged at a blending facility.
11 Transport charges are for moving the cargo within the GA area from port to importer main storage and
include loading and unloading.
12 Cost of storage/mt in the GA area is estimated at U.S. $8.5/mt/month, according to survey, for up to
three months.
13 Importers’ financial cost of capital is the annualized interest rate/opportunity cost of 24% (average of
22% to 25% range) on loan for up to six months/mt and includes 4% charges on Letter of Credit.
14 Other importer costs include importer operational cost, assumed to be 10% of procurement and
importation of fertilizer, for four months.
NPK blends are blended formulations based on the imported single nutrient fertilizer (urea, TSP, and MOP).
Fertilizer procurement and importation at the GA region storage increases by 35%, on average,
relative to the FOT-Tema cost, or an overall average cost increase of 65% relative to CIF across
all products considered in the analysis. The 35% cost increase is absorbed by the storage cost
in the GA region and by the financial cost of capital for procuring and importing fertilizer
Ghana Fertilizer Value Chain Optimization Study 24placed at the GA region storage, contributing 13.4 and 13.3%, respectively, to the 35% cost
increase, with the 8.3% difference covering importer operational cost and local transportation
within the GA region. Figure 13 is a graphical representation of the cost of fertilizer delivered
at the GA storage, beyond FOB cost.
NPK 23-10-5 Blend 25% 9% 24% 17% 11% 14%
NPK 15-15-15 Blend 26% 9% 23%% 17% 11% 14%
NPK 15-15-15 Compound 27% 16% 9% 17% 11% 20%
MOP 29% 11% 9% 19% 13% 19%
TSP 32% 12% 10% 19% 12% 15%
Urea 28% 10% 19% 18% 11% 15%
U.S. $/mt 0 50 100 150 200 250
Financial cost Taxes and tariffs Operational costs
Port charges Storage cost Transportation costs
Figure 13. Cost Breakdown of GA Storage Beyond FOB Cost
Figure Notes
Port charges include port charges at destination port (Tema in this case) according to the port charges
schedule, bagging, and forwarder/inspection charges.
Transportation costs are the charges for moving/transporting the products from country of origin to retail
point, including international freight, freight insurance, domestic transport among different stages along the
supply chain, and truck loading/unloading.
Taxes and tariffs include official tariffs, taxes, and levies from procurement to retail.
Financial costs are the cumulative costs of working capital, including other financial charges or opportunity
costs of capital for importation, procurement, distribution, and retail.
Operational costs are known costs associated with the operation of supplying fertilizer, from procurement
and importation to retail.
According to results of the survey, cost of storage/mt in the GA area is estimated at U.S. $8.5/mt/month, for
up to three months.
Ghana Fertilizer Value Chain Optimization Study 25You can also read