Global Ecology and Conservation
←
→
Page content transcription
If your browser does not render page correctly, please read the page content below
Global Ecology and Conservation 34 (2022) e02037
Contents lists available at ScienceDirect
Global Ecology and Conservation
journal homepage: www.elsevier.com/locate/gecco
Population estimation and livestock loss by spotted hyena (Crocuta
crocuta) in Damota community managed forest, Southern Ethiopia
Yigrem Deneke a, Aberham Megaze a, *, Wondimagegnheu Tekalegn b,
Taye Dobamo a, Herwig Leirs b
a
Wolaita Sodo University, College of Natural Sciences, Department of Biology, P.O. box 138, Wolaita Sodo, Ethiopia
b
University of Antwerp, College of Natural Sciences, Department of Biology, Evolutionary Ecology Group, Campus Drie Eiken Universiteitsplein 1B,
2610 Wilrijk, Belgium
A R T I C L E I N F O A B S T R A C T
Keywords: The spotted hyena is positioned at the top of food chains and has the ability to influence the
Damota diversity of herbivores. Knowledge of this predator through research can assist in effective
Density management decisions which will ensure ecosystem integrity. A study on population estimation
Livestock loss
and livestock loss by the spotted hyenas was conducted from January 2019 to December 2020 in
Population estimate
Spotted hyena
the Damota community managed forests. Data was collected through distance sampling tech
niques, and the economic impacts of spotted hyena predation on livestock were quantified using a
questionnaire survey with randomly selected households. Twenty-five transects were monitored
over a period of two consecutive years. A mean of 113 ± 0.51 individuals of spotted hyena was
observed per 100 km2. The density of spotted hyena was 1.34 ± 0.42 and 0.69 ± 0.12 in
dividuals/km2 and 0.55 ± 0.97 and 0.75 ± 0.14 individuals/km2 in farm and forest during 2019
and 2020, respectively. The mean sex ratio of the adult male to adult female was 0.56:1.00 and
0.74:1.00 during the dry and wet seasons, respectively. Moreover, the mean sex ratio of adult to
cub was 1:0.25 and 1:0.29 during the dry and wet seasons, respectively. Respondents indicated a
total loss of 377 livestock due to the depredation of spotted hyenas over the past five years. The
total estimated economic loss caused by depredation, theft, and diseases was US$ 47,885. On
average, US$ 9577 per year (US$ 26 per day) has been lost over the past five years. The average
annual depredation per household was 0.98 head of livestock worth US$ 95.6. Among depredated
livestock, 64.8% of sheep were lost by spotted hyena, followed by donkey (16.4%). Therefore,
livestock management practices, assessment of spotted hyena population, and economic loss are
very important for carnivore conservation and scaling up human livelihood development.
1. Introduction
There are four living species in the family Hyaenidae, which include the aardwolf (Proteles cristata), the striped hyena (Hyena
hyena), the brown hyena (Parahyaena brunnea), and the spotted hyena (Crocuta crocuta). These animals are primarily nocturnal, and all
have hind legs somewhat shorter than their forelegs, giving their body profiles a sloping appearance (Heather et al., 2007). Spotted
hyenas are the least concern on the IUCN Global Red List of Threatened Species because these animals remain widespread in Africa
* Corresponding author.
E-mail addresses: yigremk@gmail.com (Y. Deneke), abme749@yahoo.com (A. Megaze).
https://doi.org/10.1016/j.gecco.2022.e02037
Received 12 November 2021; Received in revised form 24 January 2022; Accepted 24 January 2022
Available online 28 January 2022
2351-9894/© 2022 Published by Elsevier B.V. This is an open access article under the CC BY-NC-ND license
(http://creativecommons.org/licenses/by-nc-nd/4.0/).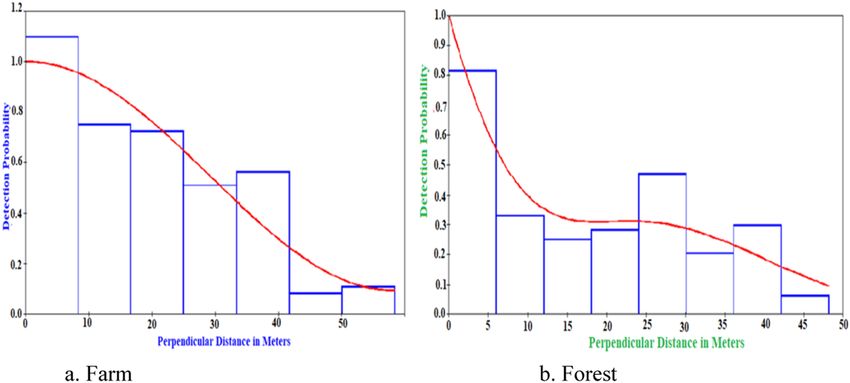
Y. Deneke et al. Global Ecology and Conservation 34 (2022) e02037
(Honer et al., 2008). Spotted hyena inhabits a wide historical range with a relatively stable population, and this shows that spotted
hyena has high behavioral and ecological plasticity (Kolowski and Holekamp, 2009). Spotted hyenas are large (45–80 kg), gregarious
carnivores throughout sub-Saharan Africa except for true deserts and alpine areas above 3000 m (Frank et al., 1995; Mills, 1990; Mills
and Harvey, 2001). Their large range may be due to the hyena’s versatile prey choice, as its food varies across ecosystems (Mills and
Hofer, 1998). In Central Africa, The spotted hyena has mainly been reported to inhabit savannahs, although spotted hyenas have been
reported in Odzala National Park, Congo (IUCN, 2008; Mills and Hofer, 1998). In addition, they are widely distributed in eastern,
southern, and western Africa (Mills and Hofer, 1998).
Spotted hyenas have the most complex social structure of all large carnivores. They live in clans containing 6–90 individuals
(Holekamp et al., 2000, 1997, 2012; Smith and Holekamp, 2010). The mean clan size across Africa is approximately 21 spotted hyenas,
but the abundance of local prey animals determines clan size (Smith and Holekamp, 2010). Within their territory defended by each
clan, individuals travel, rest, and forage alone or in subgroups (Holekamp et al., 2000). The composition of subgroups typically
changes several times during a single day, and the sizes of subgroups range from one to tens of animals (Holekamp et al., 2000, 1997).
Spotted hyenas also frequently congregate at the communal den, which serves as the clan’s social center (Boydston et al., 2003).
Females with young cubs visit the den regularly to nurse their dependent offspring, and sub-adults, adult males, and adult females
without den-dwelling cubs also visit the communal den frequently (Boydston et al., 2003).
The population estimate of spotted hyenas in Africa is between 27,000 and 47,000 individuals, which is most likely to be
underestimated (Mills and Hofer, 1998). There is little information on carnivore monitoring in Ethiopia, due to difficulties surveying
carnivores, resulting from their biology, including extensive-ranging patterns, low densities, cryptic habits, nocturnal movements, and
shy nature, often aggravated by persecution from humans. These characteristics make many traditional population survey methods
impractical for counting carnivores; however, the development of distance sampling techniques has provided new opportunities
(Buckland et al., 2001). Distance sampling techniques have been employed successfully for various species in diverse ecosystems but
have rarely been used for carnivores. Despite this, the techniques are appropriate for particularly medium to large carnivores; car
nivores are reasonably well habituated, as in many well-visited protected savannas in eastern and southern Africa (Sarah et al., 2011).
Most spotted hyena populations in protected areas of southern Africa are stable, but in protected areas of eastern and western
Africa, they are declining due to incidental snaring and poisoning. Rapid human population growth on the African continent has led to
increased human-wildlife conflicts with apex predators. Diseases, habitat loss, and persecution by humans make hyenas dependent on
conservation areas (Craigie et al., 2010; Mills and Hofer, 1998). Spotted hyenas eat almost mammals, birds, fish, or reptiles,
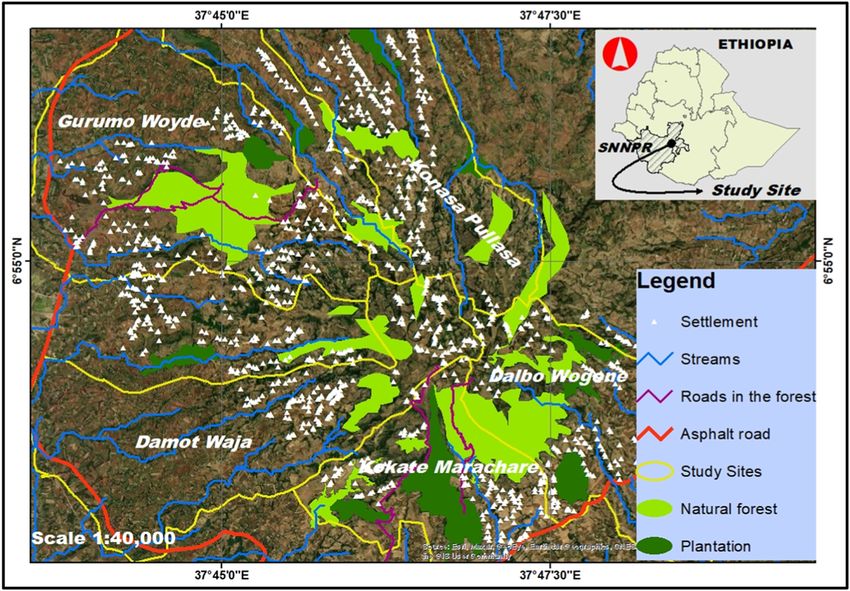
Fig. 1. Location map of the study area.
2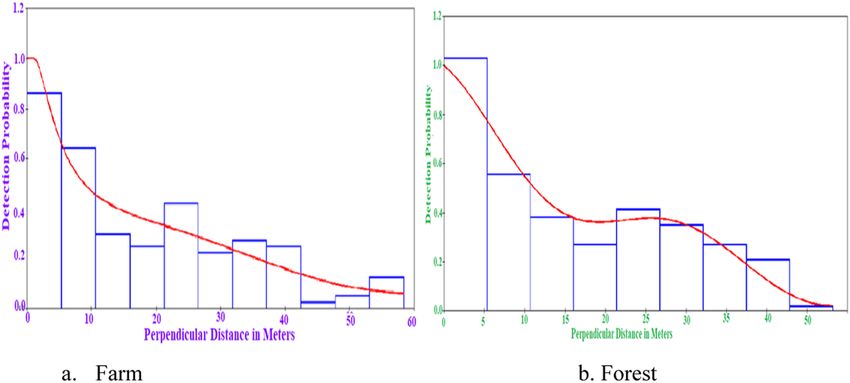
Y. Deneke et al. Global Ecology and Conservation 34 (2022) e02037
irrespective of size or species. They have a reputation for killing and scavenging domestic livestock, primarily cattle, sheep, and goats,
but also poultry, cats, dogs, horses, donkeys, and camels (Sillero-Zubiri and Gottelli, 1992). Hyenas are opportunistic scavengers of
human waste, bones, and dung and may forage on anthrax-infested carcasses without detrimental consequences. They can eat and
digest all parts of their prey except hair and hooves (Sillero-Zubiri and Gottelli, 1992). Livestock depredation by spotted hyenas and
retaliatory killings of spotted hyenas is a common problem in Africa, including Ethiopia. The ecology of spotted hyenas can be
examined in some parts of Ethiopia, but the density estimation using distance sampling techniques and livestock depredation by
spotted hyenas is not well investigated and documented. Therefore, this study examines on the population density of spotted hyena
using distance sampling techniques and livestock depredation by the spotted hyenas in the Damota community managed forest,
Wolaita Zone, Southern Ethiopia.
2. Materials and methods
2.1. Description of the study area
The study area lies in the north part of Wolaita Sodo town over the plateau of Damota, which is the prominent feature in the region
with an average elevation of 2950 m. The area is in the North longitudes between 370 42′ 30′′ to 370 50′ 30′′ and East latitudes 60 50′
30′′ to 60 58′ 00′′ and covers several areas, namely Kunasa Pulasa, Gurumu Wide, Damot Waja, Kokate Marachere and Delbo Wogene
Peasant association (Fig. 1). The study area covers 100 km2 and mainly extends over the top of the hill. The mean annual rainfall ranges
between 1450 and 1800 mm and increases gradually towards the mountain. The area receives its maximum rainfall between June and
September, while the minimum rainfall is between March and April. Temperature ranges from 16 ◦ C to 24 ◦ C between wet and dry
seasons. Yichia, Etana, Kaleta, and Beshir rivers and their tributaries drain the area. These rivers then flow to Abaya Lake. The area is
characterized by rugged topography, diversified agro-ecology, fauna, and flora. Plant species such as Olivia rochetiana, Syzygium
guineense, Buddleja polystachya, Acacia abyssinica, Eriobotrya japonica, Juniperus procera. Croton macrostachyus, Bersama abyssinica,
Albizia schimperiana, Maytenus gracilipes, Rytigynia neglecta, Allophylus abyssinicas, Rhamnus prinoides, Erica arborea, Maesa lanceolata,
Olea europaea sp. Acacia hockii, Celtis africana, Agarista salicifolia, Fagaropsis angolensis, Buddleja polystachya Flacourtia indica and
Calpurnia aurea are found in Damota (World Vision Ethiopia, 2010). Damota Community Conservation forest hosts a variety of wildlife
such as olive baboons (Papio anubis), vervet monkey (Chlorocebus pygerythrus), duikers (Sylvicapra grimmia), Guenther’s dik-dik
(Madoqua guentheri), Porcupine (Hystric cristata), and predators, including golden jackals (Canis aureus), black-backed jackals (Canis
mesomelas), leopards (Panthera pardus), leopard (Leopards wiedii), African civet (Civetticis civetta) and spotted hyena (Crocuta crocuta)
(World Vision Ethiopia, 2010). It supports the life of a large agricultural community that established livelihoods on the endowment of
the surrounding environment. The main economic activity for the local people is agriculture, mainly producing Irish potato (Phy
tophthora infestans), sweet potato (Ipomoea batatas), wheat (Triticum aestivum), Barley (Hordeum vulgare), false banana (Ensete ven
tricosum), taro (Colocasia esculenta), banana (Musa sp.), maize (Zea mays) and common bean (Phaseolus vulgaris). The Damota
communities are herding sheep, donkeys, bulls, goats, mule, horse, heifer, cow, and oxen at a small scale level. The livestock popu
lation found in Damota communities has estimated standing populations of 5288 sheep, 807 donkeys, 1499 bulls, 50 goats, 361 mules,
556 horses, 1380 heifer, 4114 cow, 1854 calves, and 3226 oxen (World Vision Ethiopia, 2010). The cattle, sheep, and horses were
released to the nearby forests without herders during the daytime and brought back to their sheds near human houses late in the
evening. Bulls and ox spent most of their time in the forests during the daytime. Horses, donkeys, and mules have been left grazing in
the forests without herders. Heifer, goats, and poultry were stall-feds and primarily kept in the sheds near the settlement.
2.2. Data collection method
The study area was stratified into two main census zones based on major habitat types. A total of 25 transects were sampled. The
number of transects in each census zone varied depending on visibility. We used distance sampling procedures to estimate the density
of spotted hyenas in the study area (Buckland et al., 1993; Burnham et al., 1980; Karanth and Sunquist, 1992; Wang, 2010). The line
transects were randomly established to estimate the population size of the animal. Transect lines were delineated by GPS coordinates,
poles, and natural signs. Transects were surveyed systematically with the help of trained and experienced local people from January
2019 to December 2020 during wet and dry seasons at a specified time to maximize the probability of seeing all individuals of spotted
hyena in the transect of 100 km2 area. Eighteen transects on the farm and seven transects in the forest habitat were used. The transect
length varied from 1.5 to 3.0 km depending on the habitat type. Consecutive transects were established at a distance of 500 m to 1 km.
Each transect was surveyed two times within a day during the dry (December to February) and wet (June to August) seasons, early in
the morning (05:00 pm–07:30 am) and late afternoon (5:00–7:30 pm). For each detection sighting distance, spotted hyena observa
tion, sighting angle, time, group size, sex, and age categories were recorded. Distance and angle between the observer and animals
were recorded by laser meter from the center of the transect line. Each of the individuals was grouped into its respective sex and age
classes during counting. Identification of sex and age categories was carried out using body size, pelage, external genitalia, and
mammary glands (East et al., 2003). In addition, sex was determined based on erect phallus morphology, where females have a
rounded phallus compared to males’ pointed-shaped phallus (Holekamp et al., 2012). However, a clear image of an erect phallus was
impossible for all individuals. In such cases, the curve of the abdominal region was used, where males have an upward curve before the
back legs and females a flat abdominal region (Holekamp et al., 2012).
3
Y. Deneke et al.                                                                                               Global Ecology and Conservation 34 (2022) e02037

2.3. Sample size determination and sampling technique

   The farmer-household sample size was calculated using the standard formula for estimating a single proportion, Z2 P (1-P)/ d2,
where ‘n′ is the estimated sample size, ‘Z′ is the critical value (1.96) at a 95% confidence level, ‘P′ is an expected proportion (50%) of
farmers that had information about livestock loss by spotted hyena and‘d′ is precision or margin of error which is fixed at 5% (Daniel,
1995). Thus, using the above formula, the calculated sample size to be selected from the five Peasant Associations was 384 households.
Proportional allocation of the calculated sample size to each of the Peasant Associations was made by using the formula, nh = N (n)/εN
(Norton-Griffiths, 1978), where, nh=number of sample households to be selected from each peasant associations N = total number of
households in each Peasant Associations n = calculated total sample size to be selected from all the Peasant Associations understudy
N=sum total of households in the selected peasant associations (Table 1).
   The household lists in each of the Peasant Association’s administration offices were used as a sampling frame. Systematic sampling
was used to pick the households for data collection. To systematize the sampling, the total number of households in each of the Peasant
Associations was divided by its proportionally allotted sample size. The resulting number served as a sampling interval until the
required numbers of sample households were obtained.

2.4. Economic loss assessment and analysis

    A total of 384 randomly selected households from five Peasant Associations (Kokate Marachere, n = 46), (Gurumu Woide,
n = 164), (Delebo Wogene, n = 59), (Damot Waja, n = 50), (Kunasa Pullasa, n = 65) of Damota community managed forest were used
in this study. Random selection of households was made by numbering the households and drawing the numbers from a randomized
table. The study sites were chosen due to the known presence of spotted hyenas with relatively high levels of livestock losses with the
assistance of local authorities. Respondents were asked questions relating to the number of livestock owned, livestock management,
number of livestock lost to predation, diseases, and theft from 2016 to 2020. The species numbers of livestock losses were recorded to
quantify the economic cost of livestock lost due to depredation, disease, and theft. Estimates of current average market values of
different classes of livestock species by age and sex were obtained from people frequently involved in the trading of livestock species.
Ethiopian birr was converted into US$ at the exchange rate of the time of the study. Descriptive statistics, frequencies, and percentages
were used to present the data. Regression and correlation analysis was performed through SPSS software.

2.5. Density estimation of spotted hyena

   DISTANCE (Version 6.0, Release 2) Software was used for density estimation of spotted hyena populations. All observations
recorded from transects laid in the habitat were grouped for analysis. Following the methodology described in (Buckland et al., 1993,
2001), various key functions and adjustment term combinations were considered to model the detection function. Hence, the density of
spotted hyena groups within the area surveyed (Dg) was estimated as (Buckland et al., 2001):-
                   nf(0)
        Dg =
                    2L

where L denotes the aggregate length of the transects, n is the number of spotted hyena groups observed and f(0) is the probability
density function of observed perpendicular distances evaluated at x = 0. Thus, density estimates will be obtained from the estimates of
                      n
and encounter rate l.f(0) equal to 1⁄μ, where μ is the effective stripe half-width, corresponding to the perpendicular distance from the
transect line within which the number of undetected groups is equal to the number of groups detected beyond it. Multiplying double
the effective stripe half-width by the aggregate length of transects yields the effective area surveyed. Spotted hyena density (D) was
obtained by multiplying the estimated group density by the estimated expected group size E(s). Data was truncated to get the better
model fit, and the best model was selected based on the lowest AIC (Akaike Information Criteria) value (Buckland et al., 1993).

3. Results

   In the present study, 602 groups of spotted hyena were seen in distance-based surveys with an average group size of 15. A mean of
113 ± 0.51 spotted hyena individuals was observed in the present study area. The overall density of spotted hyena was 1.34 ± 0.42

                           Table 1
                           Proportional distribution of sample size to the Peasant Associations for the livestock loss by spotted hyena
                           in Damota community managed forest.
                            Peasant Associations                           Households                             Sampled households

                            Kokate Marachere                               1971                                   46
                            Gurumu Woide                                   6965                                   164
                            Delebo Wogene                                  2498                                   59
                            Damot Waja                                     2143                                   50
                            Kunasa Pullasa                                 2765                                   65
                            Total                                          16,342                                 384

                                                                                4
Y. Deneke et al. Global Ecology and Conservation 34 (2022) e02037
and 0.69 ± 0.12 individuals/km2 and 0.55 ± 0.97 and 0.75 ± 0.14 individuals/km2 in farm and forest during 2019 and 2020,
respectively. HR/Co and Ne/Co and Un/Co and Ne/Co were best-fitted models for spotted hyena density estimation with the lowest
AIC, with estimated Effective Strip Width (ESW) of 18.00 and 18.65 in farms and forest during 2019, respectively and 31.94 and 16.33
in farms and forest during 2020, respectively (Table 2 and 3). Fig. 2a, b & 3a, b showed that the detection probability of spotted hyena
decreases as its distance increases.
3.1. Population structure
3.1.1. Age structure and sex ratio
The result of this study showed that the mean number of spotted hyena was 95 ± 0.47 and 130 ± 0.55 during the dry and wet
season, respectively. Among them, the mean number of adult males comprises 18 (12%), and adult females were 33 (22%), un
identified sex was 5 (3%), sub adult males were 9 (6%), sub-adult females were 17 (11%), cubs were 14 (9%) during the dry season.
However, the mean number of adult males comprises 26 (13%), and adult females were 36 (18%), unidentified sex were 8 (4%), sub
adult males were 13 (6%), sub-adult females were 26 (11%), cubs were 21 (9%) during the wet season. The mean sex ratio of the adult
male to adult female was 0.63:1:00; sub-adult male to sub-adult female was 0.52:1:00 and adult to cub ratio was 1:0.28. There was a
significant difference of spotted hyena individuals during the dry and wet seasons in 2019 (χ2 = 8.862, df = 1, P < 0.05). However,
there was no significant difference of spotted hyena individuals between dry and wet seasons in 2020 (χ2 = 2.547, df = 1, P > 0.05)
(Table 4).
3.1.2. Livestock losses
Surveyed households reported 459 livestock losses due to depredation, disease, and theft over the past five years. Spotted hyenas
depredated 377 livestock over the past five years. Pairwise correlation of losses of livestock reveals that theft and stock were weak
positive correlation (R = 0.26, P = 0.12), diseases and stock (R = 0.37, P = 0.06), and depredation and stock (R = 0.14, P = 0.27).
Livestock loss by spotted hyena depredation was higher than the accumulated losses by diseases and theft (377 and 82, respectively).
The average annual depredation was 75.4 livestock, equivalent to 2% of the average annual stock. The linear regression analysis model
explained the relationship between depredation and stock number is differ (p = 0.04; R2 = 0.4; df =9) and diseases and stock number
(p = 0.02; R2 = 0.46; df = 9). However, relationship between theft and stock number is not differ (p = 0.53; R2 = 0.05; df = 9)
(Table 5).
3.1.3. Livestock species vulnerable to the predation of spotted hyena
Spotted hyena attacks reported were not in proportion to the relative abundance of livestock species. Sheep were more likely to be
reported as lost to spotted hyena predation, representing 64.8%, followed by donkey (16.4%) and calves (5.9%). Taking advantage of
almost the entire spectrum of domestic prey available in the study area, four livestock species have been identified during the
household survey as most vulnerable to the predation of spotted hyenas (Table 6).
3.1.4. Economic loss assessment
The total estimated economic loss caused by depredation, theft, and diseases was about US$ 47,885, representing 77%, 12.2%, and
10.8%, respectively. A total of 377 livestock were depredated by spotted hyenas, causing an estimated financial loss of about US$
36,760. The average annual depredation resulted in an estimated economic loss of about US$ 7352. On average, US$ 9577 per year has
been lost over the past five years. The average annual depredation per household was 0.98 head of livestock worth US$ 95.6 (Table 7).
4. Discussion
It is important to assess the status and distribution of animals to monitor population trends. This is one of the key ecological
parameters for understanding species ecology and conservation status (Wang, 2010). For example, spotted hyenas are unique in Af
rican ecosystems due to being a very successful predator with an adaptable diet (Cozzi et al., 2013). However, Ethiopia’s ecological
aspects of spotted hyenas, viz. density, distribution, social behavior, and activity patterns, were not well studied and documented.
Therefore, reliable density estimates are necessary for the conservation of spotted hyenas.
The density of spotted hyenas in the present study area was slightly higher than the density estimates in other areas of Africa. Yirga
Table 2
Density estimation of spotted hyena in Damota community managed forest during 2019.
Habitat Parameter Estimate SE % CV % CI AIC Model
Farm DS 0.13 0.41 30.51 0.74–0.24 1060.9 HR/Co
D 1.34 0.42 31.59 0.73–2.45
ESW 18.00 4.71 26.19 10.82–29.96
Forest DS 0.61 0.98 15.90 0.45–0.84 1620.0 Ne/Co
D 0.55 0.97 17.44 0.39–0.78
ESW 18.65 2.63 14.10 14.15–24.59
ESW = effective stripe width, Dg = cluster density, SE = standard error, CV = coefficient of variances, CI = Confidence Interval. AIC=Akaike In
formation Criterion, HRCo = Hazard rate with Cosines, NeCo = Negative exponential with cosines.
5Y. Deneke et al. Global Ecology and Conservation 34 (2022) e02037
Table 3
Density estimation of spotted hyena in Damota community managed forest during 2020.
Habitat Parameter Estimate SE % CV % CI AIC Model
Farm DS 0.75 0.12 15.76 0.55–0.1 1112.4 Un/Co
D 0.69 0.12 17.60 0.49–0.99
ESW 31.94 1.37 4.29 29.35–34.76
Forest DS 0.79 0.14 17.76 0.56–0.11 1300.7 Ne/Co
D 0.75 0.14 19.26 0.51–1.09
ESW 16.33 2.57 15.72 11.99–22.23
ESW = effective stripe width, Dg = cluster density, SE = standard error, CV = coefficient of variances, CI = Confidence Interval. AIC=Akaike In
formation Criterion, UnCo = Uniform with Cosines, NeCo = Negative exponential with cosines.
Fig. 2. Number of sightings of spotted hyena at different distances from the transect center-line in farm (a) and forest (b) (Detection function is HR/
Co and Ne/Co adjustment) of Damota Community protected forest (Year, 2019).
Fig. 3. Number of sightings of spotted hyena at different distances from the transect center-line in farm (a) and forest (b) (Detection function is Un/
Cos and Ne/Co adjustment) of Damota Community protected Area (Year, 2020).
et al. (2013) reported a density of 0.52 individuals/km2 of spotted hyena in northern Ethiopia, Mills and Harvey (2001) reported a
density of 0.12 individuals/km2 of spotted hyena in Kruger National Park in South Africa, Ogutu et al. (2005) reported a density of
0.463 individuals/km2 of spotted hyena in Mara Ecosystem, Kenya, Graf et al. (2008) reported a density of 0.33 individuals/km2 of
6Y. Deneke et al.
Table 4
Age and sex structure of spotted hyenas in Damota community managed forest (Mean ± SE).
Year Season Sex and age structure Sex and age ratio
Sex Age Sex
Am Af Un Ad SaM SaF Cu Total Am:Af SaM:SaF Ad:Cu
7
2019 Dry 19 ± 0.06 37 ± 0.04 5 ± 0.05 61 ± 0.11 9 ± 0.06 20 ± 0.09 16 ± 0.07 106 ± 0.33 0.51:1 0.45:1 1:0.26
Wet 31 ± 0.07 46 ± 0.08 9 ± 0.06 86 ± 0.21 15 ± 0.05 27 ± 0.07 26 ± 0.01 154 ± 0.34 0.67:1 0.56:1 1:0.30
2020 Dry 17 ± 0.11 28 ± 0.13 5 ± 0.05 50 ± 0.29 9 ± 0.06 13 ± 0.14 12 ± 0.12 84 ± 0.61 0.61:1 0.69:1 1:0.24
Wet 21 ± 0.14 26 ± 0.15 7 ± 0.07 54 ± 0.36 11 ± 0.10 25 ± 0.16 16 ± 0.15 106 ± 0.77 0.81:1 0.44:1 1:0.29
Mean 22 ± 0.09 35 ± 0.10 7 ± 0.06 63 ± 0.25 11 ± 0.07 21 ± 0.11 18 ± 0.08 113 ± 0.51 0.63:1 0.52:1 1:0.28
Am = Adult male, Af = Adult female, Un = Unidentified Sex, SaM = Sub adult male, SaF = Sub adult female, Cu = Cub, Ad = (Am+Af+Un).
Global Ecology and Conservation 34 (2022) e02037Y. Deneke et al. Global Ecology and Conservation 34 (2022) e02037
Table 5
Total livestock species lost reported by the respondents (n = 384) due to diseases, theft and spotted hyena predation from 2016 to 2020 in Damota
Community Managed Forest.
Livestock Stock Depredation Disease Theft Total loss
Sheep 5288 201 4 6 211
Donkey 807 75 6 12 93
Bulls 1499 10 2 7 19
Goat 50 14 1 2 17
Mule 361 11 3 1 15
Horse 556 4 5 1 10
Heifer 1380 8 1 4 13
Cow 4114 31 5 3 39
Calves 1854 18 9 0 27
Ox 3226 5 1 9 15
Total 19,135 377 37 45 459
Table 6
Ranking of livestock species based on vulnerability to predation of spotted hyena according to respondents in Damota
Community Managed Forest.
Livestock Respondents Percentage Rank
Sheep 249 64.84 1st
Donkey 63 16.41 2nd
Calves 23 5.99 3rd
Cow 19 4.95 4th
Goats 11 2.86 5th
Ox 10 2.61 6th
Others 9 2.34 7th
Total 384 100
Table 7
Estimates of economic loss by the respondents (n = 384) in US$ due to diseases, theft and predation of livestock by spotted hyena from 2016 to 2020
period in Damota Community managed forest.
Livestock Depredation Disease Theft Total
Sheep 10,050 200 300 10,550
Donkey 8437.5 675 1350 10,462.5
Bulls 5000 1000 962.5 6962.5
Goat 560 40 80 680
Mule 1650 450 150 2250
Horse 650 812.5 162.5 1625
Heifer 600 75 430 1105
Cow 7750 1250 750 9750
Calves 1125 562.5 0 1687.5
Ox 937.5 187.5 1687.5 2812.5
Total 36,760 5252.5 5872.5 47,885
spotted hyena in Hluhluwe-iMfolozi Park in South Africa, Holekamp and Dloniak (2006) reported a density of 0.07 individuals/km2 of
spotted hyena in Hwange National Park, Zimbabwe and Trinkel (Trinkel, 2009) reported a density of 0.02 individuals/km2 of spotted
hyena in Etosha National Park in Nambia, but equal with Aberdare National Park in Kenya, which was a density of 1.34 individu
als/km2 reported by Sillero-Zubiri and Gottelli (1992). These differences in densities might be due to the differences in prey abundance
and distribution in the present study area, as indicated by Karanth and Sunquist (1992). The availability of prey species and the
presence of carcasses of livestock that died from disease or by accident, and preyed on live domestic animals and human-originated
organic wastes around the villages might also explain the high density of spotted hyena in the present study area. Waste management is
poor in many areas of Ethiopia, and solid wastes are dumped along roadsides and in open areas. The spotted hyenas benefit from the
waste humans dispose of, while human communities are provided with a waste-clearing service. The relative abundance of hyenas is
also associated with its accepted role in removing garbage and carrion from households and urban dumps. When feeding on waste,
hyenas reduce fly and rat populations as well as bad odors (Sillero-Zubiri and Gottelli, 1992). The spotted hyena sighting in the farm
was higher than in the forest during 2019. However, there was low sighting on the farm than in the forest during 2020. This might be
due to deforestation increasing over time. Thus, the detection probability of spotted hyena was likely higher in the forest than in the
farm.
A mean of 113 ± 0.51 individuals of spotted hyena was observed in Damota community-managed forest; this population size is
small compared with other studies in different parts of Africa. The largest known populations occur in the Serengeti ecosystem,
8Y. Deneke et al. Global Ecology and Conservation 34 (2022) e02037
Tanzania and the Kruger National Park, with estimates of 8700 and 3900 spotted hyenas, respectively, followed by Zimbabwe (5600),
South Africa (1680–5100), Kenya (2000–4000), and Namibia (2000–3000) (Mills and Hofer, 1998). The small population size of
spotted hyenas in the present study area might be related to extensive human interventions, such as firewood collection, road con
struction, overgrazing, deforestation, urban expansion, and agricultural encroachment, which reduce the quality of spotted hyena
habitat.
The population of spotted hyenas during the wet season is higher than in a dry season in the present study area. The high numbers
of spotted hyenas might be related to good food availability, high fecundity rate, and reduced competition for food and spaces, as well
as relatively low human activities in their habitat during wet seasons, as reported by Hofer and East (1995). However, there might be a
scarcity of wild prey species and high human encroachment in their habitat during the dry season; this could be the factor for the
spotted hyenas’ migration to another area in search of food and shelter.
The mean sex ratio of the adult male to adult female was 0.63:1:00 and sub adult male to sub-adult female was 0.52:1:00. The sex
ratio of the spotted hyena observed during the present study agrees with the earlier observations in different parts of Africa (Ramono,
1991). There were a high proportion of females in the population, indicating that the spotted hyena can increase. The current study of
spotted hyenas was female-biased. The female-biased sex ratio indicates that more females were observed during the study period. This
might be due to sex accompanying factors such as breeding and maternal behavior. The differences in the sex ratio may be mainly due
to an increase in mortality of male spotted hyena due to predation. After three years of age, male spotted hyenas leaves the natal group
and distribute in less favorable habitats, and suffer an increased predation pressure compared with the females of the same age classes,
which stay in the natal group (Ramono, 1991). However, only a low proportion of cubs to adult age groups (0.28: 1.00) were observed
during the present investigation. This might be related to the pressure of predators and diseases. As the cubs are more vulnerable to
predators, they are usually hidden in an old aardvark hole, and which is called a communal den site, and under the dense bushes and
grasses that make counting difficult. During the first year of life, mortality is high in the spotted hyena as the cubs become susceptible
to predators and diseases (East et al., 2003). Moreover, some of the cubs might be vulnerable because of den flooding during the wet
season and starvation during the dry season.
Assessing depredation problems is important to develop actions for managing either livestock practices or wildlife conservation.
According to Yirga and Bauer (2010), the livestock losses caused by the spotted hyena represent an economic concern for livestock
owners in Southern Tigray. In the present study area, the spotted hyena was the common livestock predator. Surveyed households
reported losses of 377 domestic animals due to spotted hyena predation in the past five years (2016–2020). Sheep is the most
vulnerable species in the present study. This might be due to livestock owners rearing sheep and that they are easily accessible to the
predators. However, the donkey is the most vulnerable species in Tigray (Yirga and Bauer, 2010). Other studies have shown that most
predation by carnivores occurs on calves (Kruuk, 1972; Ogada et al., 2003). This finding is different from the reported losses of 364
domestic animals due to hyena predation in the past five years (2005–2009) (Yirga et al., 2013). Depredation of livestock in the current
study is slightly higher than in southern Tigray, but it is low compared to other studies in Africa (Tilson and Hamilton, 1984). However,
it can be an economic constraint to households, as they are subsistence farmers who depend on livestock rearing and crop production.
Livestock depredation by these large predators could be attributed to livestock husbandry practices, depletion of natural prey, and
proximity to human settlements. In some areas, individual animals learn that livestock is easier to catch or are forced to switch prey
species due to depletion of their natural prey choice (Mizutani, 1993). Various studies have demonstrated that livestock depredation is
more common in areas with low prey abundance (Holekamp et al., 1997; Polisar et al., 2003). Local environmental conditions such as
livestock husbandry practices and characteristics of attacked villages and livestock enclosures have influenced livestock depredation
(Mizutani, 1993; Williams et al., 2006). Habitat loss and overhunting of their prey species have led to increased human-spotted hyena
conflict, thus increasing livestock depredation (Williams et al., 2006). Retaliatory killing of the species were a direct threat to hyenas
existence (Holekamp et al., 1997).
In the present study, the total estimated economic loss caused by spotted hyena depredation, diseases, and theft, is about US$
47,885, representing US$ 36,760, US$ 5252.5, and US$ 5872.5, respectively. The annual mean economic loss per household was
estimated to be US $95.6. The mean annual livestock loss per household was 0.98 head of stock. In southern Tigray, the average annual
depredation per household was 0.13 livestock worth US$ 6.1 (Yirga et al., 2013). In southern Tigray, the estimated economic loss
caused by spotted hyena depredation, diseases, and theft is about US$ 229,104, representing US$ 27,007.47, US$ 195,888.9, and US$
6208.32, respectively (Yirga and Bauer, 2010). Predation on livestock is an important cause of human− wildlife conflict (Mills and
Harvey, 2001). Our survey of human− spotted hyena conflicts revealed that livestock losses caused by the spotted hyena might
represent an economic concern for livestock owners. This economic impact on an individual livestock owner might result in the
retaliatory killing of the spotted hyena in Damota Community Managed Forest.
5. Conclusions
The effective management of animals is greatly improved by its knowledge of ecological aspects. Hence, population size estimation
of the spotted hyena is the essential ecological information needed for the management of their population ecology of spotted hyena.
The distance sampling method provided an appropriate technique for estimating the density of this animal. This is the first study of the
spotted hyena, one of the large-sized carnivores living in the Damota community managed forest. The population size and livestock
depredation were low when compared with other studies in different parts of Africa. Livestock management practices should be in
place to mitigate human− spotted hyena conflict. Besides this, a compensation fee to the local community for losing livestock by
spotted hyena would help mitigate human− spotted hyena conflict. Knowledge of prey preference of spotted hyenas concerning
livestock can offer important insights into the effectiveness of depredation prevention measures. Mitigation of livestock depredation is
9Y. Deneke et al. Global Ecology and Conservation 34 (2022) e02037
highly recommended through improved animal husbandry. Improving enclosures and changing herding methods could decrease
livestock depredation in the study area. It is expected that the present results will provide baseline ecological data and motivation for
conservation efforts focused on the conservation of spotted hyena and their habitats in the Damota community-managed forest.
Continuous monitoring of spotted hyenas within the area will provide crucial information to manage the reserve better and understand
population dynamics.
Declaration of Competing Interest
The authors declare that they have no known competing financial interests or personal relationships that could have appeared to
influence the work reported in this paper.
Data Availability
The data used and analyzed during the current study are available from the corresponding author upon request.
Acknowledgments
We sincerely thank VLIR-UOS, University of Antwerp, Belgium, and Wolaita Sodo Universities, Ethiopia, for financial support.
Thanks to the local community for their hospitality and kind response.
References
Boydston, E.E., Kapheim, K.M., Watts, H.E., Szykman, M., Holekamp, K.E., 2003. Altered behavior in spotted hyenas associated with increased human activity. Anim.
Conserv. 6, 207–219.
Buckland, S.T., Anderson, D.R., Burnham, K.P., Laake, J.L., 1993. Distance Sampling: Estimating Abundance of Biological Populations. Chapman and Hall, New York.
Buckland, S.T., Anderson, D.R., Burnham, K.P., Laake, J.L., 2001. Introduction to Distance Sampling: Estimating Abundance of Biological Populations. Oxford
University Press, Oxford, UK.
Burnham, K.P., Anderson, D.R., Laake, J.L., 1980. Estimation of density from line transects sampling of biological populations. Wildl. Monogr. 72, 1–202.
Cozzi, G., Broekhuis, F., McNutt, J.W., Schmid, B., 2013. Density and habitat use of lions and spotted hyenas in northern Botswana and the influence of survey and
ecological variables on call-in survey estimation. Biol Conserv. 22, 2937–2956.
Craigie, I.D., Baillie, J.E.M., Balmford, A., Carbone, C., Collen, B., Green, R.E., Hutton, J.M., 2010. Large mammal population declines in Africa’s protected areas. Biol.
Conserv. 143, 2221–2228.
Daniel, W.W., 1995. Biostatistics a Foundation for Analysis in the Health Science, 6th ed. John Willey and Sons Inc, New York, USA.
East, M.L., Burke, T., Wilhelm, K., Greig, C., Hofer, H., 2003. Sexual conflicts in spotted hyenas: male and female mating tactics and their reproductive outcome with
respect to age, social status and tenure. R. Soc. 270, 1247–1258.
Frank, L.G., Holekamp, K.E., Smale, L., 1995. Dominance, demography, and reproductive success of female spotted hyenas. In: Sinclair, A.R.E., Arcese, P. (Eds.),
Serengeti II: Dynamics, Management, and Conservation of an Ecosystem. University of Chicago Press, Chicago, Illinois, USA, pp. 364–384.
Graf, J., Somers, M.J., Szykman, M., Slotow, R., 2008. Heterogeneity in the density and distribution of spotted hyaenas in Hluhluwe-iMfolozi Park. South Africa. Acta
Therioligica 54, 333–343.
Heather, E., Watts, Kay, E., 2007. Holekamp. Hyena societies. Curr. Biol. 17, 657–660.
Hofer, H., East, M.L., 1995. Population dynamics, population size, and the commuting system of Serengeti spotted hyenas. Serengeti II: dynamics. In: Sinclair, A.R.E.,
Arcese, P. (Eds.), Management and Conservation of an Ecosystem. University of Chicago Press, Chicago, pp. 332–363.
Holekamp, K.E., Dloniak, S.M., 2006. Intraspecific variation in the behavioral ecology of a tropical carnivore, the spotted Hyena. Adv. Behav. 42, 189–229.
Holekamp, K.E., Smale, L., Berg, R., Copper, S.M., 1997. Hunting rates and hunting success in the spotted hyena (Crocuta crocuta). J. Zool. 242, 1–15.
Holekamp, K.E., Boydston, E.E., Smale, L., 2000. Group travel in social carnivores. In: Boinski, S., Garber, P. (Eds.), On the Move: How and Why Animals Travel in
Groups. University of Chicago Press, Chicago, IL, USA, pp. 587–627.
Holekamp, K.E., Smith, J.E., Strelioff, C.C., Van Horn, R.C., Watts, H.E., 2012. Society, demography and genetic structure in the spotted hyena. Mol. Ecol. 21,
613–632.
Honer, O., Holekamp, K.E., Mills, G., 2008. Crocuta crocuta. In: IUCN 2008. IUCN Red List of Threatened Species. Retrieved 22 March 2009. Database entry includes a
brief justification of why this species is of least concern.
IUCN, 2008. In-depth information on hyena biology and conservation. The Hyena Specialist Group, member of the Species Survival Commission of the World
Conservation Union. 〈www.hyaenidae.orgs〉.
Karanth, K.U., Sunquist, M.E., 1992. Population structure, density and biomass of large herbivores in the tropical forests of Nagarhole. Ind. J. Trop. Ecol. 8, 21–35.
Kolowski, J.M., Holekamp, K.E., 2009. Ecological and anthropogenic influences on space use by spotted hyenas. J. Zool. 277, 23–36.
Kruuk, H., 1972. The Spotted Hyena: A Study of Predation and Social Behavior. The University of Chicago Press, Chicago, USA.
Mills, M.G.L., 1990. Kalahari Hyenas: Comparative Behavioral Ecology of Two Species. Unwin Hyemn, London.
Mills, M.G.L., Harvey, M., 2001. African Predators. Struik, Cape Town.
Mills, M.G.L., Hofer H., Hyenas, 1998. Status Survey and Conservation Action Plan. IUCN/SSC Hyena Specialist Group. IUCN, Gland, Switzerland and Cambridge,
1998; United Kingdom (compilers).
Mizutani, F., 1993. Home range of leopards and their impact on livestock on Kenyan ranches. In: Dunstone, N., Gorman, M.L. (Eds.), Mammals as Predators.
Proceedings of the Symposium Zoological Society of London. Clarendon Press, Oxford, UK.
Norton-Griffiths, M., 1978. Counting Animals. Handbook Number 1. African Wildlife Leadership Foundation, Nairobi.
Ogada, M.O., Woodroffe, R., Oguge, N.O., Frank, L.G., 2003. Limiting depredation by African carnivores: the role of livestock husbandry. Conserv. Biol. 17,
1521–1530.
Ogutu, J.O., Bhola, N., Reid, R., 2005. The effects of pastoralism and protection on the density and distribution of carnivores and their prey in the Mara ecosystem of
Kenya. J. Zool. 265, 281–293.
Polisar, J., Matix, I., Scognamillo, D., Farrell, L., Sunquist, M.E., Eisenberg, J.F., 2003. Jaguars, pumas, their prey base, and cattle ranching: ecological interpretations
of a management problem. Biol. Conserv. 109, 297–310.
Ramono, W.S., 1991. Importance of sex-ratio and age-structure in the management of elephant populations. Gajah 7, 9–12.
Sarah, M.D., Meggan, E., Ray, H., Sultana, B., Justin, H., Len, T., 2011. Long-term trends in carnivore abundance using distance sampling in Serengeti National Park,
Tanzania. J. Appl. Ecol. 48, 1490–1500.
Sillero-Zubiri, C., Gottelli, D., 1992. Feeding ecology of spotted hyena (Mammalia: Crocuta crocuta) in a mountain forest habitat. J. Afr. Zool. 106, 169–176.
Smith, J.E., Holekamp, K.E., 2010. Spotted Hyenas Michigan State University. MI, USA ã Elsevier Ltd., East Lansing.
10Y. Deneke et al. Global Ecology and Conservation 34 (2022) e02037
Tilson, R.T., Hamilton, W.J., 1984. Social dominance and feeding patterns of spotted hyenas. Anim. Behav. 32, 715–724.
Trinkel, M., 2009. A keystone predator at risk? Density and distribution of the spotted hyena Crocuta crocuta in the Etosha National Park. Namib. J. Can. Zool. 87,
928–935.
Wang, S.A., 2010. Estimating population densities and biomass of ungulates in the temperate ecosystem of Bhutan. Oryx 44 (3), 376–382.
Williams, R., Hedley, S.L., Hammond, P.S., 2006. Modeling distribution and abundance of Antarctic baleen whales using ships of opportunity. Ecol. Soc. 11 (1), 1–9.
World Vision Ethiopia, 2010. The Sodo community managed reforestation (forest regeneration) project “many species, one planet, and one future”). submission to the
climate, community and biodiversity standard. Sport. World Vis. Aust. 64p.
Yirga, G., Bauer, H., 2010. Livestock depredation of the spotted hyena (Crocuta crocuta) in Southern Tigray, Northern Ethiopia. Int. Ecol. Environ. Sci. 36 (1), 67–73.
Yirga, G., Ersino, W., De Iongh, H.H., Leirs, H., Gebrehiwot, K., Deckers, J., Bauer, H., 2013. Spotted hyena (Crocuta crocuta) coexisting at high density with people in
Wukro district, northern Ethiopia. MammaBiol 78 (3), 193–197.
11You can also read