Resilience of a Fire-Maintained Pinus palustris Woodland to Catastrophic Wind Disturbance: 10 Year Results
←
→
Page content transcription
If your browser does not render page correctly, please read the page content below
Article
Resilience of a Fire-Maintained Pinus palustris Woodland to
Catastrophic Wind Disturbance: 10 Year Results
J. Davis Goode *, Jonathan S. Kleinman                    and Justin L. Hart

                                          Department of Geography, University of Alabama, Tuscaloosa, AL 35487, USA;
                                          jskleinman@crimson.ua.edu (J.S.K.); hart013@ua.edu (J.L.H.)
                                          * Correspondence: jdgoode2@crimson.ua.edu; Tel.: +1-205-348-1673

                                          Abstract: Increased interest in ecosystem recovery and resilience has been driven by concerns over
                                          global change-induced shifts in forest disturbance regimes. In frequent-fire forests, catastrophic
                                          wind disturbances modify vegetation-fuels-fire feedbacks, and these alterations may shift species
                                          composition and stand structure to alternative states relative to pre-disturbance conditions. We
                                          established permanent inventory plots in a catastrophically wind-disturbed and fire-maintained
                                          Pinus palustris woodland in the Alabama Fall Line Hills to examine ecosystem recovery and model
                                          the successional and developmental trajectory of the stand through age 50 years. We found that
                                          sapling height was best explained by species. Species with the greatest mean heights likely utilized
                                          different regeneration mechanisms. The simulation model projected that at age 50 years, the stand
                                would transition to be mixedwood and dominated by Quercus species, Pinus taeda, and P. palustris.

                                          The projected successional pathway is likely a function of residual stems that survived the catas-
Citation: Goode, J.D.; Kleinman, J.S.;    trophic wind disturbance and modification of vegetation-fuels-fire feedbacks. Although silvicultural
Hart, J.L. Resilience of a                interventions will be required for this system to exhibit pre-disturbance species composition and
Fire-Maintained Pinus palustris           structure, we contend that the ecosystem was still resilient to the catastrophic disturbance because
Woodland to Catastrophic Wind
                                          similar silvicultural treatments were required to create and maintain the P. palustris woodland prior
Disturbance: 10 Year Results. Forests
                                          to the disturbance event.
2021, 12, 1051. https://doi.org/
10.3390/f12081051
                                          Keywords: mixedwoods; pine-oak (Pinus-Quercus); tornado; sapling; stand development; succession
Academic Editors: Teresa
Fidalgo Fonseca, Gurveen Arora,
Peter Spathelf, Xiongqing Zhang and
Tadesse Wubalem                           1. Introduction
                                               All forests exist in a state of recovery from past disturbances, which influence forest
Received: 6 July 2021                     development and succession [1]. Along the gradient of disturbance severity, catastrophic
Accepted: 5 August 2021                   disturbances, events that result in the mortality of most or all overstory vegetation, are the
Published: 7 August 2021                  most infrequent but the most severe [2,3]. After catastrophic disturbance, components of
                                          ecological memory, such as information and material biological legacies, persist [4]. Infor-
Publisher’s Note: MDPI stays neutral      mation and material biological legacies are the individuals, adaptations, and structures
with regard to jurisdictional claims in   that remain post-disturbance and facilitate ecosystem recovery toward pre-disturbance
published maps and institutional affil-   conditions [5]. The retention of biological legacies provides continuity between pre- and
iations.
                                          post-disturbance forest ecosystems, and therefore drives ecological resilience [6,7]. Catas-
                                          trophic wind disturbances reduce or even completely remove overhead competition and
                                          thereby increase resource availability in the regeneration layer. Microsite characteristics of
                                          the forest floor, the persistence of resting buds and seedbanks, residual seedlings, saplings,
Copyright: © 2021 by the authors.         and small trees, and the arrival of new propagules influence post-disturbance tree regen-
Licensee MDPI, Basel, Switzerland.        eration [2]. Biological legacies are strong controls on successional and developmental
This article is an open access article    pathways, which are the measures of ecological resilience of the system (i.e., ecosystem
distributed under the terms and           capacity to recover toward pre-disturbance conditions) [8,9].
conditions of the Creative Commons
                                               Catastrophic disturbances modify vegetation-fuels-fire feedbacks in frequent-fire
Attribution (CC BY) license (https://
                                          forests [10–12]. The perpetuation of fire-dependent ecosystems requires the continuous
creativecommons.org/licenses/by/
                                          feedbacks of canopy tree-derived pyrophytic fuels (i.e., leaf litter inputs) burning with
4.0/).

Forests 2021, 12, 1051. https://doi.org/10.3390/f12081051                                                  https://www.mdpi.com/journal/forests
Forests 2021, 12, 1051 2 of 15
sufficient intensity to inhibit recruitment of more fire-sensitive species [13]. Thus, frequent
low-severity fires promote canopy dominance of fire-adapted tree species and create
understory conditions suitable for the establishment and growth of pyrophytic ground
flora [14]. Catastrophic wind disturbances modify fuel complexes and therefore alter fire
effects. By killing overstory trees, catastrophic disturbances reduce or eliminate the fine
surface fuels required to produce desirable fire effects [15–17]. By altering vegetation-
fuels-fire feedbacks in fire-dependent ecosystems, catastrophic wind disturbances may
result in shifts in forest composition, structure, and function given the complex interactions
of information and material biological legacies [18]. The resilience of fire-dependent
ecosystems to catastrophic wind disturbance is not well understood and this will become
increasingly important as catastrophic wind events are projected to become more common
in some regions (e.g., the southeastern USA) where fire-dependent ecosystems occur [19].
To examine the ecological resilience of frequent-fire forests to catastrophic wind dis-
turbance, we established and monitored permanent inventory plots in a fire-maintained
Pinus palustris woodland in the Alabama Fall Line Hills, USA. The study area was im-
pacted by an EF3 tornado and we monitored recovery for the first 10 growing seasons
post-disturbance. The primary goal of our study was to quantify contemporary and project
future woody plant composition and structure in this fire-maintained, P. palustris woodland
impacted by catastrophic wind disturbance to provide information on ecosystem recovery
processes. Our specific objectives were to: (1) quantify woody plant composition and
structure 10 years post-catastrophic wind disturbance, (2) compare and examine the influ-
ence of species and biophysical site conditions on sapling height growth, and (3) model
the successional and developmental trajectory of the stand through age 50 years (year
2061). Our results provide insight on successional processes and patterns and the ecological
resilience of a fire-maintained Pinus woodland to catastrophic wind disturbance.
2. Materials and Methods
2.1. Study Site
Our study was conducted on the Oakmulgee Ranger District of Talladega National
Forest in west-central Alabama, USA. The study area occurs within the Fall Line Hills ecore-
gion [20] and the Quercus-Pinus forest region as defined by Braun [21]. The Fall Line Hills
represent a physiographic transition zone between the Appalachian Highlands and the
Gulf Coastal Plain [22]. Plant species richness is relatively high and forest communities con-
tain taxa representative of both the Appalachian Highlands and Coastal Plain [23,24]. Our
study site is specifically within the central Pinus palustris region as defined by Harper [25],
where P. palustris-dominated woodlands occur on fire-maintained ridgetops, upper slopes,
and south-to-west facing mid-slope positions. On more mesic sites, a variety of Quercus
spp. and other hardwoods coexist and share dominance with P. taeda [24,26,27].
Hillslopes and ridges in the study area contain deep, moderately well-drained soils
derived from the Cretaceous-aged Gordo Formation [28,29]. Maubila series soils consist of
a sandy loam or loam surface layer up to 10 cm deep. These soils have clay-based substrata
over 200 cm deep to bedrock [30]. The topography of the area is undulating and strongly
dissected with steep slopes that commonly range from 30 to 35% [31]. Elevation in the
area ranges from 90 to 160 m above mean sea level. The climate of the region is humid
mesothermal, characterized by long, hot summers, short, mild winters, and no distinct
dry season [32]. Mean temperature is 17.2 ◦ C, with mean January and July temperatures
of 6.6 and 26.9 ◦ C, respectively [33]. Mean annual precipitation is 1376.21 mm [33]. The
frost-free period is ca. 230 days from March to November [33].
The USDA Forest Service manages P. palustris woodlands on the study site with
prescribed fire on a 2–4 year rotation. The goals of the prescribed fire program are to reduce
fuel loads, promote fire-adapted ground flora assemblages, top-kill woody plants that
are fire-sensitive, and in mature stands, to expose bare mineral soil to promote natural
regeneration of P. palustris. On 27 April 2011, an EF3 tornado with estimated wind speeds
of 233 kph and a maximum width of 1609 m tracked through the Oakmulgee RangerForests 2021, 12, 1051 3 of 15
District [34]. Portions of the study area were salvaged logged from July to November 2011,
as is common practice after catastrophic wind disturbance. We established a permanent plot
network through the damaged area to monitor successional and structural development
of the catastrophically disturbed P. palustris woodland [35,36]. Although care was taken
in site selection, ecological studies of natural disturbance often preclude experimental
replicability. To address this, we selected a site in which all plots were contained within the
same watershed and USDA Forest Service compartment, and had common soil series and
topographic positions.
2.2. Field Methods
After the catastrophic wind disturbance, we established a network of permanent
plots to examine post-disturbance recovery for a range of response variables. Plots were
established based on satellite imagery, geospatial data, and ground reconnaissance to
ensure they were analogous based on biophysical and pre-disturbance conditions [35–37].
Prior to the tornado, all plots were P. palustris-dominated woodlands that were established
in the early 1930s after regeneration harvests. All plots occurred within a 1 km2 expanse of
the same watershed on upper- and mid-slope positions with Maubila series soils (Aquic
Hapludults). Plots were located in the same USDA Forest Service delineated compartment
and experienced the same prescribed fire regime (2–4 year rotation).
The permanent plot network consisted of 60 systematically established 0.04 ha fixed-radius
plots. Twenty plots were established in mature P. palustris-dominated woodlands that exhibited
no visible tornado damage. The mature site had a basal area of 21.7 m2 h−1 and 90% canopy
cover [35,36]. The remaining 40 plots were established in areas catastrophically disturbed by
the EF3 tornado. These plots were all at least 70 m from the edge of the disturbance swath to
account for forest edge effects [38]. For this study, we only used forest inventory data from
the 40 permanent plots that were established in the wind-disturbed portion of the study area
to examine successional development 10 years post-disturbance. All data reported here were
collected during the summer of 2020, which is the tenth growing season since the catastrophic
wind event. On each fixed-radius plot, we considered trees to be all live, woody stems ≥5 cm
diameter at breast height (dbh, 1.37 m above the earth surface). We documented species and
diameter for all trees. We considered saplings to be all live, woody stems ≥1 m height andForests 2021, 12, 1051 4 of 15
mean height and standard deviation for all saplings by species and used ANOVA with a
Tukey HSD post hoc test to evaluate differences in height by taxonomic group. Taxonomic
categories were assigned based on species, abundance, and growth form. We calculated
sapling stem density for all sapling species that occurred on our plots. To derive plot-level
ground flora and ground cover values, quadrat-level cover values were transformed to
corresponding range midpoints and averaged by plot.
To quantify the relative influence of species and environmental conditions on sapling
height growth, we applied a random forest (RF) machine learning algorithm. RF is a non-
parametric tool derived from classification and regression trees that is capable of accurately
modeling complex interactions between variables [41,42]. The algorithm combines “trees”
each generated by bootstrap samples, and retains samples for internal cross-validation
(i.e., out of bag estimates, OOB). The final model output is the mean result of all trees.
Model outputs include a variable importance measure, which ranks each predictor variable
by mean increase in error (% IncMSE) when observed values of predictor variables are
permuted through the model [41]. These values allow inference on which predictor variable
has the greatest influence on the independent variable within the model. We fit one RF
model to predict sapling height incorporating 200 regression trees into the model. Height
was modeled for each individual sapling that occurred on our inventory plots (n = 8191).
Predictor variables included species, clump size, plot-level canopy cover, sapling species
richness, sapling density, Pinus litter cover, tree density, basal area, slope percent, and trans-
formed aspect [43]. All models were cross-validated with a randomly selected training and
testing subset of the data and all independent variables were analyzed for multicollinearity.
RF was conducted using the package “randomForest” in R version 1.2.5001.
We used the Forest Vegetation Simulator (FVS) to project tree density and basal area
by species at decadal increments to stand age 50 years (the year 2061). The FVS is a publicly
available and commonly used simulation model maintained by the USDA Forest Service.
The simulation model is widely used by the USDA Forest Service and other forest managers
to aid in planning, management decisions, and research [44]. Our forest inventory data
were formatted for use in the Southern (SN) variant of the FVS. We ran the FVS in the
default setting which is deterministic mode. We provided initial stand inventory metrics
including tree species and dbh for all trees ≥2.54 cm formatted as a tree list. The FVS
allows users to modify management activities and environmental conditions to improve
projection accuracy. As a management component, we added prescribed burns as a fuel
treatment. We set the parameters as a prescribed fire every two years, with wind speeds of
12.8 kph at 6 m above live vegetation, dry moisture levels, 12.8 ◦ C temperature, 90% stand
area burned, and ignited before the spring flush. We modified fuel dynamics based on the
photo series in Scholl and Waldrop [45] (FC-6-Pre). Finally, we modified fire behavior by
adding drought events every 10 years with the duration of one year based on the observed
frequency of drought in this region [33,46].
3. Results
3.1. Woody Plant Composition, Structure, and Height
Basal area of the tree layer was 0.13 m2 ha−1 and total tree density was 191 stems ha−1
(Table 1). Tree species richness was 22. Of the total basal area, 76% was from residual stems
≥12.5 cm dbh. The largest tree recorded on a wind-disturbed study plot was a residual Pinus
taeda L. with a dbh of 64 cm. The largest residual Pinus palustris stem was 48.3 cm dbh. The five
trees with the largest diameters were Pinus spp. (all >30 cm dbh). The majority of trees (81%)
wereForests 2021, 12, 1051 5 of 15
Table 1. Density (stems ha−1 ) and relative density (Rel. Den., % of contribution) of trees (live, woody stems ≥5 cm dbh) by diameter bins (cm) documented in a catastrophically disturbed Pinus
palustris woodland on the Oakmulgee Ranger District, Talladega National Forest, Alabama, USA. Species are ranked by total relative density.
5–7.5 7.5–10 10–12.5 12.5–14.5 15–17.5 17.5–20 20–24.5 25–30 30+ Total
Rel. Rel. Rel. Rel. Rel. Rel. Rel. Rel. Rel. Rel.
Species Density Den. Density Den. Density Den. Density Den. Density Den. Density Den. Density Den. Density Den. Density Den. Density Den.
Pinus palustris Mill. 30 26 21 52 9 50 1 13 1 25 1 40 1 20 - - 3 100 65 34
Pinus taeda L. 11 9 6 14 7 39 3 63 1 50 1 40 1 40 1 50 1 25 32 17
Quercus stellata Wangenh. 18 16 3 8 - - - - - - - - - - - - - - 21 11
Quercus laevis Walter 14 13 3 6 1 4 - - - - - - - - 1 25 - - 18 9
Quercus coccinea Munchh. 9 8 2 5 1 4 - - - - - - - - - - - - 12 6
Quercus marilandica
Munchh. 7 6 1 3 - - - - - - - - - - - - - - 8 4
Quercus nigra L. 5 4 1 3 - - - - 1 25 1 20 1 20 - - - - 8 4
Liquidambar styraciflua L. 5 4 - - 1 4 - - - - - - - - - - - - 6 3
Quercus alba L. 4 4 - - - - - - - - - - - - 1 25 - - 5 3
Quercus margaretta (Ashe)
Small 3 2 1 3 - - 1 13 - - - - - - - - - - 4 2
Pinus echinata Mill. 1 1 1 2 - - - - - - - - 1 20 - - 1 40 3 1
Magnolia macrophylla
Michx. 2 2 - - - - - - - - - - - - - - - - 2 1
Quercus velutina Lam. 1 1 1 2 - - - - - - - - - - - - - - 2 1
Vaccinium arboreum
Marshall 1 1 1 2 - - 1 13 - - - - - - - - - - 2 1
Acer rubrum L. 1 1 - - - - - - - - - - - - - - - - 1 0
Carya glabra (Mill.) Sweet - - 1 2 - - - - - - - - - - - - - - 1 0
Cornus florida L. 1 1 - - - - - - - - - - - - - - - - 1 0
Nyssa sylvatica Marshall 1 1 - - - - - - - - - - - - - - - - 1 0
Quercus falcata Michx. 1 1 - - - - - - - - - - - - - - - - 1 0
Total 114 100 40 100 18 100 5 100 3 100 3 100 3 100 3 100 4 165 191 100dbh. Quercus was the most abundant genus in the smallest tree size class (Figure 1). Ho
ever, Pinus species were most common in all other diameter classes. Pinus palustris h
the highest relative density values in the three smallest diameter size class bins (5.0–1
Forests 2021, 12, 1051 cm dbh) with 60 stems ha−1 (Table 1). Pinus represented 45% of all stems between
6 of 15 5 and
cm dbh and Quercus represented 49% of stems in this size class. Of Quercus stems in t
size class, Q. stellata and Q. laevis were the most abundant.
−1 ) of trees (live, woody stems ≥5 cm dbh) by dbh bins (cm) documented in a catastrophically
Figure 1. Density
Figure 1. (stems ha−1) of
Density (stems hatrees (live, woody stems ≥ 5 cm dbh) by dbh bins (cm) documented in a catastrophically
disturbed disturbed Pinus palustris
Pinus palustris woodland woodland
on theon the OakmulgeeRanger
Oakmulgee Ranger District,
District, Talladega National
Talladega Forest,Forest,
National Alabama, USA.
Alabama, USA.Forests 2021, 12, 1051 7 of 15
Sapling density was 5119 stems ha−1 (Table 2). The most abundant species in the
sapling layer were Rhus copallinum and Vaccinium arboreum. Collectively, these species
represented 46% of all saplings on our study plots. The most abundant arboreal species
in the sapling layer were Q. falcata, Liquidambar styraciflua, and Q. nigra. No other species
represented more than 5% of sapling layer stems. Notably, P. palustris and P. taeda had
sapling densities of 74 stems ha−1 and 238 stems ha−1 , respectively, and collectively,
represented just 6% of all sapling stems. At the genus-level, Quercus represented 28% of
all saplings with a sapling density of 1422 stems ha−1 . Mean sapling height was greatest
for L. styraciflua, but height of this species was not significantly different from P. palustris,
Quercus spp., Oxydendrum arboreum, or other Pinus species (Figure 2). Taxa classed with
the shrub growth form (see Table 2 for a list) were significantly shorter than all other taxa,
including Rhus spp. and Vaccinium spp.
Table 2. Density (stems ha−1 ) and relative density (% of contribution), mean height, and standard deviation of mean height
(SD) of saplings (live, woody stemsForests 2021, 12, 1051 8 of 15
Forests 2021, 12, x FOR PEER REVIEW 8 of 15
Table 2. Cont.
Species Density (Stems ha−1 ) Relative Density (%) Mean Height SD
Vaccinium elliottii Chapm. 1.3 0.0 1.5 0.7
Acer saccharum Marshall 1.3 0.0 1.3 0.4
Acer saccharum Marshall 1.3 0.0 1.3 0.4
Magnolia virginiana L. a 0.6 0.0 2.5 0.0
Magnolia virginiana L. a 0.6 0.0 2.5 0.0
Ilex vomitoria Aiton 0.6 0.0 2.0 0.0
Ilex vomitoria Aiton 0.6 0.0 2.0 0.0
Asimina parviflora Michx. Dunal b 0.6 0.0 1.6 0.0
Asimina parviflora bMichx. Dunal b 0.6 0.0 1.6 0.0
Aesculus pavia L. 0.6 0.0 1.5 0.0
QuercusAesculus
rubra L.pavia L.
b
0.6 0.6 0.0 0.0 1.3 1.5 0.0 0.0
Quercus
Aralia spinosa L. rubra
b L. 0.6 0.6 0.0 0.0 1.2 1.3 0.0 0.0
Aralia
Castanea Pumila spinosa
(L.) Mill. L.
a b 0.6 0.6 0.0 0.0 1.2 1.2 0.0 0.0
Castanea Pumila
Ilex opaca Aiton a (L.) Mill. a
0.6 0.6 0.0 0.0 1.2 1.2 0.0 0.0
Ilex opaca Aiton
Hamamelis virginiana L. b
a
0.6 0.6 0.0 0.0 1.1 1.2 0.0 0.0
Hamamelis
TOTAL virginiana L.
b
5119.4 0.6 100.0 0.0 – 1.1 – 0.0
TOTAL 5119.4 100.0 – –
Figure 2. Mean
Figure height
2. Mean height(m)
(m)ofofsaplings
saplings(live,
(live,woody
woodystems
stemsForests 2021, 12, 1051 9 of 15
species on height growth, notably the significantly greater height of L. styraciflua, P. taeda,
and P. palustris and the shorter height of shrub species.
3.3. Stand Successional Trajectory
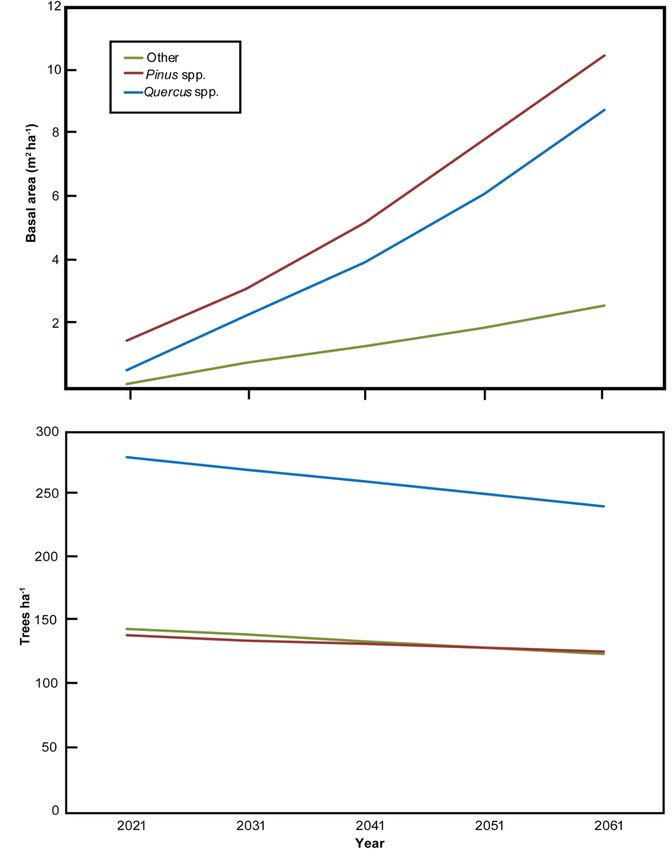
The FVS projected basal area of 21.9 m2 ha−1 and tree density of 494 stems ha−1 in
the year 2061 (stand age 50). Basal area steadily increased in increments of 4–6 m2 ha−1
every 10 years (Figure 4). Tree density increased between 2021 and 2031, followed by an
incremental decrease in stems ha−1 between 2031 and 2061 of ca. 18 stems ha−1 . When
species were placed into taxonomic groups, Pinus spp. had the greatest projected basal area
(10.5 m2 ha−1 ) in 2061, which accounted for nearly half of the basal area (48%). Quercus spp.
had a projected basal area of 8.78 m2 ha−1 (40%) in 2061 and all other individuals had a
combined basal area of 2.62 m2 ha−1 . Quercus spp. were projected to be the most abundant
species (ca. 50%), followed by Pinus spp. and other species (ca. 25% each). Species
Forests 2021, 12, x FOR PEER REVIEW 9 oflevel
15
projections indicated that P. taeda will be the most dominant species in 2061 (5.12 m2 ha−1 ),
followed by P. palustris (4.67 m2 ha−1 ) and Q. falcata (3.12 m2 ha−1 ). No other species was
projected
importance to have a basal
of species onarea m2 ha−notably
>1.5growth,
height
1 in 2061. Notably, P. palustris relative density
the significantly greater height of L.
and dominance
styraciflua, were
P. taeda, projected
and at stand
P. palustris ageshorter
and the 50 years to beof14%
height and
shrub 21%, respectively.
species.
Figure
Figure3.3.Importance
Importanceranking
rankingfor
forthe
theinfluence
influenceof
of species
species and
and biophysical site conditions
biophysical site conditionson
onsapling
saplingheight.
height.CWD
CWDisiscoarse
coarse
woody
woody debris. BEERS
debris. BEERSis transformed
is transformedaspect. The
aspect. percent
The increase
percent in mean
increase square
in mean error
square (MSE)
error is the
(MSE) increase
is the in model
increase error
in model
errorthe
when when the predictor
predictor variablevariable was randomly
was randomly permuted.
permuted.
3.3. Stand Successional Trajectory
The FVS projected basal area of 21.9 m2 ha−1 and tree density of 494 stems ha−1 in the
year 2061 (stand age 50). Basal area steadily increased in increments of 4–6 m2 ha−1 every
10 years (Figure 4). Tree density increased between 2021 and 2031, followed by an incre-
mental decrease in stems ha−1 between 2031 and 2061 of ca. 18 stems ha−1. When species
were placed into taxonomic groups, Pinus spp. had the greatest projected basal area (10.5
m2 ha−1) in 2061, which accounted for nearly half of the basal area (48%). Quercus spp. had
a projected basal area of 8.78 m2 ha−1 (40%) in 2061 and all other individuals had a com-
bined basal area of 2.62 m2 ha−1. Quercus spp. were projected to be the most abundant
species (ca. 50%), followed by Pinus spp. and other species (ca. 25% each). Species level
projections indicated that P. taeda will be the most dominant species in 2061 (5.12 m2 ha−1),
followed by P. palustris (4.67 m2 ha−1) and Q. falcata (3.12 m2 ha−1). No other species was
projected to have a basal area > 1.5 m2 ha−1 in 2061. Notably, P. palustris relative density
and dominance were projected at stand age 50 years to be 14% and 21%, respectively.Forests2021,
Forests 12,x1051
2021,12, FOR PEER REVIEW 1010ofof15
15
Figure
Figure4.4.Forest
ForestVegetation
Vegetation Simulator (FVS) model
Simulator (FVS) model projection
projectionof
oftree
treebasal
basalarea
area(m
(m2 2ha
ha−−11)) and
and density
density (stems ha−
(stems ha
−1) of Pinus
1 ) of Pinus
spp. (red), Quercus spp. (blue) and other spp. (green) from 2021 to 2061 (stand age 50 years) in a catastrophically disturbed
spp. (red), Quercus spp. (blue) and other spp. (green) from 2021 to 2061 (stand age 50 years) in a catastrophically disturbed
Pinus palustris woodland on the Oakmulgee Ranger District, Talladega National Forest, Alabama, USA.
Pinus palustris woodland on the Oakmulgee Ranger District, Talladega National Forest, Alabama, USA.
4. Discussion
4. Discussion
4.1. Current Stand Conditions
4.1. Current Stand Conditions
The basal area at stand age 10 was relatively high. We estimate that residual stems
The basal area at stand age 10 was relatively high. We estimate that residual stems
that survived the wind disturbance comprised ca. 24% of the total basal area on the wind-
that survived the wind disturbance comprised ca. 24% of the total basal area on the
disturbed plots. Although we cannot be certain which stems established before the dis-
wind-disturbed plots. Although we cannot be certain which stems established before the
turbance, we hypothesize
disturbance, we hypothesizemost, and and
most, perhaps all, stems
perhaps ≥ 12.5
all, stems cm dbh
≥12.5 were
cm dbh residuals
were or
residuals
living biological legacies. Although few large residual stems (e.g., stems > 30 cm dbh) oc-
curred on our wind-disturbed plots, those that did exist were all either Pinus and xericForests 2021, 12, 1051 11 of 15
or living biological legacies. Although few large residual stems (e.g., stems >30 cm dbh)
occurred on our wind-disturbed plots, those that did exist were all either Pinus and xeric
Quercus spp. Of the trees in smaller diameter classes (i.e.,Forests 2021, 12, 1051 12 of 15
the basal area of other fire-maintained P. palustris woodlands on the Oakmulgee Ranger
District. Thus, at stand age 50 years, the basal area was projected to be within an acceptable
range for fire-maintained P. palustris woodlands in the Alabama Fall Line Hills. However,
the canopy species composition was not projected to remain P. palustris dominant. The
FVS model projects this will be a mixedwood stand under the current disturbance regime
without other active management. The FVS model projects P. palustris relative dominance
to be just 21% at stand age 50 years. Stand composition at that time is projected to have a
strong component of Quercus species (40% relative dominance) and P. taeda (26% relative
dominance). However, we acknowledge that plot-level data were aggregated and analyzed
in our study. Based on our plot data and field observations, we hypothesize that some
neighborhoods will be P. palustris dominant, some will be P. taeda dominant, and some
will support relatively equal mixtures of Pinus and Quercus taxa. We attribute the patchy
nature of neighborhood composition within the broader stand to biological legacies, patchy
fire behavior that resulted from the loss of Pinus litter production from canopy trees, and
inherent microsite variability [50].
The FVS model did not project, and our field data do not indicate that prescribed fires
will be sufficient by themselves to inhibit recruitment of P. taeda or Quercus species. We
suspect that by stand age 10 years, some stems from these taxa have reached sufficient size
to survive low-intensity prescribed fires [56,57]. However, we documented a high density
of P. taeda and Quercus spp. in the sapling layer that are still likely susceptible to prescribed
fire induced plant or shoot mortality. Although P. palustris is not projected to dominate this
stand under the current disturbance regime, stochastic events (e.g., severe droughts) may
result in mortality of co-occurring tree species. Regardless, silvicultural treatments will
be required to supplement the prescribed fire program to promote P. palustris dominance
on this site as existed prior to catastrophic wind disturbance. If the FVS projection was
correct, P. taeda and Quercus stems will need to be chemically or mechanically removed
from neighborhoods within the stand that lack P. palustris dominance. These silvicultural
treatments are commonly required to create and maintain P. palustris woodlands in the
Alabama Fall Line Hills.
5. Conclusions
A decade after catastrophic wind disturbance, the fire-maintained P. palustris wood-
land studied here was not projected by the simulation model to return to pre-disturbance
conditions. Prior to the wind disturbance event, the stand was dominated by P. palustris.
The simulation model projected that at age 50 years, the stand would be dominated by
mixed Quercus spp., P. taeda, and P. palustris (i.e., mixedwood). The projected succes-
sional pathway is likely a function of residual stems that survived the catastrophic wind
disturbance and modification of vegetation-fuels-fire feedbacks (i.e., biological legacies).
Some woody stems have likely crossed size thresholds so that they are not susceptible
to mortality from frequent prescribed fire. Although the stand was projected to be com-
positionally dissimilar from the pre-disturbance condition under the current disturbance
regime (i.e., prescribed fire on a 2–4 year rotation), we contend that the fire-maintained P.
palustris woodland may in fact be considered resilient to the catastrophic wind event. With
additional silvicultural treatments, such as thinning of undesirable species, composition
and stand structure could be moved toward pre-disturbance conditions. Silvicultural
interventions were required in this and all other P. palustris woodlands in the Alabama Fall
Line Hills that are compositionally, structurally, and functionally desirable by managers.
So, although this stand will almost certainly require silvicultural intervention to return to
pre-disturbance conditions, that should not be surprising given that those interventions are
always required in this region to create and maintain P. palustris woodlands. In other words,
routine silvicultural entries may be considered part of the initial system properties in which
this ecosystem is recovering towards [58]. As forest ecosystem resilience transitions from
theory to practice, we should acknowledge the role of silviculture and the treatments that
were required prior to disturbance to create desired stand conditions. If a similar seriesForests 2021, 12, 1051 13 of 15
of treatments post-disturbance will result in pre-disturbance composition, structure, and
function, then the ecosystem should be considered resilient.
Author Contributions: J.S.K. and J.L.H. conceived and designed the study; J.S.K. completed field
data collection; J.D.G. completed data analysis; J.D.G., J.S.K. and J.L.H. wrote the paper. All authors
have read and agreed to the submitted version of the manuscript.
Funding: This research received funding from U.S. National Science Foundation award number 2015466.
Data Availability Statement: Data are available from the corresponding author upon reasonable request.
Acknowledgments: We thank the USDA Forest Service, Talladega National Forest, Oakmulgee
Ranger District for logistical support and Alaina Makowski, Anuska Narayanan, and Kate Pitts for
assistance with field data collection and Rosemary Smyth for laboratory assistance.
Conflicts of Interest: The authors declare no conflict of interest.
References
1. White, P.S.; Jentsch, A. The search for generality in studies of disturbance and ecosystem dynamics. Prog. Bot. 2001, 62, 399–450.
2. Oliver, C.D.; Larson, B.C. Forest Stand Dynamics; John Wiley and sons: Hoboken, NJ, USA, 1996.
3. Foster, D.R.; Knight, D.H.; Franklin, J.F. Landscape patterns and legacies resulting from large, infrequent forest disturbances.
Ecosystems 1998, 1, 497–510. [CrossRef]
4. Webster, C.R.; Dickinson, Y.L.; Burton, J.I.; Frelich, L.E.; Jenkins, M.A.; Kern, C.C.; Raymond, P.; Saunders, M.R.; Walters, M.B.;
Willis, J.L. Promoting and maintaining diversity in contemporary hardwood forests: Confronting contemporary drivers of change
and the loss of ecological memory. For. Ecol. Manag. 2018, 421, 98–108. [CrossRef]
5. Johnstone, J.F.; Allen, C.D.; Franklin, J.F.; Frelich, L.E.; Harvey, B.J.; Higuera, P.E.; Mack, M.C.; Meentemeyer, R.K.; Metz, M.R.;
Perry, G.L.; et al. Changing disturbance regimes, ecological memory, and forest resilience. Front. Ecol. Environ. 2016, 14, 369–378.
[CrossRef]
6. Franklin, J.F.; Lindenmayer, D.; MacMahon, J.A.; McKee, A.; Magnuson, J.; Perry, D.A.; Waide, R.; Foster, D. Threads of continuity.
Conserv. Biol. 2000, 1, 8–16. [CrossRef]
7. Palik, B.J.; D’Amato, A.W.; Franklin, J.F.; Johnson, K.N. Ecological Silviculture: Foundations and Applications; Waveland Press: Long
Grove, IL, USA, 2020.
8. Holling, C.S. Resilience and stability of ecological systems. Annu. Rev. Ecol. Syst. 1973, 4, 1–23. [CrossRef]
9. Angeler, D.G.; Allen, C.R. Quantifying resilience. J. Appl. Ecol. 2016, 53, 617–624. [CrossRef]
10. Myers, R.K.; van Lear, D.H. Hurricane-fire interactions in coastal forests of the south: A review and hypothesis. For. Ecol. Manag.
1998, 103, 265–276. [CrossRef]
11. Busing, R.T.; White, R.D.; Harmon, M.E.; White, P.S. Hurricane disturbance in a temperate deciduous forest: Patch dynamics, tree
mortality, and coarse woody detritus. In Forest Ecology; Springer: Dordrecht, The Netherlands, 2008; pp. 351–363.
12. Cannon, J.B.; O’Brien, J.J.; Loudermilk, E.L.; Dickinson, M.B.; Peterson, C.J. The influence of experimental wind disturbance on
forest fuels and fire characteristics. For. Ecol. Manag. 2014, 330, 294–303. [CrossRef]
13. Mitchell, R.J.; Hiers, J.K.; O’Brien, J.; Starr, G. Ecological forestry in the Southeast: Understanding the ecology of fuels. J. For. 2009,
107, 391–397.
14. Tepley, A.J.; Thomann, E.; Veblen, T.T.; Perry, G.L.; Holz, A.; Paritsis, J.; Anderson-Teixeira, K.J. Influences of fire–vegetation
feedbacks and post-fire recovery rates on forest landscape vulnerability to altered fire regimes. J. Ecol. 2018, 106, 1925–1940.
[CrossRef]
15. Holzmueller, E.J.; Jose, S. Response of the invasive grass Imperata cylindrica to disturbance in the southeastern forests, USA.
Forests 2012, 3, 853–863. [CrossRef]
16. Cannon, J.B.; Peterson, C.J.; O’Brien, J.J.; Brewer, J.S. A review and classification of interactions between forest disturbance from
wind and fire. For. Ecol. Manag. 2017, 406, 381–390. [CrossRef]
17. Emery, R.K.; Kleinman, J.S.; Goode, J.D.; Hart, J.L. Effects of catastrophic wind disturbance, salvage logging, and prescribed fire
on fuel loading and composition in a Pinus palustris woodland. For. Ecol. Manag. 2020, 478, 118515. [CrossRef]
18. O’Brien, J.J.; Hiers, J.K.; Callaham, M.A., Jr.; Mitchell, R.J.; Jack, S. Interactions among overstory structure, seedling life history
traits and fire in frequently burned neotropical pine forests. Ambio 2008, 37, 542–547. [CrossRef]
19. Gensini, V.A.; Brooks, H.E. Spatial trends in United States tornado frequency. NPJ Clim. Atmos. Sci. 2018, 1, 1–5. [CrossRef]
20. Griffith, G.E.; Omernik, J.M.; Comstock, J.A.; Lawrence, S.; Martin, G.; Goddard, A.; Hulcher, V.J.; Foster, T. Ecoregions of
Alabama and Georgia, (Color Poster with Map, Descriptive Text, Summary Tables, and Photographs); U.S Geological Survey: Reston, VA,
USA, 2001.
21. Braun, E.L. Deciduous Forests of Eastern North America; The Blackburn Press: Caldwell, NJ, USA, 1950.
22. Fenneman, N.M. Physiography of Eastern United States; McGraw-Hill: New York, NY, USA, 1938.
23. Shankman, D.; Hart, J.L. The fall line: A physiographic forest-vegetation boundary. Geogr. Rev. 2007, 97, 502–519. [CrossRef]Forests 2021, 12, 1051 14 of 15
24. Kleinman, J.S.; Hart, J.L. Vascular flora of longleaf pine woodlands after wind disturbance and salvage harvesting in the Alabama
Fall Line Hills. Castanea 2018, 83, 183–195. [CrossRef]
25. Harper, R.M. Forests of Alabama Geological Survey of Alabama; Monograph 10; Wetumpka Printing Company: Wetumpka, AL,
USA, 1943.
26. Beckett, S.; Golden, M.S. Forest vegetation and vascular flora of reed brake research natural area, Alabama. Castanea 1982,
47, 368–392.
27. Cox, L.E.; Hart, J.L. Two centuries of forest compositional and structural changes in the Alabama fall line hills. Am. Midl. Nat.
2015, 174, 218–238. [CrossRef]
28. Szabo, M.W.; Osborne, W.E.; Copeland, C.W., Jr.; Neathery, T.L. Geologic Map of Alabama (1:250,000): Alabama Geological Survey
Special Map 220; Geological Survey of Alabama: Uscaloosa, AL, USA, 1988.
29. USDA NRCS (United States Department of Agriculture, Natural Resources Conservation Service). Web Soil Survey. Available
online: https://websoilsurvey.nrcs.usda.gov/ (accessed on 5 June 2021).
30. United Stated Department of Agriculture, Natural Resources Conservation Service. Soil Survey of Bibb County, Alabama; 2008.
Available online: http://soils.usda.gov/survey/printed_surveys/ (accessed on 5 June 2021).
31. Boyer, W.D.; Bledsoe, B.W. Establishment Report: Reed Brake Research Natural Area, National Forest in Alabama, Bibb County, Alabama;
USDA Forest Service Southeastern Forest Experiment Station: New Orleans, LA, USA, 1975.
32. Thornthwaite, C.W. An approach toward a rational classification of climate. Geogr. Rev. 1948, 38, 55–94. [CrossRef]
33. PRISM Climate Group. Northwest Alliance for Computational Science and Engineering. Available online: http://www.prism.
oregonstate.edu/ (accessed on 8 June 2021).
34. NWS (National Weather Service). Sawyerville-Eoline (Greene, Hale and Bibb Counties) EF-3 Tornado 27 April 2011. Available
online: https://www.weather.gov/bmx/event_04272011sawyerville (accessed on 25 April 2020).
35. Kleinman, J.S.; Ford, S.A.; Hart, J.L. Catastrophic wind and salvage harvesting effects on woodland plants. For. Ecol. Manag. 2017,
403, 112–125. [CrossRef]
36. Ford, S.A.; Kleinman, J.S.; Hart, J.L. Effects of wind disturbance and salvage harvesting on macrofungal communities in a Pinus
woodland. For. Ecol. Manag. 2018, 407, 31–46. [CrossRef]
37. Kleinman, J.S.; Goode, J.D.; Hart, J.L.; Dey, D.C. Prescribed fire effects on Pinus palustris woodland development after catastrophic
wind disturbance and salvage logging. For. Ecol. Manag. 2020, 468, 118173. [CrossRef]
38. Goode, J.D.; Kleinman, J.S.; Hart, J.L.; Bhuta, A.A. Edge influence on composition and structure of a Pinus palustris woodland
following catastrophic wind disturbance. Can. J. For. Res. 2020, 50, 332–341. [CrossRef]
39. USDA, Forest Service. Forest Inventory and Analysis National Core Field Guide, Volume 1: Field Data Collection Procedures for Phase 2
Plots; Version 7.1; 2016. Available online: https://www.nrs.fs.fed.us/fia/data-collection/field-guides/ver7.1/FG%20NRS%207.1-
Complete-Document.pdf (accessed on 6 July 2021).
40. Lemmon, P.E. A new instrument for measuring forest overstory density. J. For. 1957, 55, 667–668.
41. Breiman, L. Random forests. Mach. Learn. 2001, 45, 5–32. [CrossRef]
42. Cutler, D.R.; Edwards, T.C., Jr.; Beard, K.H.; Cutler, A.; Hess, K.T.; Gibson, J.; Lawler, J.J. Random forests for classification in
ecology. Ecology 2007, 88, 2783–2792. [CrossRef]
43. Beers, T.W.; Dress, P.E.; Wensel, L.C. Aspect transformation in site productivity research. J. For. 1966, 64, 691–692.
44. Dixon, G.E. Essential FVS: A User’s Guide to the Forest Vegetation Simulator; U.S. Department of Agriculture, F.S. Forest Management
Service Center: Fort Collins, CO, USA, 2010.
45. Scholl, E.R.; Waldrop, T.A. Photos for Estimating Fuel Loadings before and after Prescribed Burning in the Upper Coastal Plain of the
Southeast; Gen. Tech. Rep. SRS-26; U.S. Department of Agriculture, Forest Service, Southern Research Station: Asheville, NC,
USA, 1999.
46. Goode, J.D.; Brager, L.M.; Hart, J.L. Drought-induced growth response of longleaf pine in the Alabama Fall Line Hills. Southeast.
Nat. 2019, 18, 99–112. [CrossRef]
47. Wahlenberg, W.G. Longleaf Pine: Its Use, Ecology, Regeneration, Protection, Growth, and Management; Charles Lathrop Pack Forestry:
Washington, DC, USA; Forest Service, U.S. Department of Agriculture: Washington DC, USA, 1976; Volume 429.
48. Boyer, W.D. Pinus palustris Mill. longleaf pine. Silv. N. Am. 1990, 1, 405–412.
49. Kirkman, L.K.; Jack, S.B. Ecological Restoration and Management of Longleaf Pine Forests; CRC Press: Boca Raton, FL, USA, 2017.
50. Logan, A.T.; Goode, J.D.; Keellings, D.J.; Hart, J.L. Microsite influence on woody plant regeneration in a Pinus palustris woodland
following catastrophic disturbance. Forests 2020, 11, 588. [CrossRef]
51. Williamson, G.B.; Black, E.M. High temperature of forest fires under pines as a selective advantage over oaks. Nature 1981, 293,
643–644. [CrossRef]
52. Provencher, L.; Herring, B.J.; Gordon, D.R.; Rodgers, H.L.; Tanner, G.W.; Hardesty, J.L.; Brennand, L.A.; Litt, A.R. Longleaf pine
and oak responses to hardwood reduction techniques in fire-suppressed sandhills in northwest Florida. For. Ecol. Manag. 2001,
148, 63–77. [CrossRef]
53. Wang, G.G.; Pile, L.S.; Knapp, B.O.; Hu, H. Longleaf pine adaptation to fire: Is early height growth pattern critical to fire survival?
In Proceedings of the 18th Biennial Southern Silvicultural Research Conference, Knoxville, TN, USA, 2–5 March 2015; Knoxville, TN, USA
2–5 March 2015; e-Gen. Tech. Rep. SRS-212; US Department of Agriculture, Forest Service, Southern Research Station: Asheville,
NC, USA, 2016; Volume 12, pp. 214–218.Forests 2021, 12, 1051 15 of 15
54. Kabrick, J.M.; Clark, K.L.; D’Amato, A.W.; Dey, D.C.; Kenefic, L.S.; Kern, C.C.; Knapp, B.O.; Maclean, D.A.; Raymond, P.;
Waskiewicz, J.D. Managing hardwood-softwood mixtures for future forests in eastern North America: Assessing suitability to
projected climate change. J. For. 2017, 115, 190–201. [CrossRef]
55. Phillips, D.L. Stand Dynamics in a Longleaf Pine Woodland: A Spatial Analysis. Master’s Thesis, University of Alabama,
Tuscaloosa, AL, USA, 2021.
56. Dey, D.C.; Hartman, G. Returning fire to Ozark Highland forest ecosystems: Effects on advance regeneration. For. Ecol. Manag.
2005, 217, 37–53. [CrossRef]
57. Short, M.F.; Stambaugh, M.C.; Dey, D.C. Prescribed fire effects on oak woodland advance regeneration at the prairie–forest border
in Kansas, USA. Can. J. For. Res. 2019, 49, 1570–1579. [CrossRef]
58. Peters, D.P.; Lugo, A.E.; Chapin, F.S., III; Pickett, S.T.; Duniway, M.; Rocha, A.V.; Swanso, S.J.; Laney, C.; Jones, J. Cross-system
comparisons elucidate disturbance complexities and generalities. Ecosphere 2011, 2, 1–26. [CrossRef]You can also read


