Global Intelligence - 05 Q1 2018 - Data & insights for the new age of communication - Zenith Media

Page created by Duane Strickland
 
CONTINUE READING
Global Intelligence - 05 Q1 2018 - Data & insights for the new age of communication - Zenith Media
Global
Intelligence
Data & insights for the new age of communication

05
Q1 2018
Global Intelligence - 05 Q1 2018 - Data & insights for the new age of communication - Zenith Media
Global Intelligence                                               Contents
Global Intelligence is an essential briefing for marketers,
brought to you by the world’s leading advertising                 04     Leader
expenditure forecasters. Published quarterly, Global
Intelligence is a critical mix of data, insight and commentary,
fuelled by Publicis Media’s proprietary tools and authored        Adspend Forecasts
by our communications experts. Led with an overview of
the latest quarterly Advertising Expenditure Forecasts, each      06     Hot Spots
issue provides intelligence on key areas of contemporary
communication, including digital and mobile, technology           08     Q1 2018 summary
and automation, innovation, performance marketing, and
branded content.                                                  10     Q1 2018 summary by medium

                                                                  12     Market Focus - France

                                                                  Marketing Tech
                                                                  14     Innovation

                                                                  16     Digital Giants

                                                                  18     Artificial Intelligence

                                                                  Category Insights
                                                                  20     Alcohol

                                                                  22     Alcohol: Social

                                                                  Digital Channels
                                                                  24     Content

                                                                  26     Programmatic

                                                                  28     Search

                                                                  30     Shoppable content

2                                                                                                    3
Global Intelligence - 05 Q1 2018 - Data & insights for the new age of communication - Zenith Media
Global Intelligence | Leader                                                                                              Global Intelligence | Leader

    Brand growth
    through digital media
    Welcome to the fifth edition of Global Intelligence,      effectively, and it is now punching above its weight
    and the first edition of 2018.                            compared to traditional media. We have also shown
                                                              how digital marketing in a wider sense is contributing
    The principal theme of the advertising market over        to brand growth, in particular the strength of website
    the past few years has been the growth of internet        traffic and digital content, which we discuss in our
    advertising. It accounted for 38% of all expenditure      summary of advertising expenditure by medium.
    on advertising in 2017, more than any other medium,
    and up from 16% in 2010. Perhaps unsurprisingly, after    Paid advertising is only a part of the story of digital
    such phenomenal success internet advertising is now       transformation. Advertisers are ramping up their
    facing pushback from a number of industry experts         spending on technology, innovation and content, in
    who are questioning its value. However, our research      particular. In this edition we look at examples of each:
    shows there has been no retreat in the pace of digital    the changing dynamics of programmatic auctions;
    transformation. In contrast, advertisers continue to      start-ups focusing on applying artificial intelligence to
    divert budgets to internet advertising, which we          marketing; and how NBA stars are using social media to
    expect to account for 40% of adspend this year, and       promote their sport, drive the growth of their careers,
    45% in 2018.                                              and create new marketing opportunities for brands.

    This is because advertisers have learnt to use internet   We also focus on alcohol brands, which face unique
    advertising effectively. In the early years of this       challenges to their paid advertising communications.
    decade, many brands were experimenting with               So we examine the opportunities available to them for
    internet advertising activities, and as tends to happen   expanding their owned media activities, and increasing
    with experiments, many of these early campaigns           engagement through social media,
    failed. They did not reach the required audiences and
    change their opinions or behaviours effectively. But      We hope you enjoy reading this edition of Global
    as our proprietary research has shown, in 2015 and        Intelligence. Please get in touch at Jonathan.Barnard@
    2016 brands learned to use internet advertising more      zenithmedia.com with any comments or suggestions.

4                                                                                                                                                    5
Global Intelligence - 05 Q1 2018 - Data & insights for the new age of communication - Zenith Media
Adspend Forecasts | Hot Spots                                                                                                                                                                                         Adspend Forecasts | Hot Spots

 The world’s                                                                                                       3.2%
 advertising hot spots
                                                                                                                   Western & Central Europe

                                                                                                                   Austria, Belgium, Bosnia & Herzegovina,
                                                                                                                   Croatia, Czech Republic, Denmark,
                                                                                                                                                                           8.8%
                                                                                                                                                                           Eastern Europe
                                                                                                                   Finland, France, Germany, Greece,                       & Central Asia
 Average annual growth in adspend by regional bloc 2017-2020                                                       Hungary, Ireland, Italy, Netherlands,
                                                                                                                   Norway, Poland, Portugal, Romania,                      Armenia, Azerbaijan, Belarus, Bulgaria,
-2%                                           4%                                                          10%      Serbia, Slovakia, Slovenia, Spain,                      Estonia, Georgia, Kazakhstan, Latvia,
                                                                                                                   Sweden, Switzerland, UK                                 Lithuania, Moldova, Russia, Turkey,
                                                                                                                                                                           Ukraine, Uzbekistan

                                                               3.2%
                                                               North America

                                                               Canada, USA
                                                                                                                                                                                                                     2.1%
                                                                                                                                                                                                                     Japan

                                                                                                                                                             7.4%
                                                                                                                                                             Fast-track Asia

                                                                                                                                                             China, India, Indonesia,
                                                                                                                                                             Malaysia, Pakistan, Philippines,
                                                                                                                                                             Taiwan, Thailand, Vietnam

                                                                             5.1%                                        -1.3%
                                                                             Latin America

                                                                             Argentina, Brazil, Chile, Colombia,
                                                                             Costa Rica, Ecuador, El Salvador,
                                                                                                                         Middle East
                                                                                                                         & North Africa
                                                                                                                                                                                                        3.8%
                                                                                                                                                                                                        Advanced Asia
                                                                             Mexico, Panama, Peru, Puerto                Bahrain, Egypt, Israel, Kuwait,
                                                                             Rico, Uruguay, Venezuela                    Oman, Qatar, Saudi Arabia, UAE                                                 Australia, Hong Kong,
                                                                                                                                                                                                        New Zealand, Singapore, South Korea

 6                                                                                                                                                                                                                                                 7
Global Intelligence - 05 Q1 2018 - Data & insights for the new age of communication - Zenith Media
Adspend Forecasts | Q1 2018 summary                                                                                                                                                       Adspend Forecasts | Q1 2018 summary

Global advertising confidence                                                                                                       Ten fastest
rises rapidly                                                                                                                       growing markets
Confidence in the global ad market is currently improving rapidly. We now forecast global adspend
to rise 4.6% this year, up from our 4.1% forecast in December.
                                                                                                                                    The ten biggest ad markets                      Growth in ad dollars

Over the past three months we have upgraded our forecasts       The Philippines and Ireland are also bright spots for ad
for global growth by 0.5 percentage points, thanks in           market growth. The Philippines beat our expectations with           Ad expenditure (US$m)                           (US$m 2017-2020)
particular to improved economic growth in China and             28% growth last year, and we have doubled our forecasts
Argentina. Such a large revision to our forecasts is unusual;   for this year from 11% to 22%. And new estimates of the true        2017                                   2020
the last time we revised them upwards by so much was            scale of digital activity in Ireland has boosted our forecasts of
back in March 2011. We now expect the global ad market to       Irish market growth from just 1% to 7% in 2018.

                                                                                                                                                            1
reach US$578bn in 2018.

                                                                                                                                                                                                                   19,701
                                                                                                                                        USA                      ‹        USA
                                                                                                                                        197,474                           217,175
Our global forecasts for 2019 and 2020 are also above the       Growth of advertising expenditure and GDP
forecasts we made three months ago, though not by so            2018-2020 (%)

                                                                                                                                                            2
                                                                                                                                                                                                                USA
much. We forecast 4.4% growth in 2019 and 4.3% growth in
                                                                2018
                                                                                                                                        China                    ‹      China
2020, both forecasts being up by 0.2 percentage points.                                                                                 80,440                            97,355

                                                                                                                                                                                    16,914
                                                                                                                           + 5.5
China’s economy has surprised analysts with particularly
strong growth in early 2018, with industrial production and
infrastructure spending beating expectations. Investment in
manufacturing has picked up, and business confidence has
                                                                                                                 + 4.6                  Japan
                                                                                                                                        42,972              3    ‹      Japan
                                                                                                                                                                          45,691
                                                                                                                                                                                                    China
increased. We now expect adspend to grow 8% this year,          2019
up from our 6% forecast in December. China is the world’s
second biggest ad market, accounting for 15% of global
                                                                                                                            + 5.6
                                                                                                                                        UK
                                                                                                                                        24,442              4    ‹
                                                                                                                                                                              UK
                                                                                                                                                                          27,259

                                                                                                                                                                                                               3,014
adspend, so an upgrade here has a big effect on the global                                                     + 4.4

                                                                                                                                                            5
total. A notable development here is that television has
                                                                                                                                        Germany                        Germany
fought back against strong competition from online video
                                                                                                                                        22,077                   ‹       23,498
and is no longer losing adspend, which it did in 2014, 2015     2020                                                                                                                                             Indonesia
and 2017. We expect 1% growth in television adspend in                                                                      + 5.6

                                                                                                                                                            6
China this year, alongside 13% growth in online advertising.                                                                            Brazil                             Brazil
                                                                                                                                                                 ‹
Argentina has recovered from its 2016 recession more rapidly
                                                                                                              + 4.3                     13,243                             15,185
                                                                                                                                                                                                2,951
than expected. GDP grew 2.8% in 2017, beating the IMF’s

                                                                                                                                                            7
forecast of 2.5% growth, fuelled by construction, agriculture        GDP                                                                South Korea                  South Korea                       India
and foreign investment. We now forecast that adspend will                                                                               11,812                   ‹         13,351
                                                                                                                                                                                                                        1,538
                                                                     Adspend                                                                                                                                      South Korea
grow 1% in Argentina this year, up from our previous forecast
of 2% decline, as consumer spending starts to rise again.

                                                                                                                                                            8
                                                                Source: Zenith/IMF
                                                                                                                                        France                          Australia
                                                                                                                                                                                        2,817                                   1,848

                                                                                                                                                                 ‹
                                                                                                                                        11,669                            12,909
                                                                                                                                                                                                                                Russia
                                                                                                                                                                                               UK
                                                                                                                                        Australia
                                                                                                                                                            9             France

                                                                                                                                                                 ‹
                                                                                                                                        11,646                            12,648                                                1,942
                                                                                                                                                                                              2,720                               Brazil
                                                                                                                                        Canada
                                                                                                                                                            10         Indonesia
                                                                                                                                                                                                               2,420

                                                                                                                                                                 ‹
                                                                                                                                        9,653                              11,776                   Japan
                                                                                                                                                                                                               Philippines
                                                                                                                                    Source: Zenith/IMF

8                                                                                                                                                                                                                                        9
Global Intelligence - 05 Q1 2018 - Data & insights for the new age of communication - Zenith Media
Adspend Forecasts | Q1 2018 summary by medium                                                                                                                                                                             Adspend Forecasts | Q1 2018 summary by medium

Advertisers focus on digital                                                                                                         Average annual growth rate by medium 2017-2020 (%)

brand experiences                                                                                                                                                                  Cinema                                                                                                             15.8

                                                                                                                                                                        Internet display                                                                                      12.7
Amid growing industry speculation about cuts to digital advertising budgets, we have found no
                                                                                                                                                                               Paid search                                                                  8.2
evidence that advertisers as a whole are shifting budgets away from online advertising – in fact, its
share of global advertising expenditure continues to rise rapidly.                                                                                                    Internet classified                                                           7.4

We forecast that advertisers will spend 40.2% of their            We have also seen clear correlations between brands with                                                       Outdoor                      2.7
budgets on online advertising in 2018, up from 37.6% in           high capabilities in marketing and media, and categories in
2017. This growth in spend is part of the wider process of        which digital channels have high influence on the consumer                                                    Television             1.2
digital transformation, as advertisers invest in technology,      journey. This suggests a positive reinforcement between the
data and innovation to revolutionise their relationships with     recognition of the digitisation of consumer behaviour and                                                             Radio         1.1
consumers.                                                        the positive transformation of marketing organisations.
                                                                                                                                                  -4.7                                          Newspapers
The concerns of global advertisers about the effectiveness        Globally, advertisers continue to increase the share of their
of some digital media investments and the safety of the           budgets allocated to paid digital channels. Online advertising     -5.8                                                       Magazines
digital environment have been widely reported. However,           grew by 13.7% in 2017 to US$204bn. It accounted for 37.6%
a number of Zenith’s global research projects link brand          of global advertising expenditure in 2017, up from 34.3% in
experience impact and brand growth to progressive use of          2016. This year we expect online advertising’s market share
digital throughout the consumer journey.                          to exceed 40% globally for the first time, reaching 40.2%.
                                                                  In 2017 online advertising already accounted for more than
New research from Zenith demonstrates the value of                55% of adspend in three markets (China, Sweden and the
investing in transformational digital marketing. We created       UK), so there is plenty of potential for further growth. By 2020
a standard index of brand growth, comparing results from          we expect online advertising to account for 44.6% of global        Share of global adspend by medium (%)
prominent studies and matching brand performance with             adspend.
a series of communications and media benchmarks. Initial
findings indicate that the fastest growing brands within          Of course the rise in online advertising tells only part of the
                                                                                                                                                                               Cinema                                                                               Cinema
categories such as communications, financial services and         story of digital transformation. Rapid as the rise of online                                         Radio                                                                                Radio
automotive tend to perform strongly on measures such as           adspend has been, the rise of advertising tech has been                                  Outdoor      6.2
                                                                                                                                                                                 0.7                                                              Outdoor    5.7
                                                                                                                                                                                                                                                                      1.0
                                                                                                                                                                                                                                                                                         Television
share of category search and website traffic; along with          much faster. Zenith tracked the revenues of 14 listed ad tech                                                                                                                     6.4
                                                                                                                                                                6.7                                          Television
effective content marketing and strong performance in             companies between 2010 and 2016, and found that their                                                                                                              Magazines                                              31.2
                                                                                                                                              Magazines                                                        34.1
earned digital media. For automotive brands, for example,         revenues grew five times faster than online revenues over                                                                                                                3.8
                                                                                                                                                   5.2
there’s an 89% correlation between their ability to rise up the   this time. Companies have also invested heavily in innovation
                                                                                                                                                                                                                              Newspapers
index and the traffic to their websites. For financial services   – since 2010, companies in the OECD have increased their
                                                                                                                                                                                                                                     7.3
brands, rising up the index has a 71% correlation with the        investment in research and development three times faster           Newspapers

popularity of their owned content, and for communications         than they have increased their adspend.                                   9.5
                                                                                                                                                                                                                            Internet
                                                                                                                                                                                                                           classified
brands it has an 81% correlation with how much of their                                                                                                                                                                       3.8
                                                                                                                                      Internet
revenue they spend on advertising.                                                                                                   classified
                                                                                                                                        3.4

                                                                                                                                                                                                                                    Paid search

                                                                                                                                                    Paid search                                                                         17.9
                                                                                                                                                                                                  Internet                                                                    Internet
                                                                                                                                                         16.0                                      display                                                                     display

                                                                                                                                                                                                    18.2                                                                       23.0

                                                                                                                                                                                   2017                                                                                2020

10                                                                                                                                                                                                                                                                                                      11
Global Intelligence - 05 Q1 2018 - Data & insights for the new age of communication - Zenith Media
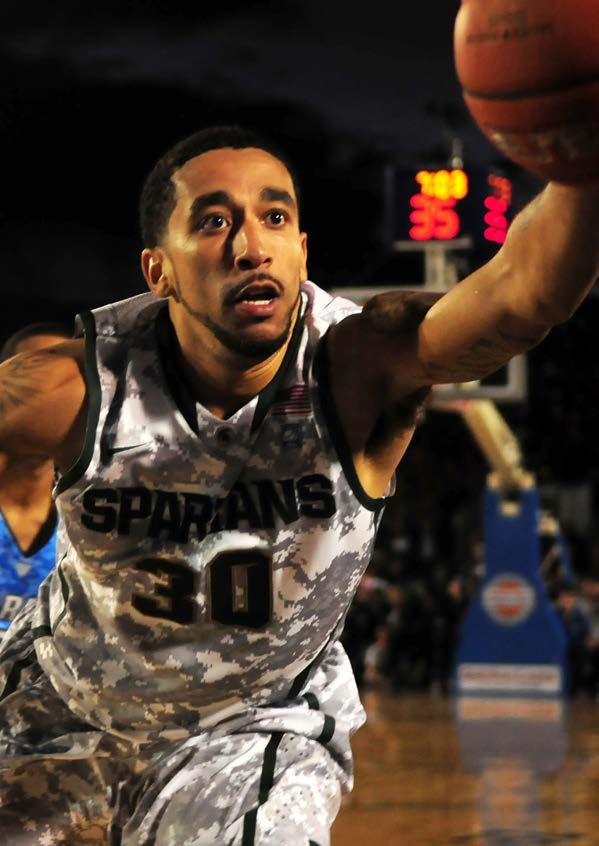
Adspend Forecasts | Market Focus – France                                                                                                                                                                       Adspend Forecasts | Market Focus – France

                                                                                                                                     Adspend in France
                                                                                                                                     Year-on-year change at current prices (%)

                                                                                                                                                                                                                       2.7                              2.7       2.7
                                                                                                                                                                                            2.5

                                                                                                                                                                                 1.7

Adspend in France
                                                                                                                                                      0.5
France is the eighth-largest ad market in the world, and the third-largest in Europe. It struggled
during the eurozone crisis in the first half of the decade but growth is now picking up, led by internet
advertising – particularly video, mobile display and mobile search.

French manufacturing held up in the second half of 2017, with     growth in 2019 and 9.3% growth in 2020. Growth will be led
a strong performance by the aerospace industry. Household         by video (which will grow at an annual average rate of 23.0%                2015 v 2014                 2016 v 2015   2017 v 2016             2018 v 2017                     2019 v 2018   2020 v 2019
consumption picked up thanks to spending on textiles and          a year between 2017 and 2020), mobile display (which will
household equipment. Both public and private investment           grow at 25.6%) and mobile search (18.3%).
growth held steady. However, exports slowed while imports                                                                            Share of adspend by medium (%)
jumped markedly. The IMF estimates that GDP grew 1.6% in          Television will benefit somewhat from new legislation
2017, up from 1.2% in 2016, and forecasts 1.8% growth for 2018.   allowing broadcasters to show products for sponsorship. But
These positive signs herald a healthier environment for the       the migration of budgets to online video has caused us to
French ad market than it faced in the first half of the decade,   revise our forecasts for television growth downwards. We
when adspend remained essentially stagnant.                       now expect the television market to be flat this year, shrink
                                                                                                                                                                                                                                               Cinema
                                                                  0.5% next year and shrink 1.0% in 2020. The government is still                           Outdoor/
                                                                                                                                                                        Cinema                                                   Outdoor/
                                                                                                                                                                                                                                 transport
We revised our adspend forecasts upwards in September             consulting about plans to allow currently banned categories                               transport    0.9
                                                                                                                                                                                                                                                0.9
                                                                                                                                                                                                                                        10.4
thanks to increased confidence in digital and improvement         such as films, retail promotions and literary publishing to                                  11.1
                                                                                                                                                                                             Internet                                                              Internet
                                                                                                                                                                                                                     Magazines
in the economic environment. We now think that 2017               advertise on television, and to authorise addressable television                                                            35.6                                                                  43.8

ended up slightly ahead of our December forecast, with            advertising. The former could boost television adspend by               Magazines                                                                     6.4

2.5% growth rather than our forecast 2.0%. But the continued      €150 million to €200 million a year, but faces strong opposition              8.6
                                                                                                                                                                                                        Newspapers
weakness of traditional media has led us to downgrade our         from other media. Addressable television is less controversial
                                                                                                                                                                                                               4.7
longer-term forecasts, despite the continued strength of          but is not expected to launch until 2020-2021 at the earliest.
                                                                                                                                     Newspapers
internet advertising. We now forecast annual growth rates of                                                                                                                                            Radio
2.7% every year to 2020, compared to our previous forecasts       Radio continues to shrink as advertisers shift budgets to             6.2                              Total                                                                 Total
                                                                                                                                                                                                         5.6
of 2.7% growth in 2018, 3.0% in 2019 and 3.2% in 2020.            online audio platforms.                                                                                US$11.7bn                                                             US$12.6bn
                                                                                                                                       Radio
The football World Cup will boost adspend this year, as will      Outdoor is growing slowly, thanks to contractors’ investment          6.5
the Euro football championship and Summer Olympics in             in digital outdoor displays.
2020.
                                                                  Newspapers and magazines will continue to shrink by 7%-8%
Internet advertising grew faster than expected in 2017, by        a year, while cinema will grow by 3% a year.
13.0% instead of our previous estimate of 10.6%. Search, video                                                                                                TV                                                                 TV

and affiliates advertising were all well ahead of expectations,   The internet overtook television to become the largest                                      31.0                                                               28.2

with only traditional display disappointing. We don’t think       advertising medium in France in 2016. By 2020 we expect
internet advertising will be able to maintain this pace of        internet advertising to account for 43.8% of total ad                                                        2017                                                                2020
growth, however, and forecast 10.9% growth in 2017, 10.1%         expenditure, compared to television’s 28.2%.

12                                                                                                                                                                                                                                                                            13
Global Intelligence - 05 Q1 2018 - Data & insights for the new age of communication - Zenith Media
Marketing Tech | Innovation                                                                                                                                                                                                                                 Marketing Tech | Innovation

Start-up watch                                                                                                                                                   Snapchat – a year after its IPO
This time on start-up watch, we look at four exciting start-ups that are harnessing the power of                                                                 Snapchat has celebrated its first anniversary as a public company. How is it performing, for
artificial intelligence for brands.                                                                                                                              investors, users and brands?

     Spectrm                                                                                         Facenote
                                                                                                                                                                     Like any publicly listed company, Snapchat has faced          Wall Street expected and finally covering basic
                                                                                                                                                                     deep scrutiny of its business performance, and                costs. Snapchat’s ad buying model has also evolved

     M    essenger apps are becoming the favourite way
          to communicate remotely for more and more
     people, especially the young. But brands need to be
                                                                                                    P   ersonalisation is big business online, where it allows
                                                                                                        brands to use data to maximise the value of their
                                                                                                     transactions. It is tough for offline stores to do the
                                                                                                                                                                     investors have been evaluating its ability to be a viable
                                                                                                                                                                     advertising alternative to the existing giants (Facebook,
                                                                                                                                                                     Google and Amazon). It has also been vulnerable
                                                                                                                                                                                                                                   in 2017 to an automated bidding process for selling
                                                                                                                                                                                                                                   ads, making it easier for more marketers to buy ads.
                                                                                                                                                                                                                                   Snapchat says that the number of its advertisers has
     able to conduct true conversations if they are to use                                           same. Facenote offers a facial recognition technology           to market fluctuations driven by events outside of            more than tripled. One notable recent campaign was
     them to engage with consumers. Spectrm is a team of                                             that allows stores to recognise their repeat customers,         its control. When reality TV star Kylie Jenner recently       Nike’s release of a pair of new Air Jordan sneakers on
     experts in conversational AI, who develop messenger                                             allowing them to tailor their products and services to          claimed she was over Snapchat, it wiped more than a           Snapchat that sold out in 23 minutes, according to
     apps and build bots tailored to deliver content and                                             individual preferences, and offer rewards to their most         billion US dollars off Snapchat’s market capitalisation. It   TechCrunch. This move into e-commerce opens up
     brand engagement.                                                                               valuable customers.                                             shows how companies like Snapchat are very sensitive          a world of interesting opportunities for advertisers.
                                                                                                                                                                     to the impact of large-scale influencers and have a           It will also be interesting to see how Snapchat’s
                                                                                                                                                                     complicated value eco-system where their value is             Spectacles evolve in 2018. While critics have been
     Opearlo                                                                                         Formisimo                                                       derived not only from their ability to deliver a quality      very forthcoming with reasons why it’s not a proven
                                                                                                                                                                     experience to their users and advertisers, but also from      business model, Spectacles have undeniably had
                                                                                                                                                                     a community of culturally relevant influencers.               more success in user penetration and product

     V   oice is the fastest-growing way in which people
         interact with their devices and online services.
     Opearlo is a voice interaction agency, which makes
                                                                                                     W       eb forms and online checkouts can be difficult
                                                                                                             and frustrating to use. Many potential customers
                                                                                                     start the checkout process but give up before they
                                                                                                                                                                     Like its social media competitors, Snapchat is not
                                                                                                                                                                     standing still. It has rolled out a redesigned app
                                                                                                                                                                                                                                   experience than Google Glass, for example.

                                                                                                                                                                                                                                   Finally, Snapchat has been a victim of its own success,
     products, services and content accessible by voice,                                             complete it. Formisimo offers a machine-learning                interface over the past few months to attract                 with its large competitors responding to Snapchat’s
     through Amazon Alexa, Google Home and Microsoft                                                 method to increase conversions on forms and                     new users and make it easier to use in general.               innovations by essentially copying them. Facebook has
     Cortana.                                                                                        checkouts, automatically, using self-learning actions to        As expected, this redesign was not greeted with               rolled out versions of Stories in Instagram, WhatsApp,
                                                                                                     rescue sales that would otherwise be lost.                      enthusiasm from all existing users. However,                  Facebook Messenger and its own main app. Google
                                                                                                                                                                     Snapchat’s download rates have remained strong                is launching its own version of Stories. And Twitter has
                                                                                                                                                                     and the number of daily active users has continued to         introduced advertising sponsorships of its own visually
                                                                                                                                                                     grow, and is approaching 200 million.                         rich format, Moments.

                                                                                                                                                                     Snapchat’s advertising eco-system is also looking             But, if it can continue to innovate, Snapchat should
                                                                                                                                                                     up, with advertising revenue increasing faster than           have a bright future.

Facenote’s facial recognition software identifies customers in real time, allowing stores to personalise their shopping experience.

14                                                                                                                                                                                                                                                                                            15
Global Intelligence - 05 Q1 2018 - Data & insights for the new age of communication - Zenith Media
Marketing Tech | Digital Giants                                                                                                                                                        Marketing Tech | Digital Giants

Digital Giants                                             Q1 2018

Our round-up of the latest results from the digital
media giants that are transforming global media
and communication

           +48%                       89%                                  +43%                     -14%                       +1%                    +12%                 US$2.2bn                        1bn
         ad revenues             of ad revenues                           paid clicks           cost per click             ad revenues          active daily users              quartery            monthly unique
         year on year             from mobile                            year on year           year on year               year on year           year on year                  revenue                 users
                                                                                                                                                                                   Yahoo                     AOL

           51.2%                US$479bn                                   74.1%              US$763bn                        7.9%               US$25bn                        30.7%                     4.1%
        Global reach                   Market                           Global reach                Market                Global reach                 Market                 Global reach (all internet users)
     (all internet users)               cap                          (all internet users)            cap               (all internet users)             cap

     Facebook now has 1.4 billion daily users, almost                Mobile search and YouTube, along with strong      Twitter now has 330 million monthly users, the     Oath is the media subsidiary of Verizon, which
     all of whom access it using mobile devices for                  growth in programmatic sales, continue to         same as in the previous quarter, but up 4%         bought AOL in 2015 and Yahoo in 2017, then
     some or all the time. It has 2.1 billion monthly                fuel most of the growth in Google’s revenues      year on year. The number of daily active users     merged the two under the new name Oath.
     users around the world.                                         (as reported by Google’s holding company,         increased by 12% year on year, so existing users   Oath now consists of more than 50 online media
                                                                     Alphabet). YouTube now has 1.5 billion viewers    are accessing Twitter more frequently. Analysts    and tech brands, including Yahoo, Tumblr,
     Facebook has changed its news feed algorithm,                   per month.                                        continue to worry about the slow growth in         AOL.com, The Huffington Post, TechCrunch
     so users are more likely to see posts from their                                                                  monthly users and the lack of disclosure of        and Engadget. Verizon began integrating the
     friends and less likely to see third-party content,             Google has redesigned its mobile shopping         the absolute number of its daily users, but the    businesses as soon as the acquisition was
     and less likely to see news stories from outlets                experience, offering more product information     stabilisation of ad revenues, which grew 1% year   complete and expects to make substantial cost
     outside the mainstream. These changes caused                    and making payment easier, and integrating it     on year in Q4 after several quarters of decline,   savings over the next few years.
     the amount of time the average user spent on                    with Google Pay. It has also added new tools      will have provided some reassurance.
     Facebook to shrink 5% in Q4 2017.                               to YouTube to help brands control where their                                                        Verizon has not yet released much detail about
                                                                     ads are appearing. For publishers, Google         In Q4 Twitter introduced a new self-serve tool     Oath’s financial performance, but it has disclosed
     Facebook has been rolling out some of its more                  has introduced AdSense Auto ads, which use        to make producing Promoted Tweets easier           that its revenues grew from US$2.0bn in Q3 2017
     sophisticated ad products to small businesses.                  machine learning to improve the yield of ads by   and quicker, leading to substantial uptake         to US$2.2bn in Q4, and totalled US$6.0bn for
     These products, such as Value Optimisation                      optimising when and where they appear.            among users. Like Facebook, Twitter is actively    the year as a whole. (Yahoo did not contribute
     (which targets consumers based on Facebook’s                                                                      courting small businesses, and has introduced      any revenues before June, when the acquisition
     assessment of their likelihood to purchase                                                                        a new service for them called Twitter Promote      was complete). Oath is dwarfed by the rest of
     a produce based on past purchases), were                                                                          Mode, which automates the promotion of their       Verizon’s businesses, which generated a total of
     previously only available to big brands. Small                                                                    accounts and tweets.                               US$34bn in Q4, mostly from US telecoms.
     businesses constitute most of the 70 million
     businesses that use Facebook globally, and
     represent a large (but unknown) proportion of
     its ad revenue.

16                                                                                                                                                                                                                             17
Global Intelligence - 05 Q1 2018 - Data & insights for the new age of communication - Zenith Media
Marketing Tech | Artificial Intelligence                                                                                                Marketing Tech | Artificial Intelligence

Artificial Intelligence resolves
paradox of consumer choice
Consumers face so much choice in online shopping that they can be paralysed into indecision.
AI allows brands to personalise the choices offered to consumers, converting indecision into sales.

The digital environment provides endless aisles and                   Soon, brands should – and will – extend the concept
product variety to consumers, 24 hours a day, providing               of personalisation beyond product selection and across
an overwhelming number of options. It is no surprise that             the entire consumer experience, to maximise brand
shoppers prefer some of those choices to be eliminated for            engagement and the desired response. Successful brands
them, so they can choose between a manageable selection.              will design and execute with a customer context in mind for
In November 2017 a Demandware Report revealed that                    all touchpoints.
personalised product recommendations now drive up to
26% of e-commerce revenue.                                            Machine-learning algorithms are being used in attribution
                                                                      models to optimise every paid digital touchpoint at
Consumers like the personal touch, and recommendation                 the individual level. They ‘learn’ from historic data to
engines can play the role of digital shopping assistants.             understand what combination of touchpoints is most likely
Implementing personalisation for individual users requires            to generate a conversion. Similarly, AI techniques have
the analysis of vast amounts of data, and the ability to deploy       enabled classification of individual components in any
the results in real time. This demands a more sophisticated           piece of content; text, pictures or videos. There is a great
system than traditional fixed decision trees. This is where           opportunity to link these applications of AI together with a
Artificial Intelligence (AI) techniques – and in particular, neural   recommendation engine.
networks – offer key advances.
                                                                      An enhanced attribution capability that can model every
The most commonly known applications of AI, in this                   touchpoint at the level of each creative component can
context, are the look-a-like product recommendations based            provide greater insight into what works within the customer
on a user’s previous purchases or purchases from other users          journey. The model can be further refined by including
who bought similar items. These are used for prospecting,             additional first-party or third-party audience data and actual
retargeting, cross-sell and up-sell.                                  shopping behaviour. The combination of these machine-
                                                                      learning applications with recommendation engines can
Another set of AI techniques seek active responses from               ensure that the right content – creative and products or
users to understand their personality and match those to              services offered – appears at each stage of the journey,
products or services that they are most likely to purchase.           and that each piece of content is as effective as possible
For instance, Zenith is continuing its ground-breaking work           at producing the desired consumer response at that stage.
in AI with a machine-learning application for a global client         Such recommendation engines will retain freedom of choice
that is driving product conversions on a retail website. The          for consumers but empower brands and marketers with
AI-powered tool is a product-recommendation app that                  techniques to structure these choices for greatest relevance.
features the brand’s range of fragrances together with
competitive products. Zenith’s algorithm continually assesses         Recommendation engines are already demonstrating their
all consumer responses to a series of simple questions                ability to drive better results across KPIs (e.g. for increased
that lead to the fragrance recommendation. The algorithm              propensity to buy or higher average order values). By
determines how successful each recommendation is at                   combining these systems with the knowledge of user
converting and adjusts future recommendations accordingly.            journeys and content analysis, brands can create strategies
This means that when each consumer uses the app, it                   across paid and owned marketing efforts that are more
becomes ever more successful at driving conversions.                  effective in sending users down the path of maximizing
                                                                      returns. AI and machine-learning can help brands unlock
                                                                      opportunities for personalised experiences that drive
                                                                      positive consumer decisions.

18                                                                                                                                                                            19
Category Insights                                                                                                                                                                                                                                                            Category Insights

In focus: Alcohol

          Marketing imperatives                                    Consumers around the world spend about US$600bn on             The five biggest contributors to alcohol                                                  Owned assets with the highest influence
                                                                   alcoholic drinks each years. Six of the world’s biggest 100    brand experience                                                                          potential
     •   Alcohol brands still depend on mass-media                 advertisers, as measured by Advertising Age, are alcohol
         advertising for communicating their values to             advertisers: Anheuser-Busch InBev, Heineken, Diageo,            1,734                                                                                     8.0         7.9
                                                                                                                                                    1,571            1,548                                                                             7.3
         consumers. But the rising tide of legal restrictions      Pernod Ricard, Molson Coors Brewing and Suntory                                                                                                                                                   6.6
                                                                                                                                                                                 1,390   1,364

                                                                                                                                                                                                 Average Brand Experience
         around the world means that brands cannot rely            Holdings. The industry has struggled with weak sales

                                                                                                                                                                                                                                                                                            Influence potential
         on paid advertising indefinitely.                         in recent years, but started to pick up in 2017 as larger
                                                                                                                                                                                                                                                                              4.6
     •   Instead alcohol brands should look to influential         companies began to meet demand for high-quality craft
         but underused owned channels, so they can                 beers and premium spirits in developed markets, and for                                                                                                                                                            3.2
         continue to communicate just as effectively,              economy brands in emerging markets.
         but in ways that are not vulnerable to tougher
         advertising legislation.                                  Alcohol advertisers rely heavily on paid advertising for
                                                                   brand communication. The top six advertisers alone spent
                                                                   US$15 billion on advertising in 2016. According to our
                                                                   proprietary research, paid media is responsible for nearly           Newspaper ads by retailers                                                              In-store examples
                                                                   half of all consumer experience of alcohol brands.                   Retailer catalogues                                                                     Demonstration events
                        Based on consumer research,                                                                                     In-store sales circulars                                                                Brand stores
                        Touchpoints ROI Tracker is Publicis        We use our Touchpoints ROI Tracker tool to monitor                   Retailer customer magazines and letters                                                 Loyalty schemes
                        Media’s brand contact measurement          trends in brand communication over the full range of                 TV ads                                                                                  Brand events
                        and planning tool. Since 2004 a total      paid, owned and earned touchpoints. One of its outputs                                                                                                       Brand website
                        of 1,123 Touchpoints projects have         is Brand Experience, which measures the reported
                                                                                                                                  Source: Touchpoints ROI Tracker Global Norms                                                Source: Touchpoints ROI Tracker Global Norms
                        been completed across 66 countries,        importance of each touchpoint in shaping consumer
                        comprising 992,289 consumer                attitudes and influencing consumer behaviour. It tells us
     interviews that provide contact point metrics for 14,914      that 47% of alcohol Brand Experience comes from paid           effect: regulations are sometimes tightened, but rarely if ever                           As the chart shows, brands have the opportunity to
     brands in 330 product and service categories. The data        media, compared to 40% for owned media and just                loosened. Alcohol brands should plan for having less access                               reach potential customers more effectively through
     for all projects are stored in a single internet-accessible   13% for earned media. Two of the five touchpoints that         to paid media in the future, and potentially no access at                                 samples and live events, which have high influence
     database. This database provides normative and trend          contribute the most to Brand Experience are paid media         some point.                                                                               potential. This is a combined measure of the underuse
     data for 290 touchpoints.                                     touchpoints: newspaper ads by retailers at number one,                                                                                                   of these touchpoints (the gap between their reach
                                                                   and TV ads at number five.                                     Our Touchpoints research shows that alcohol brand owners                                  and the reach of the average touchpoint), and
     All rights to the MCA® measurement system including                                                                          are underusing some valuable owned assets that could be                                   their extra influence (how much more likely these
     CCF™, BEP™ and BES™ are owned by Integration                  However, this reliance on paid media means that                used to mitigate any loss of paid media channels. These                                   touchpoints are to influence behaviour). Most of
     (Marketing and Communications) Limited and licensed           alcohol brands’ communications plans are vulnerable to         assets have above-average influence – that is, they are more                              them are expensive at scale, though, which is why
     to Publicis Media Limited and its affiliates.                 disruption and may not be sustainable in the long term.        likely to change consumers’ beliefs and behaviours when                                   brand websites are so important. Although they have
                                                                   Governments around the world face continued calls              they encounter them. But they have below-average brand                                    less absolute influence potential, they put the brand
                                                                   for further restrictions on alcohol advertising. Lithuania     association – so consumers are less likely to encounter them.                             within the reach of everyone. Having a robust brand
                                                                   has just enforced a ban on alcohol advertising on TV,          By making them more prominent, brands can make the most                                   website with compelling content and a coherent story
                                                                   radio, print and the internet, and Australia and Ireland are   of their high ability to sway consumers.                                                  is probably the most efficient way of improving the
                                                                   debating new restrictions. Alcohol brands face a ratchet                                                                                                 effectiveness of alcohol brand communication.

20                                                                                                                                                                                                                                                                                                                21
Category Insights | Social                                                                                                                                                                                                                                                                                                                         Category Insights | Social

In focus: Alcohol
                                                                                                                                                                                    Among the top five brands, Svedka Vodka is the most                                                                   User activity for top brands
               Marketing imperatives                                                                            Socialtools is Zenith’s proprietary                                 successful at converting its fans into active users, followed
                                                                                                                social content performance tracking                                 by Jack Daniel’s and Crown Royal. Tellingly, each brand’s                                                             0.7
          •   To achieve cut-through, spirits brands should                                                     tool. Socialtools is currently tracking                             ability to encourage their fans to be active users correlates
              encourage inclusive conversations on their                                                        the daily performance of 166,000                                    with their fan growth over the last six months – an active
                                                                                                                pages across six social platforms                                                                                                                                                                                        0.6
              social media pages that preach to the                                                                                                                                 community is more attractive.                                                                                         0.6
                                                                                                                (Facebook, Twitter, YouTube,
              unconverted.                                                                    Instagram, LinkedIn and VKontakte), providing
          •   Paid posts that invite user interaction are an                                  evaluation of the effectiveness of social content                                     As mentioned, fans who aren’t recent active users are less
                                                                                                                                                                                                                                                                                                          0.5
              effective means to achieve this.                                                for brands and their competitors in 185 countries.                                    likely to see Facebook posts, so it’s difficult to encourage
                                                                                              Socialtools charts show performance trends across                                     them to join the conversation. The way around that is to
                                                                                              a wide variety of social engagement metrics. The                                      craft posts that actively encourage interaction, and pay to                                                           0.4
                                                                                              brand performance data, norms and rankings provide                                    ensure that they are viewed by a wide audience. According
Spirits brands face a common problem on social media:                                         insights into social media best practices for brands in                               to proprietary research available through Publicis Media’s
                                                                                              19 macros categories and 125 categories.                                                                                                                                                                                  0.3
while they may attract a large number of passive followers,                                                                                                                         Socialtools, Jack Daniel’s and Svedka Vodka paid to boost                                                             0.3
those who actively engage with the brands tend to be a small                                                                                                                        the reach of 80% of their posts in January 2018. Crown Royal
number of vocal enthusiasts who are already regular buyers.                                                                                                                         boosted 60% of its posts, Hennessy boosted 20%, while                                                                                                                 0.2
Brands need to broaden the conversation to include the                                   The number of fans is a weak measure of the health of a                                    Ciroc relied on organic reach for all of its posts that month.                                                        0.2

wider audience, and increase the reach of their social pages.                            Facebook page. A better measure is the number of active
                                                                                         users, defined as those who respond to, comment on or share                                The brands had varying success in using their paid posts to                                                                                                                             0.1       0.1
                                                                                                                                                                                                                                                                                                           0.1
These are the top international spirits brands on Facebook. The                          posts from the page. That’s because active users are more                                  recruit active users. Jack Daniel’s and Hennessy had slightly
number of followers may look low – that’s because Facebook                               likely to see the content posted on the page, since Facebook                               fewer interactions on their paid posts than on their organic
reports the fan numbers for global and local pages for the                               is more likely to filter out posts from pages that a user has no                           posts, but Svedka Vodka and Crown Royal achieved much                                                                   0
same brand separately. Jack Daniel’s is the top brand by some                            demonstrated interested in. More active users also mean that                               better response rates from their paid posts. Overall Svedka
                                                                                                                                                                                                                                                                                                                    Jack Daniel's   Svedka Vodka     Crown Royal           Ciroc   Hennessy
distance, but Svedka Vodka is the fastest growing, Crown                                 the conversation is more likely to include casual buyers and                               received the highest response rate across all its posts,
Royal overtook Ciroc to claim third place in November 2017.                              potential converts, not just the committed enthusiast.                                     followed by Jack Daniel’s and Crown Royal, with Ciroc and
                                                                                                                                                                                                                                                                                                                                                 Active users (% of total fans)
                                                                                                                                                                                    Hennessy some distance behind. For the top spirits brands
                                                                                                                                                                                    fan growth, active communities and the effective use of paid
Top international spirits brands on Facebook                                                                                                                                        posts are closely tied together.                                                                                      Source: Socialtools January 2018

              3.5                                                                                                                                 120
                                                                                                                                                                                    Converting paid posts into active responses
                             3.1
              3.0                                             +97                                                                                 100                                                                       120                                                                                                                                                    0.10
                                                                                                                                                                                                                                                                                 0.09
                                                                                                                                                                                                                                                                                                                                                                                   0.09
              2.5                                                                                                                                                                                                                                                           96
                                                                                                                                                                                                                            100
                                                       2.2                                                                                        80                                                                                                                                                                                                                               0.08
                                     +72
                                                                                                                                                          Six-month growth (000s)

                                                                                                                                                                                    Paid posts (%), paid interactions (%)
                                                                                       +66                                                                                                                                               80                          80                              79
              2.0                                                               1.9                             1.9                                                                                                                             73 0.06                                                                                                                            0.07

                                                                                                                                                                                                                                                                                                                                                                                            Responses per post (%)
                                                                                                                                                                                                                            80
Fan (m)

                                                                                                                                1.6               60                                                                                                                                                                                                                               0.06
                                                                                                                                                                                                                                                                                              60
              1.5                                                                                                                                                                                                           60                                                                                                                                                     0.05
                                                                                                                                                                                                                                                                                                           0.04
                                                                                                                      +38                         40                                                                                                                                                                                                                               0.04
              1.0                                                                                                                                                                                                           40
                                                                                                                                                                                                                                                                                                                                                                                   0.03
                                                                                                                                                                                                                                                                                                                                    0.02
                                                                                                                                                                                                                                                                                                                                                              20 18
                                                                                                                                                  20                                                                                                                                                                                                                               0.02
              0.5                                                                                                                                                                                                           20                                                                                                                                             0.01
                                                                                                                                      +6                                                                                                                                                                                                                                           0.01

              0.0                                                                                                                                 0                                                                          0                                                                                                                                                     0.00

                             Jack Daniel's             Svedka Vodka             Crown Royal                       Ciroc          Hennessy                                                                                                  Jack Daniel's             Svedka Vodka               Crown Royal                         Ciroc                         Hennessy

                                                                      Fan (m)         Six-month growth (000s)                                                                                                                                                             Paid posts (%)   Paid interactions (%)        Responses per post (%)

                    Source: Socialtools January 2018                                                                                                                                                                              Source: Socialtools January 2018

22                                                                                                                                                                                                                                                                                                                                                                                          23
Digital Channels | Content                                                                                                          Digital Channels | Content

How sporting superstars fuel
brand conversations online
Sport plays a powerful role in connecting people, on social media as well as in the flesh. Fans are
passionate and engaged, and are eager to talk about – and with – their favourite teams and players
online. Brands can tap into fans’ enthusiasm and connection with their team by becoming part of
the conversation on social media.

There has been a lot of talk recently about the NBA replacing      including Giannis Antetokounmpo, Kristaps Porzingis and
the NFL as America’s favourite sports league. Now the              Joel Embiid, are all in their early 20s and are very active on
league’s top players, as well as a crop of fresh faces, are        social media. All increased their SPI score this year, with
driving new dialogue with fans on social media that is             Antetokounmpo scoring +47, followed by Embiid at +29 and
transforming the game and opening up new opportunities             Porzingis at +11. Antetokounmpo and Embiid were ultimately
for brands. Publicis Media Sport and Entertainment decided         named All-Star starters, showing how younger and more
that the NBA would make a great subject for a study on the         socially-engaging players are making names for themselves
power of sport in social media, and how brands can tap into        and amassing loyal fan bases.
it. Together with Blinkfire Analytics we tracked the ability of
players to amass and engage fans online, and used the results      Embiid is a prime example of someone who has helped
to create an NBA Basketball Social Performance Index (SPI).        transform the culture of the NBA through social media. He
                                                                   is witty, authentic, and shares content that includes other
Some of the NBA’s greatest players are active on social            global sports and athletes. Despite having fewer followers
media, giving fans a front-row seat to drama as it unfolds on      than Golden State Warriors’ Klay Thompson, Embiid is more
and off the court. Media rights for the NBA are much more          skilled at engaging his fan base. Over the past year, he has
flexible than the NFL, allowing content to go viral more easily.   generated 11,000 more likes and 3,800 more comments.
Players’ posts fuel speculation about everything from trade        Embiid’s popularity extends far beyond 76ers devotees –
deals to rivalries and dating rumours. More importantly, NBA       roughly 98% of his followers do not identify as 76ers fans or
royalty like LeBron James and Stephen Curry weigh in on            even follow the team on social media sites.
everything from societal issues to pregame commentary
to family life. A new shorthand language has emerged on            NBA players have become their own content creators. While
this channel, and you do not have to be an avid NBA fan to         brands can partner with them to drive awareness among
follow the conversation.                                           their followers with simple endorsements, that would not
                                                                   make the most of their potential. Brands can driver greater
Good content is what drives followers, likes and fans. Kevin       ROI by working more closely with the players to craft an
Durant (the second-most-followed NBA player) and James             extended inside story that players can tell of the role brands
Harden (the fifth) are popular but do not offer a true look        play in their family or team lives.
behind the scenes, and so their SPI scores have been
dropping since 2016. In contrast, Curry and James chime in         There are still marketing opportunities to be found. There are
on current events and show inside looks at their family and        several players who hold a strong SPI ranking who have not
personal lives, consistently earning them top spots in our SPI     yet been engaged by brands. Those brands that can align
ranking.                                                           authentically with these untapped social media superstars
                                                                   can engage with a new generation of NBA fans and
According to our research, the average daily engagement            followers. After all, these social media-savvy NBA stars have
driven by the top 117 NBA players doubled in 2017, while the       already demonstrated they can keep the conversation going
frequency of posting remained the same, thanks partly to           on social long after the final whistle is blown.
greater use of Instagram.

The annual NBA All-Star game is an event where popularity
reigns supreme and determines which players are selected.
In the early rounds of voting, several young players were
surprising lead contenders, ranking ahead of some of
the more established players of the game. These players,

24                                                                                                                                                          25
Digital Channels | Programmatic                                                                                                                                                                                          Digital Channels | Programmatic

Auction Dynamics: how to cut
through the noise
                                                                 When programmatic began, publishers used a ‘waterfall’ set
         Marketing imperatives                                   up with multiple SSPs (Supply Side Platforms), stacked based
                                                                 on priority. If the first SSP did not sell the available inventory,
     •   To maximise the value of their programmatic             it would be offered on the second, and so on. Over the past           Auction Dynamics Best Practices
         buys, brands need to be aware of how the                two years, header bidding – where publishers make their
         transactions are conducted. Varying the bid             inventory available to multiple exchanges at the same time            Monitor CPMs by exchange to identify and address any          Ask DSPs what products are available in their self-serve
         price and comparing it to price paid can give           instead of sequentially – has fast become the new normal.             major pricing variations                                      user-interfaces
         you information that allows you to improve              While header bidding can create higher CPMs for publishers,           When monitoring eCPMs and performance by exchange,            This will help identify, target, and optimise against
         bid efficiency.                                         it forces SSPs to compete with one another on price in a way          compare the bid and the price paid to identify if a first-    inventory running on first-price models. Ensure there
     •   Consider moving more transactions to                    that they had not in the past. SSPs raise the closing price of        price auction or dynamic floors are affecting pricing.        are no pass-through costs from SSPs/exchanges
         private marketplaces, which offer better                their auctions to increase their probability of winning, and          This will help create specific bid strategies by tactic and   without disclosure, which will shine a light on previously
         results, better transparency and less risk.             adjust their fees or implement variable price floors, which           channel to avoid ever-creeping CPMs.                          undisclosed fees.
                                                                 are not always disclosed to the buy side platform. Buyers are
                                                                 unable to detect these floors and often must bid higher to            Campaigns that easily hit spend targets with ‘Pace            Push for universal standards that provide a more
                                                                 win the same amount of impressions.                                   Evenly’ should consider lowering their bid prices a small     transparent marketplace
Advertisers trying to understand how the current                                                                                       amount each day until they begin to underspend, then          Participate in industry certification such as TAG in the US
programmatic workflow affects their marketing budgets            The use of these tactics has led many to argue that there is          they should raise the bid price accordingly to spend the      or DTSG in the UK, and evaluate new technologies such
are faced with a daunting task. With a vast array of ad          no longer such a thing as a fair, or true, second-price auction.      budget. This will inherently improve CPMs and mitigate        as blockchain to broaden your view of the potential
technology services, platforms and cost models on offer, it is   While fees are an inevitable and important part of the                problems imposed by the fragmented auction dynamics           future landscape.
becoming increasingly difficult for advertisers to cut through   programmatic ecosystem, buyers and sellers need to have               system.
the noise. One of the areas garnering much attention is the      better transparency into when and how the fees are applied.
supply chain. While third-party tools have created a level                                                                             Private marketplaces provide a structured environment
of control for advertisers on the buy side, most sell-side       SSPs and exchanges have started adopting a first-price                with lowered risk
technology was not built to transact in real-time bidding        auction model, where the winning bidder pays exactly the              Private marketplaces, especially fixed-price deals, help
(RTB) auctions.                                                  price they bid. Ideally this delivers more working media to           with rate savings. They also offer priority positioning,
                                                                 the publisher, squeezing margins of the ad tech players in            viewability goals and brand-safety guarantees that are
This means it’s not always clear what takes place between        the middle, but it comes with its own set of challenges. The          easier and cleaner to manage. Grouping publisher deals
when a bid is submitted and a clearing price is returned. It     rollout has been inconsistent and confusing, with different           by auction type will also provide a structured, transparent
can also cause uncertainty for publishers over how to price      SSPs approaching it in different ways. Some have gone 100%            environment with lowered risk.
inventory and who is buying it.                                  first price, while some have experimented with only part
                                                                 of their inventory. Some have switched over to first price
To overcome these operational complexities, it is important      without alerting the buy side at all.
to understand how programmatic RTB auctions work, if
there are any hidden supply side fees and where the ads are      Major DSPs have addressed the change in auction dynamics
appearing.                                                       in various ways. Some are focused on adjusting their
                                                                 algorithms to automatically account for market norms and
Historically, RTB transactions have been conducted using a       prevent overpayment. Others are bidding specifically on
second-price auction. This means that the winning bidder         first-price or second-price inventory. DSPs are also starting
doesn’t actually pay what they bid, but pays US$0.01 above       to provide information about buy-side fees, either in their
the second-highest bid.                                          platforms or in custom reports to provide more clarity into
                                                                 where the working media dollar goes.

26                                                                                                                                                                                                                                                                 27
Digital Channels | Search                                                                                                                                                                                                            Digital Channels | Search

Search and shopping
get closer                                                                                                                                                           Google announces shopping actions

                                                                                                                                                                     Google recently announced a new program called
                                                                                                                                                                     Shopping Actions, which will enable a Universal Shopping
The paid search market is slowing as it approaches US$100bn in size, a milestone it will reach next                                                                  cart across Google properties. This allows retailers to sell
year. But the integration of search with shopping – as Amazon steps up its search services, and                                                                      their products directly on the Google SERP (search engine
Google improves its e-commerce offering – will continue to make search more valuable.                                                                                results page), within Google Assistant results on mobile and
                                                                                                                                                                     voice, and across the shopping and delivery service Google
                                                                                                                                                                     Express. Retailers will pay Google a percentage of the value
Zenith has increased its forecast for growth in paid-search        Net US search ad revenues, by company,                                                            of each sale transaction, similar to how brands pay Amazon
adspend this year from 9% to 10%, but growth is decelerating       2016-2020                                                                                         for each unit sold.
as the channel reaches full maturity. However, emerging paid       billions, % change and % of total
search formats – like commerce, home assistants and other
voice-activated assistants – will drive growth over next few                                             2016        2017         2018        2019        2020
                                                                                                                                                                     Global paid search impressions and clicks rise,
years.                                                             Google (US$)                         24.60        28.84       33.26        37.91       42.98
                                                                                                                                                                     while CPCs fall
                                                                   % change                              20.2         17.2        15.3         14.0        13.4

                                                                   % of total                            75.0         73.6        72.6         71.1         71.1

Up-and-coming search platforms to take share                       Microsoft (US$)                       2.61        2.93         3.24        3.45         3.64
                                                                                                                                                                     Search continues to increase its reach at lower costs. Global
from market leaders                                                % change                               8.1         12.1        10.6         6.5          5.5
                                                                                                                                                                     paid search impressions increased by 19% in Q4 2017, while
                                                                   % of total                             8.0         7.5          7.1         6.5          6.0
                                                                                                                                                                     clicks increased by 21%. At the same time, CPCs fell 8%.
                                                                   Oath (US$)                            0.21         1.21        1.23         1.25        1.27
eMarketer has identified a loss of US market share by all the                                                                                                        Search is becoming more effective and more efficient.
                                                                   % change                               -1.4       478.3         1.8         1.8          1.8
main search providers in 2017, and expects that to continue
                                                                   % of total                             0.6          3.1         2.7         2.3          2.1
to 2020. It forecasts that Google’s share of US search ad
revenue will fall from 75.0% in 2016 to 71.1% in 2020, while       Yelp (US$)                            0.62         0.71        0.83        0.97         1.10
                                                                                                                                                                     Paid search ad performance metrics
                                                                   % change                              40.5         15.6        17.0         16.0        14.0
Microsoft’s share will drop from 8.0% in 2016 to 6.0% in 2020.                                                                                                       Worldwide, Q4 2017
                                                                   % of total                             1.9          1.8         1.8         1.8          1.8
Oath’s share jumped from 0.6% in 2016 to 3.1% in 2017, but
                                                                   Amazon (US$)                          0.28        0.44         0.72         1.09        1.59
that’s because it acquired Yahoo that year. Their combined                                                                                                                                     Impression growth
                                                                   % change                              58.0         58.5        63.5         51.0        46.0
share fell, and eMarketer predicts it will fall further over its                                                                                                                                                         19.0%
                                                                   % of total                             0.9          1.1         1.6         2.0          2.6
forecast period.
                                                                   IAC (US$)                             0.45         0.41        0.38        0.36         0.35

                                                                   % change                              -31.8        -8.7        -6.5         -5.2        -3.8                                Click growth
The big winner will be Amazon, which eMarketer forecasts
to increase its share of US search from 0.9% in 2016 to 2.6%       % of total                             1.4         1.0          0.8         0.7          0.6                                                            21.0%
                                                                   Yahoo (US$)                           0.99          -            -           -            -
in 2020, an increase of US$1.3bn. Amazon has really only
                                                                   % change                              -20.8          -           -           -            -
dipped its toe into the paid search market; given its centrality                                                                                                                               Cost per click (CPC)
                                                                   % of total                             3.0           -           -           -            -
to the e-commerce market, it could be a huge force in the                                                                                                                                            US$0.49
                                                                   Total search ad spending (US$)        32.81       39.20       45.81        53.34       60.41
market if it chose to.
                                                                   Note: includes advertising that appears on desktop and laptop computers as well as                                          CPC growth
The seven listed search providers accounted for 91% of             mobile phones, tablets and other internet-connected devices; net ad revenues after
spend in 2016. eMarketer expects them to account for 84%           companies pay traffic acquisition costs (TAC) to partner sites; includes contextual text links,   -8.0%
                                                                   paid inclusion, paid listings (paid search) and SEO
of spend by 2020 as the market opens up to up-and-coming           Source: company reports; eMarketer, March 2018

competitors.                                                                                                                                                                                   Clickthrough rate (CTR)
                                                                                                                                                                                                       2.7%

Annual growth in paid-search adspend
                                                                                                                                                                                               CTR growth
                                                                                                                                                                                                         4.0%

  11% 10% 8% 7%                                                                                                                                                      Source: Kenshoo, January 2018

     2017             2018            2019            2020

28                                                                                                                                                                                                                                                          29
Digital Channels | Shoppable content

                                                                                                                                  About Zenith
Shoppable content
set to take off
                                                                                                                                  Zenith is The ROI agency. We blend data, technology and
                                                                                                                                  brilliant specialists to scout out new opportunities, solve
                                                                                                                                  complex challenges and grow our clients’ businesses. Zenith
                                                                                                                                  is part of Publicis Media, one of four solution hubs within
                                                                                                                                  Publicis Groupe [Euronext Paris FR0000130577, CAC40],
                                                                                                                                  and has offices within Publicis One. We have over 5,000
Shoppable content began as a way of turning visual images into sales, and is now moving into                                      brilliant specialists across 95 markets. We are experts in
                                                                                                                                  communications & media planning, content, performance
online video and live-stream retail, which enables consumers to shop in real-time directly from live
                                                                                                                                  marketing, value optimisation and data & analytics. Zenith
content, boosting engagement and sales from this growing retail platform.                                                         works with some of the world’s leading brands including
                                                                                                                                  Aviva, Coty, Kering, Lactalis, Nestlé, Nomad Foods, Oracle, RB,
Shoppable content is online content that allows consumers         Shoppable content and live streaming are exciting new           SCA, Sanofi and 21st Century Fox.
to buy featured products without being redirected to              forms of content built for commerce that are set to radically
another site. The development of shoppable content is very        change how consumers shop in coming years. Publishers
much a natural progression for brands, which have been            will need to have the back-end process in place to ensure
harnessing new technologies and platforms to drive product        easy and effortless shopping and to meet growing demand.
discovery and personalise the shopping experience.                As full commerce functionality is built into content, brands
                                                                  will be able to leverage customer data to develop content
Advertisers started by making their images shoppable, after       that will drive consumers to discover and shop.
which video was the next logical next step. The power of
video for shopping is undeniable: transaction rates for video
content are 1.6 times higher than for static images (according
to McKinsey’s research in 2015). However, we still see most
advertisers using video as a traffic tool, rather than a way to
drive conversions.

Video platforms are making it easier to add shopping to
video, through YouTube’s shoppable ads, Instagram Stories’
shoppable video layer, or Snapchat’s ‘swipe-up’ as an
e-commerce call to action. Start-ups are developing new
functions that make video shopping more seamless, such
as Cinematique’s touchable videos. Marketers need to test
different formats and platforms and think carefully about
how to integrate e-commerce calls to action into the video
content they create.

And there is a new twist on shoppable content that will grow
in importance in 2018: ‘live-stream retail’ enabling consumers
to interact with brands and shop via livestreaming. Live
streaming retail, or shop streaming, is already popular in
China, where Deloitte expects it to be worth US$4.4bn in
2018, reaching 456 million viewers. Chinese brands have
found success by hiring Chinese internet influencers to
promote and sell their products, which are often offered at
special discounts. The conversion rate can be up to 32%,
according to Taobao Live.

This shopstreaming works best for speciality shops, where
shoppers can receive individual attention and answers they
will not receive from any product page. A growing number
of small businesses are using Facebook Live to show off and
sell their wares, taking bids from punters in the comments.
Gadgets, which often need quite a bit of explaining, are
particularly in evidence.

30                                                                                                                                                                                                  31
You can also read