Glycemic Load in Pregnancy - Lucilla Poston FOR NON COMMERCIAL USE ONLY
←
→
Page content transcription
If your browser does not render page correctly, please read the page content below
Glycemic Load in
Pregnancy

Lucilla Poston

 FOR NON COMMERCIAL USE ONLY

Maternal
  Obesity


            Glucose, insulin, leptin, lipids,
              inflammatory response

                 Fetal
  macrosomia.

             Persistently
  altered
  energy

                         balance


           Childhood
  and
  Adulthood

                   Obesity


Transgenera(onal
  ‘Accelera(on
  ‘
  of
  Obesity?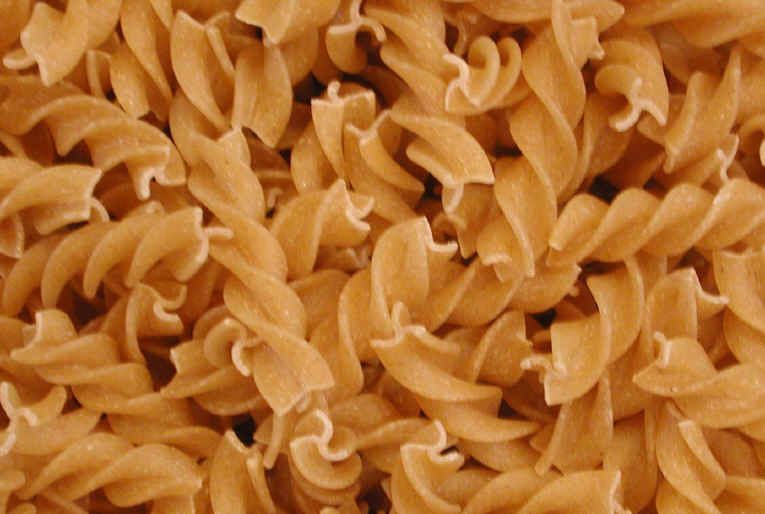
High birth weight and obesity-‐a vicious circle across genera>ons. (Cna@ngius S et al 2011) Ø 162 676 mothers and first born offspring Swedish Birth Register 1973-2006 Ø Mothers born large for gestational age (LGA) had increased risk of overweight, obesity Class I, II and III Ø Risk of LGA delivery increased with mother’s BMI Ø Risk of LGA highest in women with high BMI and LGA themselves Ø Conclusion. Prevention of LGA births may curb the intergenerational vicious cycle of obesity

Glucose homeostasis in pregnancy
Ø Insulin resistance increases with gestation in
normal pregnancy
ØLeads to maternal plasma glucose
Ø Fetal insulin
Ø Fetal growth
Exacerbated in:
Øgestational diabetes mellitus
Øobese pregnancies
Association between Maternal Fasting Plasma Glucose
and % LGA deliveries (Metzger et al, NEJM 2008). HAPO study

                 25

                 20

%>90th Centile   15

   (LGA)
                 10

                   5

                   0


                           Fasting Plasma Glucose
Association between Maternal Fasting Plasma Glcuose and
Neonatal Fat >90th centile (Metzger et al, Diabetes Care, 2009)
HAPO study
                     30


                     25


  % > 90th centile   20

  fat mass
                     15


                     10


                       5


                       0

                               5.6


                                                      Maternal fasting glucose
Post-prandial Glucose associated with fetal growth (Parretti et al, 2001) ØPregnant women; studied every two weeks between 28 and 38 weeks’ gestation ØBlood glucose levels recorded post prandially every two hr ØUltrasound scans 22, 28, 32 and 36 weeks ØSignificant association between post prandial glucose 1hr and measures of fetal adiposity

Blood Glucose profile in Obese Pregnant Women in
        Early and Late Pregnancy (non – diabetic)
                         Harmon KA et al, Diabetes Care 2011

PPB –post prandial breakfast; PPL-post prandial lunch; Pre-E; pre-dinner; PPD post prandial
dinner
Relationships between maternal variables in obese
             pregnancies and infant fat mass

Infant
Body
Fat%
Interven>ons
  to
  reduce
  plasma

glucose
  and
  delivery
  of
  large
  for

    gesta>onal
  age
  infants?
With an>-‐diabe>c drugs?
Understanding the Glycemic Index (GI) What is it? Ø A way of ranking foods according to the effect they have on blood glucose concentration. Ø Foods are ranked from 0 to 100 according to the extent they raise blood sugar levels after eating.
How GI is measured Ø Foods that are rapidly digested and absorbed raise blood sugar quickly and are given high GI values. Ø Foods that are digested and absorbed slowly raise blood sugar gradually and are given low GI values.
Effect of GI on blood sugar

                  A high GI food raises blood
                  sugar levels quickly

                  A low GI food raises blood
                  sugar levels slowly
Glycemic Index integrated area under the curve for blood sugar for
a 50g load of available carbohydrateSugary soft drinks
White bread Mashed potatoes
High/medium
GI foods
Refined breakfast
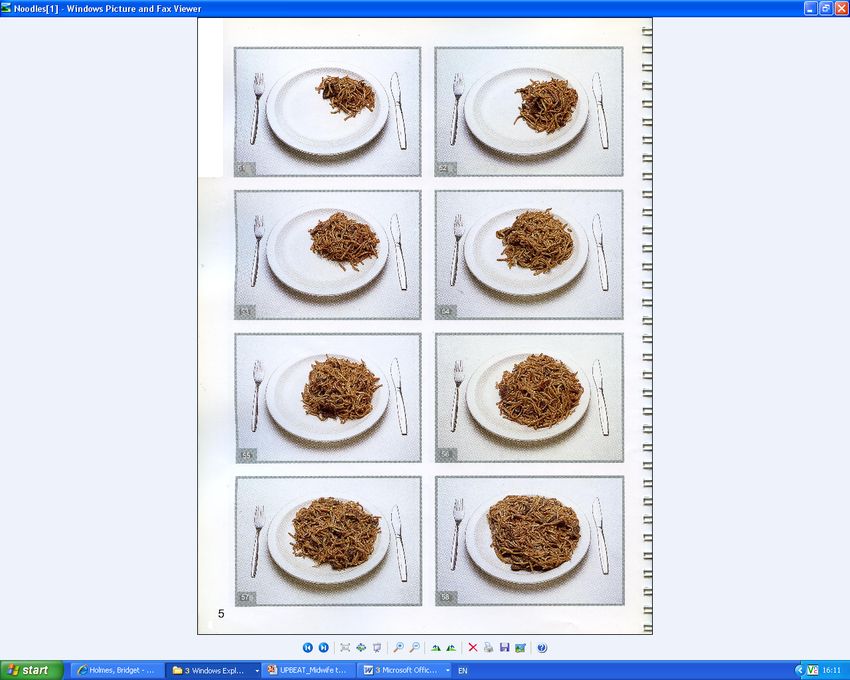
cereals Table sugar White riceMost fruit and vegetables Pasta
Diet soft drinks
Low GI foods
Porridge Basmati rice
Nuts and raisinsFactors Influencing GI Ranking
Type of starch Cooking
Physical structure Food processing
Viscosity of fibre Acid content
Type of sugar Protein content
Fat contentEvidence supporting use of Low GI Diets
• Meta-‐analysis
(Barclay
et
al,
2008)
– Previous
findings
from
observa>onal
studies
inconsistent.
– Systema>c
review
of
37
prospec>ve
cohort
studies
• Low
GI
diet
reduces
T2DM
• Low
GI
diet
reduces
CHD
– Protec>on
comparable
to
whole
grain/
high
fibre
evidence.
“There
is
considerable
evidence
that
a
diet
with
an
average
GI
of
approximately
45
will
achieve
a
significant
reduc?on
in
the
risk
of
chronic
disease.”
(Barclay
et
al,
2008
&
Brand-‐Miller
et
al.
2003)Low GI Diets and Diabetes Control Meta-analysis of 14 studies, 356 subjects (types 1 & 2 DM) Mean difference (Brand-Miller et al, 2003) - glycated proteins were reduced by 7.4% - 0.43% points in HbA1c reduction compared with high GI diet
Low GI and weight management
•   Cochrane review (Thomas et al., 2007)
•   Low glycaemic index or low glycaemic load diets for overweight
•   and obesity - 6 RCT eligible
•   Low GI versus conventional diet:
     – 1.1kg reduction in weight
     – 0.22 mmol/L reduction in total cholesterol
•   No adverse effects reported in any study

       “In studies comparing ad libitum low GI diets to conventional
     restricted energy low-fat diets, participants fared as well or better
        on the low GI diet, even though they could eat as much as
                                  desired”

                                       (Thomas et al., 2007)
Glycemic Load (GL)
Ø Proposed as a more realistic tool to assess the glycemic
response to foods.
Ø Takes into account carbohydrate content of food and
portion size.
Ø Calculated as:
o the amount of carbohydrate in a food (g) x its GI / 100
• Low GL = 10 or less
Medium GL = 11- 19
High GL = 20 or moreIntervention studies; low GI diet for Prevention of GDM –
influence on fasting glucose and macrosomia
Oostdam et al, Journal of Women’s Health 2011National trend in maternal obesity compared to
general population
Heslehurst et al, International Journal of Obesity 2009Obesity and Pregnancy Outcomes •Maternal risk •Fetal/infant risk •Gestational diabetes •Macrosomia •Pre-eclampsia •Shoulder dystocia •Venous •Brachial Plexus damage thromboembolism •Intrauterine death •Genital Infection •Spina Bifida •Urinary tract infection •Heart defects •Wound infection •Postpartum haemorrhage •Induction of labour
Work Package 11 (partners UGR, LMU
Muenchen, Abbott)
An intervention of diet (low GI) and physical activity in
obese pregnant women (n=1562; UPBEAT study KCL,
recruitment ongoing 2010-2013)...
In the EarlyNutrition programme, 3 year old children of
UPBEAT participants will be studied
www.project-‐earlynutri>on.eu
The UPBEAT trial
Complex intervention of low GI diet and physical activity
in1562 obese women
– Pilot RCT- 110 women completed;
Ø does intervention lead to change in dietary and physical
activity behaviour?
Ø barriers to behavioural change?
Ø acceptability
– Multicentre RCT
Primary Outcome:
Ø Maternal: OGTT at 28weeks
Ø Neonatal: macrosomia
Secondary outcomes
Ø Neonatal, 6mth and 3 yr adiposity UPB E AT
28
The Rationale for Combining Physical Activity and Low
Glycemic Index Diet Intervention in Obese Pregnancy
Ø Regular physical activity lowers insulin resistance in pregnancy
(Clapp 2006)
Ø Physical activity improves control of GDM (Brankston et al,
2004)
Ø Physical activity prior to and in pregnancy reduces risk of GDM
(Dempsey et al, 2004)
Ø Two trials; exercise training more effective than standard care in
prevention of macrosomia (RR 0.36 95%CI0.13-0.99) (Barakat
et al 2009; Hopkins et al 2010)
Ø Systemic review suggests reduction in macrosomia in non-
diabetic women on low GI diet (Oostdam et al, 2011).
29
Recruitment BMI >30kg/m2

              Randomisation 15-17 weeks’ gestation

              All women                      Intervention arm

     Baseline Physical Activity (PA), Diet   1:1 Health Trainer Interview
                                                     Handbook
                                                    Exercise DVD
                                                  8 weekly sessions
                                                   (SMART goals)
     28 weeks’ gestation OGTT, PA, Diet

     36 weeks’ gestation PA, Diet

30
Diet 24-hour recall
‘Triple
Pass’
method
1)
Quick
list
2)
Detailed
informa>on
(por>on
size
&
promp>ng)
3)
Review
Pilot Study Results; Glycaemic Load

Triple pass 24hr recall before and after intervention

Global GI; GL/ carbohydrate intake
The LIMIT trial; J Dodd et al

Primary endpoint:
Infant large for gestational age
Birthweight >90th centile
Target 25% reduction (14.4 to 10.8%)
N= 2,832
ROLO
  Study

             (Dublin,
  Ireland)


  Hypothesis.


  Altera>on
  of
  the
  source
  of

       maternal
  dietary
  carbohydrate

       would
  prove
  valuable
  in
  the

       preven>on
  of
  fetal
  macrosomia

       in
  at
  risk
  women
  (with
  previous

       LGA
  delivery)


               McGowan & McAuliffe BrHEALTH

                                       J Nut         2010
                                                RESEARCH
  BOARD
  IRELAND

                                     NATIONAL
  MATERNITY
  HOSPITAL
  MEDICAL
  FUND
ROLO
Interven?on
arm:
• Single
dietary
educa>on
session
• Small
groups
of
2
–
6
people
• Lasted
2
hours
• Gesta>on
15.7+/-‐3.0
weeks
Walsh,
Mahony,
Foley,
McAuliffe
2010
Dietary
Interven>on
Ø Women
were
first
given
advice
on
healthy
ea>ng
guidelines
for
pregnancy
Ø Focused
on
the
glycemic
index
Ø No
advice
o
n
gesta>onal
weight
Results
  –
  GI
  Index


                          Interven?on
  Group

                                                       Control
  Group

                              Low
  GI
  diet


Early
  pregnancy
            57.3
  ±
  4.2
        57.7
  ±
  4.0


                                56.1
  ±
  4.0
      57.8
  ±
  3.7
  *

Second
  trimester


                                56.0
  ±
  3.8
      57.7
  ±
  3.9
  *

 Third
  trimester
Results
-‐
Compliance
Compliance
Scale
%
Followed
the
diet
‘all
of
the
3.8
>me’
Followed
the
diet
‘most
of
the
76.4
>me’
Followed
the
diet
‘some
of
17.0
the
>me’
Followed
the
diet
‘none
of
the
2.8
>me’
Work Package 11 (partners UGR, LMU
Muenchen, Abbott)
A new trial in 720 obese pregnant women randomised to a
low GI dietary substitute form 16-18 week’s gestation until
delivery (partner Abbott) or to standard care.
Primary outcome; neonatal fat mass
PILOT STUDY about to start
www.project-‐earlynutri>on.eu
Aim of Pilot study Ø To evaluate relative efficacy of 3 low GI supplements versus a control on post- test glycemic response; capillary blood glucose sampling Ø With the most promising supplement, evaluate effect on post prandial glycemic response; Cotinuous glucose monitoring
Continuous Glucose Monitoring Sensors
Abbott FreeStyle® Navigator
Ø subcutaneous electrochemical
enzymatic sensor inserted under the
skin to a depth of ~5mm
Ø Connect via blue-tooth technology to
receiver
Ø measures glucose concentration of
interstitial fluid
Ø Lag time: physiological delay 10-15
min between change in blood &
interstitial glucose
Ø In-built glucometer
Ø Can be worn for 5 daysEfficacy of dietary supplement to reduce Post
Prandial Glycemic Response
Ø The prototype with the most superior glucose lowering
effect demonstrated in stage 1 will be taken to stage 2
Ø A CHO and calorie controlled diet will be provided for
the 48hr period following ingestion of the control/
prototype
Ø 15 min interval venous sampling will be performed up
to 210min following ingestion of prototype or control
Ø CGMS will be inserted to asses longer impact of the
low GI supplement v control over 48 hrs
Ø Sample analysis; glucose, insulin, c-peptide, TAG and
NEFAThe UPBEAT team Ricardo Rueda AnneGe Briley Barbara Marriage Rahat Maitland Fiona McAuliffe and ROLO team Suzanne Barr www.project-‐earlynutri?on.eu
Thank you for your attention! www.project-‐earlynutri?on.eu
Postprandial
  maternal
  hyperglycemia
  in
  sheep
  leads

to
  increased
  fetal
  growth
  (Smith
  et
  al,
  BJOG
  2009)


  Fetal birthweight (p-0.032) and fetal glucose (p
You can also read