Good bye 2020, Hello 2021! - Citation Jet Pilots
←
→
Page content transcription
If your browser does not render page correctly, please read the page content below
December 2020

                                 — LATEST BRIEFING —

Good bye 2020, Hello 2021!
Here’s to a much better flying year for all of us...

by Charlie Precourt, CJP Safety Committee
Chairman

Well 2020 has sure been quite a year. In spite of the
damper it put on a lot of our flying we still managed to
make up for it with some great new safety and education
content. You can access the materials at any time on our
web site Safety page. For example, you can revisit our
virtual convention safety stand down including our deep dive
into the Dale Earnhardt Jr. Latitude runway overrun. And
we also added a number of podcasts throughout the year on topics like ambiguous cockpit
indications, checklist use techniques, and landing performance and runway analysis. And
our final podcast of the year was appropriately titled “2020, That Was The Year, That
Was.” It’s had over 250 downloads in the first couple of days since release and you can
catch it here:
https://www.youtube.com/watch?v=uwekdOIA2Dc&t=90s Hats off to David Miller and Neil
Singer for their creativity in making all this happen.

As I write this, we’ve just had another Citation overrun that fortunately had no injuries but
resulted in a likely total loss of the aircraft. This will make a very good case study for us at
our next convention. Peter Basile of the Textron accident investigation team is on site in
Lufkin, Texas performing the analysis of the accident. He did a great job on the Earnhardt
accident presentation at our stand down so we look forward to hearing more on this
scenario at our 2021 convention. The aircraft was a Citation 551 model. You can Google for
current information using the N48DK registration. As we like to say, “We don’t tell you how
to fly your aircraft, we give you things to think about when you do.” And in this case we
don’t have a clue yet what root cause was for the accident, but the scenario gives us lots to
think about. There has been a healthy discussion on our forums about many of the
considerations, but here’s a quick rundown you should keep in mind as you do your own
flying. Peter can give us the full story in the fall.

First is the short flight situation. Just like the Earnhardt flight, this one was only 40
minutes. There’s a lot of time compression on flights less than an hour, and we see a lot of
accidents occur in these situations. The Teterboro Lear Jet circling fatality was another
example. On this flight from Austin to Lufkin, the aircraft had four aboard, including the
presumptive Texas legislature Speaker of the House. It’s a good idea to get your arrival set
up as soon as possible after takeoff to stay ahead of the curve, and keep passenger’s
schedule pressures in check.

Second issue was the weather. There was heavy rain in the 10 minutes preceding
landing. The Citation 551 performance charts call for a factor of 2.05 times dry landing
distance for water between .01 and .4 inches in depth. This could have put the required
landing distance as much as 4,400 feet with only 4,300 feet available on Lufkin runway 16,
where they landed. And recall the supplemental data (the 2.05 factor) is not flight
tested. It is analytical only. The dry distance that is used for adjustment factor is flight
tested, and the test pilot that measured it touched down on speed at 1,000 feet, and had
all deceleration devices deployed, including maximum braking, within one second of
touchdown. When we’re traveling at 180 feet per second, every foot counts in this kind of
scenario.

A third issue is potential hydroplaning. We know hydroplaning will occur at nine times the
square root of our tire pressure. So, if you have 100 psi, you can and likely will hydroplane
if you apply brakes above 90 knots. This is another good reason to check tire pressures
often and keep them serviced at the top of the specified range. Related to hydroplaning is
antiskid performance expectations and braking techniques. When we want maximum
performance braking we apply full brake pressure and hold. The anti-skid will do its job,
which may mean that you get brake release if it senses skidding as in
hydroplaning. Sometimes this can even feel like an acceleration to the pilot. The initial
deceleration backs off or stops and the pilot senses an acceleration and can perceive the
brakes are failed. All good reasons to avoid hydroplaning. That means firm landing, on
speed, break through the water layer and make firm contact with the pavement, get wheel
spin up and then apply max braking with certainty you are below hydroplane speed. It’s
possible in this accident the crew thought the brakes had failed and went for the emergency
brake. There was also some speculation they first tried to cycle the antiskid switch....
remember the system first goes through a 6 second test (no braking) when you power it
on! There are some great discussions to be had in this whole area of braking techniques
and failure response. A related accident in a Net Jets Phenom 300 involved similar braking
issues. You can see the final NTSB report here https://reports.aviation-
safety.net/2014/20140919-0_E55P_N322QS.pdf It’s worth a read. Not a Citation but
similar considerations.

Another issue is pre-landing performance data calculation. We have been advocates of the
Aircraft Performance Group runway analysis app for quite some time. It calculates all of the
adjustment factors for you and it also provides obstacle analysis in both takeoff and landing
planning. There are now three services available through Flight Plan dot Com that provide
this kind of analysis. AeroData, APG and ASAP (Automated Systems in Aircraft
Performance). You can check them out here... they can really make life easier and increase
understanding of your runway performance
expectations. https://www.fltplan.com/Runway.htm
Related to landing performance, Neil Singer has provided us a copy of an AOPA article that
gives interesting perspectives on the runway touchdown zone and implications for
performance margins. His article is attached below.

A final issue for the Lufkin accident (and there may be more when we hear from Peter) is
the choice of runway. The runway analysis tool could have shown the selection of runway
07, with an additional 1100 feet available and more into the prevailing wind, may have
made a difference. As the saying goes, there’s nothing more useless to a pilot than the
runway behind you. When the choice is there, full length takeoffs and landings on the
longest runway is the best option. If the data shows you can’t get at least 20% runway
remaining for landing margin you may want to think about going somewhere else.

Obviously in situations where margins are thin, we also have to ensure we are stable, on
speed and altitude at the threshold, or else go around. History has shown that we don’t opt
for go around very often (only 3% of unstable approaches actually result in a go
around). The airlines took this result into a scientific study of go around decision making
with the help of the Presage Group. Presage has partnered with us to conduct a similar
scientific study of go around criteria for our Citation flying. Our objective is to create
better criteria for go around than we currently have in our SOPs, which are based on
decades old, generic, stabilized approach criteria. This scientific study will look at the
specific needs and constraints of Citation operations and will be the first of its kind in
business aviation. To do this, we’ll need your help and participation in the study... so look
for more info on that later in the spring.

Our other big initiative for 2021 is incorporating FOQA where we can in our fleet. Flight
Operations Quality Assurance uses flight data capture to track our performance against SOPs
and look at our fleet aggregated results in a way that can spot safety issues before they
result in an accident. We are looking to perform an expanded Beta test of the program
starting this spring and will reach out to you for your help and participation in that program
as well. We really believe FOQA and the Go Around study could be game changers to stop
the trend in runway overruns, as well as other safety issues. We have been in touch with
many of our underwriters and were invited to place a CJP article in The Binder, which is
published by the Aviation Insurance Association (AIA). Additionally, we have received
permission to include in this edition of Right Seat one of The Binder’s recent articles about
personalizing insurance premiums. This is included below.

In the fun category, I wanted to share my experience flying a demonstration of Garmin’s
new Autoland system. The technology is going to bring a lot of benefit to future aircraft
designs that can further enhance flight safety. There’s a copy of an article I wrote about
this for EAA Sport Aviation attached below.

Fly Safe!

Charlie

MENTOR MATTERS: WHAT'S A
TDZ AGAIN?
NOT ALL RUNWAY MARKINGS ARE ALIKE

From Neil Singer

Safety groups and training providers that focus on jet aircraft
operations expend vast energy educating pilots about the ever-
present hazard of runway overruns. As overruns continue year after year to represent the

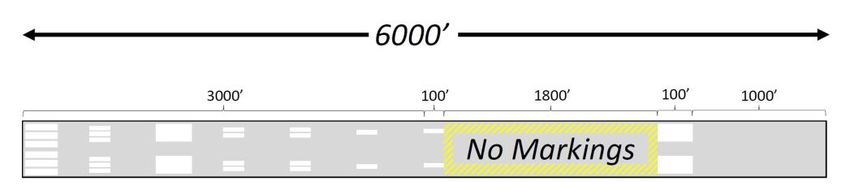
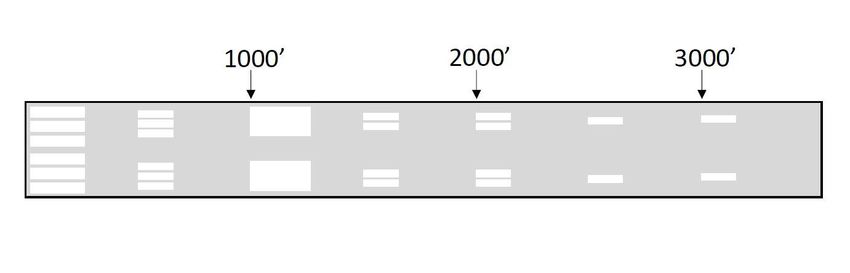
most common accident type in everything from the lightest of light jets to airline-flown
transport category planes, it’s an understandable focus.

The problem is typically attacked in two primary areas. First, in increasing education of
performance planning, especially in awareness of issues inherent with making a land/ divert
decision and the necessity of using safety margins that allows for real world, not test-pilot,
performance. Second is the focus on rigorous adherence to stabilized approach criteria, as
even a landing calculated to have a conservative safety margin can result in an overrun if
flown poorly.

This stabilized approach criteria often has the pilot perform a final land/ go-around decision
at 500’ above field level (AFL)- if the pilot meets a half-dozen criteria, most importantly
airspeed and height within an acceptable window, the approach can continue. Otherwise, a
go-around should be performed in recognition that the energy of the aircraft is too high to
allow for a landing with adequate margins.

Unfortunately, many pilots treat this 500’ AFL gate as the last box to check before
committing to land, while in reality an approach could certainly be stabilized at 500’ only to
become unstable closer to the runway. A problem, though, with attempting continuous
evaluations during the final 500’ to touchdown is a tendency for the pilot focus to shift to
visual cues, with a corresponding decrease in scan of the instruments that could alert to
excessive airspeed or height. Fortunately, there is another tool that can be readily applied
during the critical last few seconds of landing, one to prompt a go-around when landing
margins are compromised- awareness of and adherence to the touchdown zone (TDZ) as the
sole area in which the wheels should set down.

It's common for pilots to have forgotten the definition of the touchdown zone, likely last
remembered during a cram session for the instrument rating oral exam. The AIM defines the
touchdown zone simply enough: “The first 3,000 feet of the runway beginning at the
threshold”. There’s a more nuanced and practical working definition of the TDZ we can use
though, one especially relevant for the relatively shorter runways into which general aviation
jets operate.

Central our understanding this working definition of TDZ are the pavement markings present
in the TDZ on a runway served by a precision approach. For these runways, the TDZ will be
painted with bars showing distance information from the threshold in 500’ increments. After
the aiming point markings located 1000’ from the threshold, two bars on each side of the
centerline indicate the 1500’ and then the 2000’ point, while a single bar on each side of the
centerline are located at 2500’ and 3000’ from the threshold.

To avoid confusion, a runway is always designed to have at least an 1800’ long area in the
center without any TDZ or aiming point markings. If the runway has TDZ markings on both
ends (because each end is served by a precision approach), any markings that would extend
to within 900 feet of the runway midpoint are left off. If only one runway end features TDZ
markings those markings will be omitted if they extend to within 1800’ of the aiming point
marking of the opposite runway end. These fact, and some simple math, can help define a
rule to assist pilots with snap decisions if they find runway passing under them rapidly as
their jet floats down the runway.
Consider a runway with only one set of TDZ markings that is just short enough that the last
TDZ marking (the one that would be at the 3000’ mark) needs to be left off. If we do some
simplification that won’t change the final result much (e.g. the start of the aiming point
markings actually reside 1020’ from the threshold, and while TDZ markings are typically 75’
long and aiming point markings 150’ long, we’ll use 100’ for both for simplicity) we see that
to have the very end of the 3000' marker just encroach into the 1800’ “no markings” zone,
the runway would have to be 3100’+ 1800’ + 1100’, or 6000’ long. Less than this and the TDZ
effectively becomes 2500’ long with the last marker absent. For every 500’ of runway less
than 6000’ present another TDZ marker is removed- a 5500’ runway will only have markings
to and including the 2000’ point, while a 5000’ runway will only have the 1500’ marker after
the aiming point.

This helps with overrun prevention when we work the critical concept of landing safety
margins into the equation. A common practice is to require the planned runway requirement
not exceed 60% of the actual landing distance available. Using this safety factor on a runway
just over our 6000’ threshold to truncate the TDZ marks, we could need no more than 3600’
of total air and ground distance to stop the plane, or 2600’ of ground roll assuming the
typical 1000’ air distance from the threshold to touchdown (also a simplification, but again
functional for rule of thumb purposes).

Here’s where the math all comes together- if a pilot happens to float a bit and puts the
wheels down at the end of the last TDZ mark (3100’ from the threshold), they still have
2900’ left to stop- slightly more than the 2600’ calculated as necessary. This math follows as
we look at shorter runways with fewer TDZ markings- a slightly longer than 5500’ runway
with a 2500’ TDZ painted gives 2900’ of ground distance is present past the last TDZ marking
(don’t forget the 100’ roughly of length for the last mark), enough as no more than 2300’
(60% of 5500’ minus 1000’ air distance) of ground roll could be required.

Putting all this math into simple terms- combine a 60% safety factoring with an operating
practice to put the wheels down in the TDZ marking area or go-around and the situation
stacks in your favor. There are some significant caveats, of course. Most obviously, many
runways don’t have the full TDZ marking set- a runway with no approach or only a non-
precision approach, for example. Here a rule of thumb can help us- treat the TDZ as the
first 3000’ or half of the runway, whichever is less, and the same math will work out for
you. Figuring out how to identify the 2750’ point of a 5500’ runway is certainly trickier than
just ensuring the wheels are down before the end of the 2500’ marker, but the basic concept
still work just as well. Using runway remaining signs and/ or preplanned reference points on
the ground will help.

The other major caveat relates to the ability to actually stop the airplane once the wheels
are down. There is strong reason to suspect an approach which leads to floating past the

aiming point was flown too fast. Knowing you have more runway in front of you than
stopping distance needed is only assured if touchdown occurs near the calculated VREF
threshold speed. Forcing the plane down in the TDZ at 40 knots over VREF has historically
shown to be a setup for an overrun, so while saying that any landing past the TDZ should be
avoided is a good policy, it’s not the same as saying any touchdown in the TDZ will end
successfully. This strategy can add another layer of protection against a runway overrun, but
just like proper performance planning and stabilized approach discipline, it is not a panacea.

Originally published in the January 2021 issue of AOPA Pilot, Turbine Edition.

https://www.aopa.org/news-and-media/all-news/2021/january/pilot/turbine-pilot-mentor-
matters-tdz

AIA SAFETY REPORT
ARE PERSONALIZED INSURANCE PREMIUMS POSSIBLE?

Steve Bruneau – Vice President Aviation Services, Polaris Aero

Madeline Sullivan – Manager of Safety Training

There's a big debate in the sports industry during the time of Covid-19: is it safer to play or
not to play? Without much thought, it's easy to assume "no play" is the obvious answer. No
huddles, no contact, no problem. While this may be true, it isn't realistic. Aviation would be
safer, too, if planes never left the ground. Yet, business must continue. Athletes must play
and air planes must fly. A world without risk is not possible; a world with too much risk is
unacceptable. To minimize risk, we must go beyond standard concepts of safety. We need to
realize that actionable information is the key to minimizing risk.

The challenge with quantifying safety in our industry is that it's nearly impossible to track a
lack of outcomes. Instead, the industry relies on abstract and incomplete information to
guide decision making, and subsequently insurance premiums. So, what is the best way to
deter mine insurance premiums? How can we determine an operator's level of safety? Before
we can answer these questions, we must understand the inadequacies of how the "safeness"
of an operator is widely measured.

The absence of incidents or accidents is generally used to indicate a company's level of
safety. While this can be true, it is a woefully inadequate way of gauging the safeness of an
operator. As an analogy, consider a drunk driver who does not cause an accident. Does that
mean he was safe? No, the danger was still there, despite the lack of a bad outcome. The
lack of outcomes are not a reliable method for determining safeness.

The consistent use of hazard scoring systems is another indicator of a company's safeness.
These systems assign arbitrary values to various hazards. For example, night may be assigned
a score of 5 and a wet runway may be assigned a value of 3. These values are then added
together to get an overall score of 8. Here the problem lies in assuming qualitative values can
be used quantitatively. After all, we cannot claim that two 3-star restaurants are better than
a 5-star restaurant simply because the sum of the two 3-star restaurants (6) is greater than 5.
Scoring systems fail to address the risk in a meaningful way and lull users into a false sense of
security.

Third-party auditors are also used to determine an operator 's level of safety. These auditing
organizations provide a 2-tier or 3-tier rating system that categorizes an operator's safeness
based on the level of conformance to an accepted standard. These third-party audits are
certainly an improvement over the aforementioned methods; however, the data accumulated
during the audit does not paint the complete picture. The main pitfall with audits is that
they only capture the organization's safeness during a very small snapshot of time.
Finally, participation in data sharing programs-for example, Aviation Safety Information
 Analysis and Sharing (ASIAS) program, Aviation Safety Reporting System (ASRS)-is another
 indicator of an organization's interest in safety. It's important to recognize that most of these
 programs were not created to help individual companies; they were created to gather data
 for the FAA. While these data sharing systems have many bene- fits, they also have
 drawbacks: the data collected in these programs is inconsistent, incomplete, and difficult for
 operators to access.

 So, how do we overcome these shortcomings to comprehensively quantify safety for the
 purpose of offering personalized insurance premiums? It's easy to say we need better data
 analysis and information sharing. Though fundamentally important, these are not novel
 concepts. The multifaceted solution lies in the type of data we're tracking and way that
 information is shared. Let's dig deeper.

 We've already established that collecting safety data is a must here, but it's equally
 important to discuss the different types of data.

 Take, for example, the operator who looks at the safety data and sees that they've had four
 unstable approaches in the last two weeks. If they were to act only on this data (i.e., the
 number of unstable approaches), they would likely conclude that pilots require remedial
 training. They would remind the pilots of the published stabilized approach criteria. If, on
 the other hand, the operator conducts a proper root cause analysis, they may have
 discovered that all the unstable approach events were completely unrelated-they all had
 different causes. Since they had different causes, they will require different remedial actions
 to fix. Therefore, the original proposed risk control (more training) will not fix the problem!

 Consider a different example where the safety data shows a few sporadic events (e.g.,
 unstable approach, near mid-air collision, incomplete pre-flight checks) over the past couple
 of weeks, but nothing seems to be trending. If the operator were to do a root cause analysis
 on each event, they may actually discover a common causal factor-fatigue. Only after
 identifying the root causes can we put in place corrective actions to avoid negative
 outcomes.

 To understand the cost of safety, we need to look at more than just the cost of incidents and
 accidents. We need to systematically capture the impact that safety-related deviations and
 malfunctions have on a business. How many flight delays did they cause? How many flight
 cancellations? How much revenue was lost? How much did it hurt the organization's
 reputation? By capturing these hidden costs, we can get a more complete picture regarding
 the true cost of safety.

 If we can track the costs of a lack of outcomes-which we can, given today's technology-then
 we're really not that far away from being able to achieve objective safety analysis. As flight
 operations and insurance underwriters embrace information sharing, we can create industry-
 level safety analyses that will highlight which companies are lagging and which are leading.
 Not only will this process allow underwriters to accurately assess the "safeness" of an
 operator compared to their peers, it will allow flight operations to justify future safety
 investments, thrusting the benchmark for safety into unchartered territory.

 So, are personalized insurance premiums possible? Let's answer that question with a question:
 Will sports continue during Covid-19?

 This article was originally published the Aviation Insurance Association magazine, “The
 Binder.” Reprinted with permission.

Flying Garmin's New Emergency Autoland
Or should that be watching it do the flying?
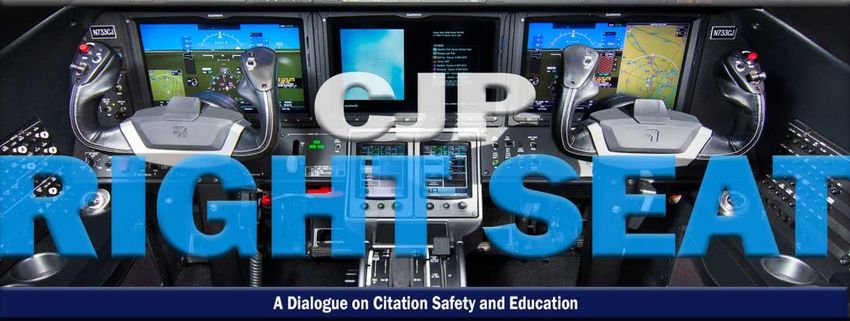
BY CHARLIE PRECOURT

I RECEIVED A CALL completely out of the blue from Garmin last month asking if I’d like to see a
demonstration of its new Autoland system. I thought, “Who, me?” Why, of course, I’d jump at the
chance! I certainly could not pass up seeing how Garmin developed this new technology and try it
out in flight. Most of us have heard by now of its capability to take over for an incapacitated pilot
and get the aircraft on the ground. But, as it turns out, there is a lot more to this system,
including tremendous potential for application to other scenarios, that make this a real game-
changer for aviation.
The plan was to meet in Vero Beach, Florida, at
Piper Aircraft’s headquarters and fly its M600
aircraft, which is now certified with the autoland
system (Cirrus’ Vision Jet and Daher’s TBM 940
have also certified the system). Garmin made
arrangements for the M600 flight, with Bailey
Scheel and Conor McDougall, part of the autoland
team at Garmin, joining me in Vero. We set up a
“prebrief” the evening before so I could learn
about the development of the system. Bailey is a
lead engineer on the autoland development
program, and she filled me in on its history and
how Garmin leveraged new computer
technologies in the design and coordinated with
the FAA and the European Union Aviation Safety Agency to program the system to operate in the
national airspace system … a fascinating evolution through multiple challenges. Baily and Conor
related that during flight testing, while the program was still a company secret, FAA controllers
noted the repeatable flight paths of the aircraft and asked, “What are you guys doing, some kind
of autoland thing?” To which the test pilot answered, “Ah, we’ll call you when we’re on the
ground.”

As I listened to their story, I couldn’t help but think back to when we tried to demonstrate
autoland in the space shuttle back in the early 1990s. We were gearing up to fly much longer
duration spaceflight missions, and there was a genuine concern the crew might be physically
deconditioned from time in zero g to the point that reentry and landing could be at risk. The
shuttle had been designed to land on autopilot, but it had never had provisions for lowering the
nose after touchdown or braking to a stop. For STS-53 in December 1992, the commander and
pilot, Dave Walker and Bob Cabana, were asked to demonstrate a landing of the shuttle where
they would leave the autopilot engaged through touchdown. Now, the computers on the shuttle
could do some amazing things, including parallel processing of five computers for redundancy,
but at the time they had only 256K of memory! For reference, a typical smartwatch in 2020 has
more than 130,000 times that much memory.

So, Dave and Bob began training in the
Gulfstream GII shuttle landing simulator
aircraft, with the main objective being to
learn when to take over should a gust
upset or a computer glitch cause a
problem late in approach. After numerous
attempts to devise a flight demonstration
protocol everyone was comfortable with,
the test objective was finally abandoned
as there were too many scenarios from
which the crew couldn’t recover to a safe
landing trajectory. Some approaches, for
example, flared too high and left the crew
wondering if the autoland system could
self-recover.

Fast-forward to today with Garmin’s autoland. With only 25 pounds of equipment (mostly adding
a radar altimeter and servos for autothrottle and autobraking) and a bunch of new algorithms for
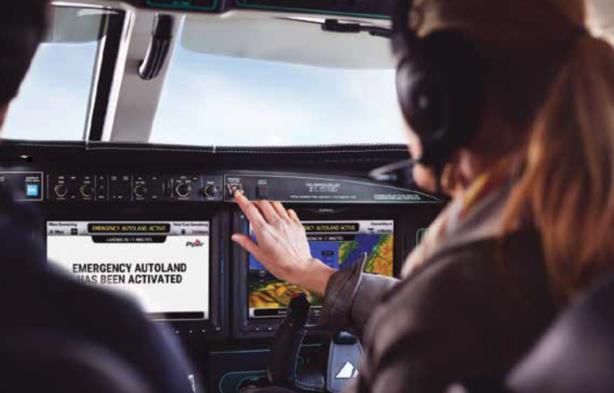
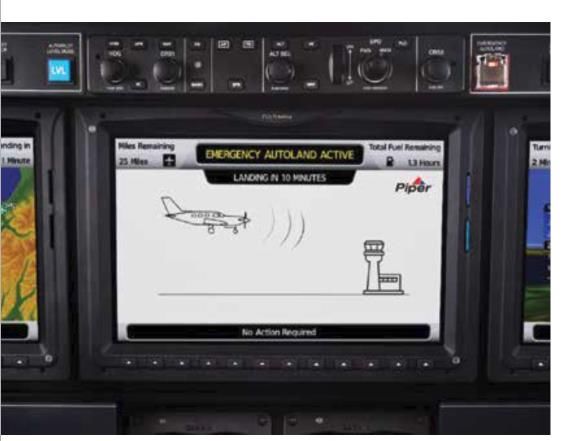
flight control software, you have an incredibly capable system. Garmin autoland has now
demonstrated over 1,100 landings in four different aircraft.

On the day of the flight, we met at Piper with CEO Simon Caldecott and test pilot Dan Lewis, who
introduced me to the beautiful M600. They organized a full deep dive into the Autoland system.
Garmin calls the system Autonomí, for advanced autonomous technology. Inside Autonomí are
three integrated capabilities: ESP, for electronic stability and protection; EDM, for emergency
descent mode; and autoland. These three pillars of the system provide the ultimate “co-pilot”
for a variety of scenarios.

ESP will assist the pilot while hand-flying the aircraft if it is flown to excessive bank angles and if
it inadvertently approaches stall or the never exceed speed. In any of these cases, the aircraft
nudges the controls back in the necessary direction to prevent exceeding its limits. EDM will
monitor for potential hypoxia situations and automatically descend the aircraft to a lower
altitude. Finally, autoland will continue to a landing if there is no input from the pilot for a
period of time.

Dan briefed me on each of these modes and how they could be entered either manually or
automatically for an incapacitated crew. For our flight, we obviously would get to try them out
manually. We got the M600 started, ran through the preflight checks, and got airborne in short
order. The flight deck integration in the M600 makes the whole process of getting airborne quite
simple. Climbing out to the east, we performed some steep turns to test the ESP, and I found the
feedback force in the yoke was subtle and just enough to nudge me to roll out. It faded away as
soon as I returned to less than 45 degrees of bank. I could also override it easily if I intentionally
wanted to fly at slightly higher bank angles. The same was true of the slow-speed and high-speed
protection. In each case, the aircraft made a timely, gentle nudge to either pitch down or up as
appropriate until the speed trend was away from the low- or high-speed limit.

After getting a good look at ESP, we moved on to test autoland. What I really liked was the logic
built into the system. It is based on the adage of aviate, navigate, and communicate. To aviate,
the system incorporates an autopilot coupled with autothrottle, as well as automatic gear and
flap deployment and braking and engine shutdown after stopping on the runway. It also will
activate icing protection systems and reset the altimeter.
To navigate, the system is calculating the best
emergency landing sites continuously. Within a
millisecond of activation, it will select the best
airport based on weather, runway, terrain, and
several other factors. And finally, to
communicate, the system will broadcast to air
traffic control the nature of the emergency and
intentions, and it will also communicate with
passengers and provide them instructions about
what the airplane is doing, what they need to
do to prepare for landing, and where and when
the aircraft will land. It is as if there were a
flight attendant on board guiding the
passengers through the emergency actions.
After landing, the displays even show how to
open the cabin door and egress the aircraft.

In our demo, the aircraft outsmarted us and decided it wanted to land at Fort Pierce (KFPR) just
to the south of Vero Beach, as it had calculated a number of options that made it better in the
moment than Vero. So, we had to fly in a different sector away from Fort Pierce and reinitiate
the autoland for it to finally choose Vero Beach. Once the system activated, the screens brought
up instructions for the passengers and the aircraft turned to join the final approach into Vero
Beach. The system requires an airport have an approach with vertical guidance as well as a hard
surface runway (it prefers 5,000 feet or more as it searches airports and requires 4,000 feet of
landing distance for the M600), and it will avoid bad weather as well. For our approach to Vero,
we watched the aircraft turn final, lower the gear and flaps, and then capture the LPV glide path
and descend to a landing in a strong crosswind situation. Flawless!
The system can handle the incapacitated pilot scenario extremely well, which is bound to save
lives in the future. There have been numerous hypoxia accidents that would not have ended
badly had this system been in place. However, beyond these scenarios are others like systems
failures or engine issues, particularly in instrument conditions. With the powerful navigation
capability Autonomí has to provide emergency divert and flight guidance solutions, the system
could help a fully functional pilot make better choices in any emergency to safely land the
aircraft. The ultimate co-pilot for the single-pilot operator. This technology has broken through a
major barrier and the possibilities for future applications are endless. Fly safe!

This article was originally published EAA Sport Aviation magazine. Reprinted with permission.

Citation Jet Pilots is the world's premier Cessna Citation aircraft owner-pilot organization. If you
are a Citation owner-pilot who wants to operate your aircraft more safely, professionally, and
economically, this is the place to be.
You can also read