Governor's Workforce Cabinet - Strategic Plan Update February 17, 2022
←
→
Page content transcription
If your browser does not render page correctly, please read the page content below
Governor’s Workforce Cabinet
       Strategic Plan Update
         February 17, 2022
WIOA Combined Plan Requirements

• Workforce Innovation and Opportunity Act (WIOA) signed into law in July
  2014.

• Each state required to submit a 2020 – 2023 WIOA plan to the Federal
  Government that outlines the vision and goals of its workforce development
  system as a whole.

• WIOA is intended to serve “individuals with barriers to employment” and
  provides "priority of service" to specific populations defined as:
   o Adult participants who are public benefits recipients
   o Other low-income individuals
   o Individuals who are basic skills deficient
WIOA Combined Plan Requirements (continued)

• Combined State Plan: Submit program plans together, more than just core WIOA
  programs.

• Updates and modifications from all programs due to DOL in March 2022
   o Labor Market Information Data Driven Decisions
   o Reemployment approaches across all programs
   o Equity in service delivery
   o Enhance supportive service offerings
Core, Partner, and State Programs of Indiana’s Strategic Plan
               Agency                                      Program
Department of Workforce      Adults
Development                  Dislocated Worker
                             Youth (in- and out-of-school )
                             Adult Education
                             Wagner-Peyser
                             Unemployment Insurance
                             Jobs for Veterans State Grant
                             Trade Adjustment Act
                             Senior Community Service Employment Program
                             Next Level Jobs – Employer Training Grants & non-credit bearing
                                               Workforce Ready Grants

Family and Social Services   SNAP E&T
Administration               TANF (including E&T) Vocational
                             Rehabilitation

Governor’s Workforce         Perkins
Cabinet                      State CTE Tuition Support
Commission for Higher        Next Level Jobs – credit-bearing Workforce Ready Grants
Education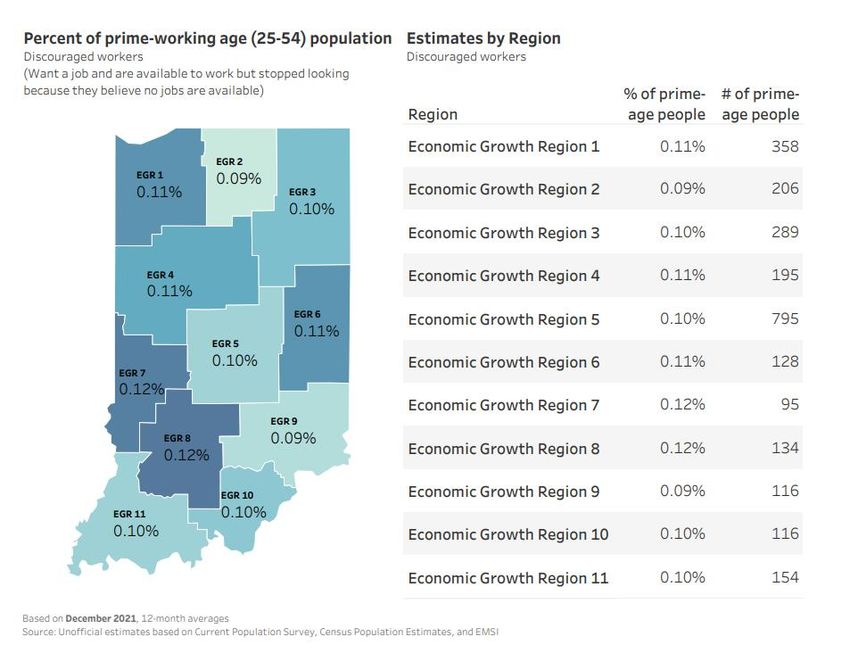
Goals of the Strategic Plan

Goal 1. Focus on meeting the individual needs of Hoosiers.

Goal 2. Integrate state systems to facilitate greater access to information,
resources, and services for constituents, businesses, state personnel, career
coaches or navigators, and case managers.

Goal 3. Align programs towards creating a healthy, engaged, and talented citizen.

Goal 4. Maximize state and federal resources through impact-driven programs for
Hoosiers.

Goal 5. Foster impactful relationships between businesses, community partners,
and government agencies.
Increasing Hoosiers Skills with Next Level Jobs
                  Workforce Ready Grants (WRG)

➢ Workforce Ready Grants Rapid Recovery Enrollments: 29,867
      ➢ This is over half of total enrollments (57,251)

➢ Workforce Ready Grants Rapid Recovery Completions: 17,880
      ➢ Also over half of total enrollments (31,729)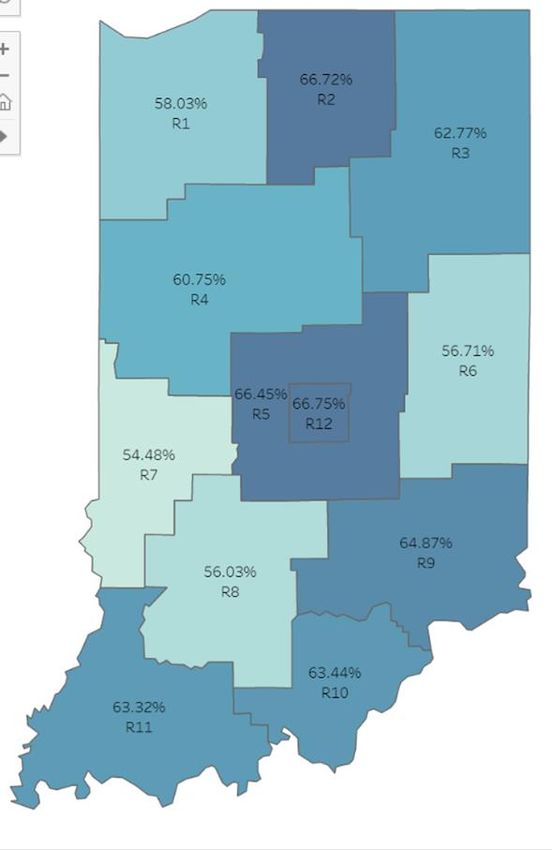
Update on Strategies Woven Throughout the Plan

➢ Data Sharing – Opportunity to better understand who is being served, by what program, and where.
   o Success with Applied Workforce Data System Project and MOU lays the foundation;
   o Need to continue to work toward cross agency/programs Data Charter
   o Over next two years research ROI models

➢ Co-enrollment – No single program has the resources necessary to meet everyone’s needs.
   o Policy released by DWD for strategic Co-Enrollment & Common Exit across partners
   o Workforce Ready Grant funding given to Regional Boards to assist

➢ Co-location –Improve customer service by reducing barriers for individuals accessing services by
  providing opportunities to get those services through a “no wrong door” approach.
   o Local regions have made progress on co-location with partner programs
   o COVID had significant impact on how we think about and implement co-location strategies
   o Virtual strategies for service delivery implemented at State & Local levels
Update on Strategies Woven Throughout the Plan
                   (continued)

➢ Cross-training – Creating better awareness of programs and ways to provide services
  across programs will help serve Hoosiers.
   o Model for cross training developed (in partnership with core partner agencies)
     and are waiting on DOL to approve funding
   o Workforce Board Training could be a National Best Practice

➢ Employer Engagement – We want to increase both the quality and quantity of
  engagement with employers
   o Influx of funds to support employers with Next Level Jobs, increase year over year
     of employers served
   o Helping employers develop and implement sustainable work-based learning
     programs as a way to attract and retain talent will be priority over next two years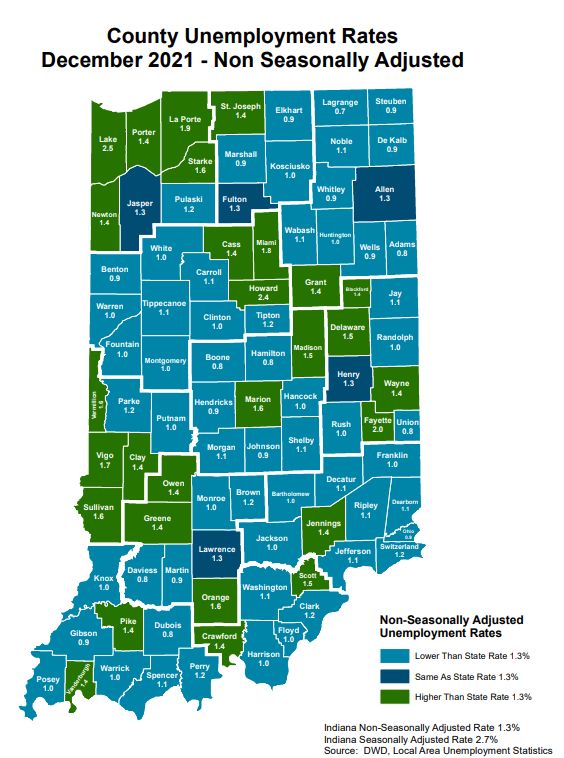
Implementation Spotlight: Vocational Rehabilitation

➢Meeting the Needs of Hoosiers
  o Conducted a survey with VR participants to understand impact of Covid-19
    pandemic on employment status.
  o Modified practices to support inclusive service delivery
  o Reduced staff turnover to less than 10% and reduced average caseload sizes.

➢Co-enrollment
  o Expanded dollars through MOU between VR and DWD to support students with
    disabilities participating in JAG.
  o In partnership with DMHA, implemented two early adopter Individual Placement
    and Support sites. IPS is an evidenced based employment model for individuals
    with mental health conditions.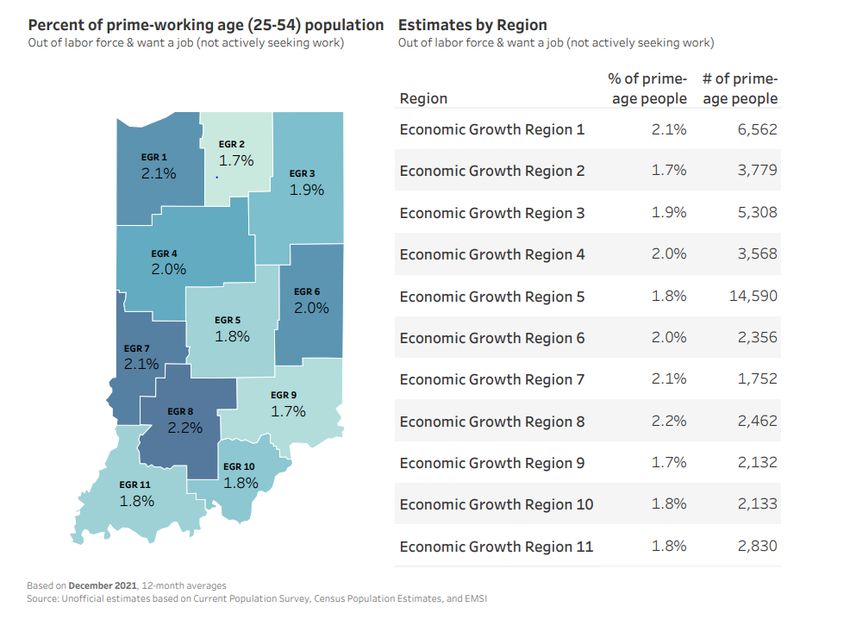
Program Spotlight: Vocational Rehabilitation
                (continued)

➢Cross-training –
   o Trained designated VR Counselors to specialize in serving participants seeking
     postsecondary training.
   o Enhanced VR employment service provider training through establishment of
     coaching network and continued support of establishment projects to expand
     provider capacity and training.
   o Enhanced VR staff training to include streamlined communication, implementation
     of counseling and guidance cohorts, and enhanced web-based modules.

➢Employer Engagement –
   o Launched webpage with resources for businesses to support hiring of job seekers
     with disabilities.
Two Year Waiver Requests Out of School Youth ➢ A waiver of the requirement to expend 75 percent of total WIOA youth funding on the OSY population. Like past years, Indiana is requesting that this percentage be lowered to 50 percent. ➢ A waiver of the requirement that local funding meets the 75 percent minimum expenditure requirement. Indiana requests that this percentage be lowered to 50 percent to align with the statewide target (see 1 above). ➢ A waiver of the requirement to expend 75 percent of Statewide Activities funding on the OSY population. It is requested to reduce this percentage to 50 percent to allow flexibility of funding special projects that meet the vision and mission of the state.
Two Year Waiver Requests (continued)

Governor’s Workforce Cabinet
➢ A waiver of the requirement for State Workforce Development Board membership
  requirement to appoint specific members to the board.

➢ A waiver to allow the Governor’s Workforce Cabinet to serve as the State Workforce
  Development Board.

This waiver will grant Indiana the flexibility to continue to align our state and federal
workforce systems.
Perkins V State Plan Update

                              2.17.22

www.in.gov/gwc/cte
Accomplishments: Redesigned 66 CTE Programs of Study ▪ Over 50,000 NLPS Course enrollments for 2021-2022 SY CTE Communications ▪ Career Guide, Bi-Weekly Updates Comprehensive Local Needs Assessment (CLNA) ▪ Revised to create greater collaboration Equity Labs ▪ Strategic analysis of disaggregated data
Plan Updates
  Staffing
  ▪ Career Specialists – 3
     ▪ Special Populations, Teacher Preparation, Recruitment, and
       Retention, and Career Advising
  ▪ Regional Directors – 3
     ▪ Work in the field to support schools to implement CTEPrograms
       of Study integrated with WBL.
  Funding
     ▪ Better align Perkins funding to priority needs
Plan Updates
Work-Based Learning
▪ To better integrate WBL and CTE
Programs, the responsibility for
developing and implementing a
framework for K-14 WBL has been
shifted to OCTE.
▪ Collaborative work ongoing with
other agencies and external
partners to improve WBL
ResourcesPlan Updates Teacher Preparation, Recruitment and Retention ▪ Contracted with the Indiana Association of CTE (IACTE) to help develop the FocusEd initiative
Plan Updates
 Data and Accountability
 ▪ CTE Annual Report
 ▪ CTE Concentrators                    Indicator   SDPL   Actual
 ▪ Reset Baseline Levels for Measures   5S1         48%    20.34
   of Program Quality
                                        5S2         12%    43.01%
   ▪ 5S1 – Credential Attainment
                                        5S3         30%    14.9%
   ▪ 5S2 – Dual Credit Attainment
   ▪ 5S3 – Work-Based Learning
     Participation
Timeline ➢ February 23 - Post for Public Comment (30 days) ➢ March 28 – Requesting Workforce Policy Committee Meet to Approve ➢ March 29 – Submission to Governor’s Office ➢ March 31– Submission to US Department of Labor ➢March thru June USDOL Approval ➢April 21 – Full Cabinet Accept and Ratify Plan Update ➢By July 1 – Approval from USDOL
Questions
Cross-Sector Data
Dashboard
Governor’s Workforce Cabinet
February 17, 2022
Research & Stakeholder
Engagement
Indicators Used in Indiana
● Department of Education: INView, Graduates Prepared to Succeed
  (GPS)
● Commission of Higher Education: Completion, College Value
● Department of Workforce Development and IU: Hoosiers by the
  Numbers
● Early Learning Advisory Committee: Interactive Annual Report
● 21st Century Talent Regions: Data Display
● Fairbanks Foundation: Community Data Snapshot
● Indiana Youth Institute: College & Career Readiness Dashboard
Dashboards in Other States
Stakeholder Engagement
      Survey
      ● Public and private K-12 districts and schools, higher
        education institutions, foundations, nonprofits,
        community initiatives, state agencies, career and
        workforce centers, advocacy organizations

      Interviews
      ● 21 individuals representing 15 organizations
      ● 21st Century Talent Regions, community initiatives, early
        childhood agencies, foundations, higher education
        institutions, regional workforce boards, state agencies, K-
        12 districts
Selection Criteria
Access Attainment Achievement
FeasibilityProposed Metrics
Proposed Metrics                                    Elementary & Middle School
                                                    ● Consistent Attendance
                                                    ● Grade 3 Reading Proficiency
                                                    ● Grade 8 ELA & Math Proficiency

    Early Childhood                                                High School
                                                                    ●   Early College Credit Attainment
     ● High Quality Early Care and
                                                                    ●   SAT College Readiness
       Education Availability
                                                                    ●   FAFSA Completion
     ● High Quality Early Care and
                                                                    ●   High School Graduation
       Education Enrollment
     ● Kindergarten Readiness

             Higher Education                               Workforce
              ● Seamless Postsecondary Enrollment            ● Labor Force Participation
              ● Early College Success                        ● Stable Employment
              ● Postsecondary Attainment                     ● Median Earnings
Design and Functionality
Dashboard Vision

   Level 1         High-level, key metrics across the early childhood to
                   workforce spectrum

   Level 2         Intermediate level to drill down further on contributing
                   factors as well as differences by subgroup and region

   Level 3         Links to other dashboards in the state for
                   users to drill down even further
Top Level
EARLY
CHILDHOOD
ELEMENTARY AND
MIDDLE SCHOOL
HIGH SCHOOL
HIGHER
EDUCATION
WORKFORCETop Level
EARLY
CHILDHOOD
ELEMENTARY AND
MIDDLE SCHOOL
HIGH SCHOOL
HIGHER
EDUCATION
WORKFORCEIntermediate Level
Hover or click here for additional data.Intermediate Level
Hover or click here for additional data.Intermediate Level
Time Series Additional Data
This chart shows the statewide trend in High School Graduation over time. Click on the links below to view additional data on High School Graduation:
● by Disability Status
● by English Learner Status
● by Region
● by Diploma Type
● by Graduation Pathway
Learn More
The Indiana Department of Education maintains a dashboard that tracks
even more detailed data on Consistent Attendance and a range of other
metrics related to student performance and progress in Grades K-12. Click
here to access the dashboard (external site).Appendix
Early Childhood
Metric               Definition               Why                                         Availability
High Quality Early   # of high quality      ● Assesses whether there is sufficient        OECOSL
Care and             childcare seats/# of     access to childcare in IN.
Education            children who need care ● Childcare availability is also a
Availability                                  workforce issue.
High Quality Early   # of children enrolled  ● Attending a high-quality pre-k             OECOSL
Care and             in high-quality program   program has been shown to boost
Education            / # of children who       children’s school readiness, start them
Enrollment           need care                 on trajectories of academic and life
                                               success, and produce a return on
                                               investment over time.
Kindergarten         % of students screened   ● Stakeholders highlighted that             KRI (currently only
Readiness            with KRI who               kindergarten readiness is the outcome     assesses a small portion
                     demonstrate                of a strong early childhood program. It   of students served by
                     Kindergarten readiness     was the most mentioned early              pre-K programs)
                                                childhood indicator.
Elementary & Middle School
Metric Definition Why Availability
Consistent % of students Grades ● Boosts students’ academics, achievement, and INView
Attendance 3-8 with >=90% motivation while chronic absence is associated with
attendance lower achievement,dropout, and delinquency.
● Chronic absenteeism also has negative effects on
classmates.
Grade 3 % of students in ● Students who are at or above proficient on a third INView
Reading Grade 3 passing grade reading assessment are more likely to have
Proficiency IREAD higher 8th grade reading scores, graduate high
school, and attend college than their peers who
were below proficient.
● Multiple stakeholder mentioned the importance of
this metric.
Grade 8 ELA & % of students in ● Students who do not meet 8th grade math INView
Math Grades 8 proficient in standards are less likely to enroll in a 4-year
Proficiency ILEARN in both college.
English Language ● A snapshot of 8th grade shows how prepared
Arts and Math students are as they transition into high schoolHigh School
Metric Definition Why Availability
Early College % of students earning a ● Research suggests that earning early college CHE
Credit ‘C’ average or higher in credit reduces time and cost to a college degree,
Attainment at least three early and that some forms positively impact high
college courses prior school achievement, high school completion,
to HS graduation or college enrollment, and college degree
earning a CTE attainment.
certificate
SAT College % of HS juniors scoring ● SAT will be required for all IN juniors in 2022 DOE (SAT will be
Readiness college-ready ● SAT scores are highly predictive of college required for all
performance IN juniors in
2022)
FAFSA % of (eligible) HS ● FAFSA is a critical lever for college access and is CHE/Learn
Completion seniors completing the highly actionable More Indiana
FAFSA
High School % of students ● The ability to disaggregate by diploma type was INView
Graduation graduating in four requested by many stakeholders
years ● Beginning in 2023, data on Graduation Pathways
can be addedHigher Education
Metric Definition Why Availability
Seamless % of students enrolling in ● Research shows that delayed college enrollment CHE
Postsecondary postsecondary following HS graduation results in lower college
Enrollment education within 1 year graduation rates and long-term earnings
of graduating HS
Early College % of students meeting all ● CHE’s Early College Success Criteria includes CHE
Success CHE Early College metrics that were mentioned by multiple
Success Criteria stakeholders (remediation, completing
coursework, and persistence).
● All of these metrics are also early indicators of
whether a student will successfully complete
their degree
Postsecondary % of working age ● Indiana’s state attainment goal is 60% by 2025 CHE
Attainment residents with a degree ● This metric, along with the ability to refine it
or high-quality based on alignment with next level came up a lot
credential. with stakeholdersWorkforce
Metric Definition Why Availability
Labor Force % of civilian ● Labor force participation is one of the ultimate Bureau of
Participation noninstitutional goals of the education pipeline and a key metric Labor Statistics
population 16 years and mentioned by stakeholders
older in the labor force
Stable % of labor force ● Adds an element of stability and retention to the Bureau of
Employment employed for at least traditional employment rate Labor Statistics
nine consecutive months ● Employers have expressed a desire to
understand how well they are retaining (not
simply recruiting) talent
Median Median annual income ● Stakeholders expressed that they don’t simply DWD
Earnings want individuals to be employed, but for them to
be employed in good-paying jobs.
● Stakeholders would like to see this data 1, 3, 5, 10
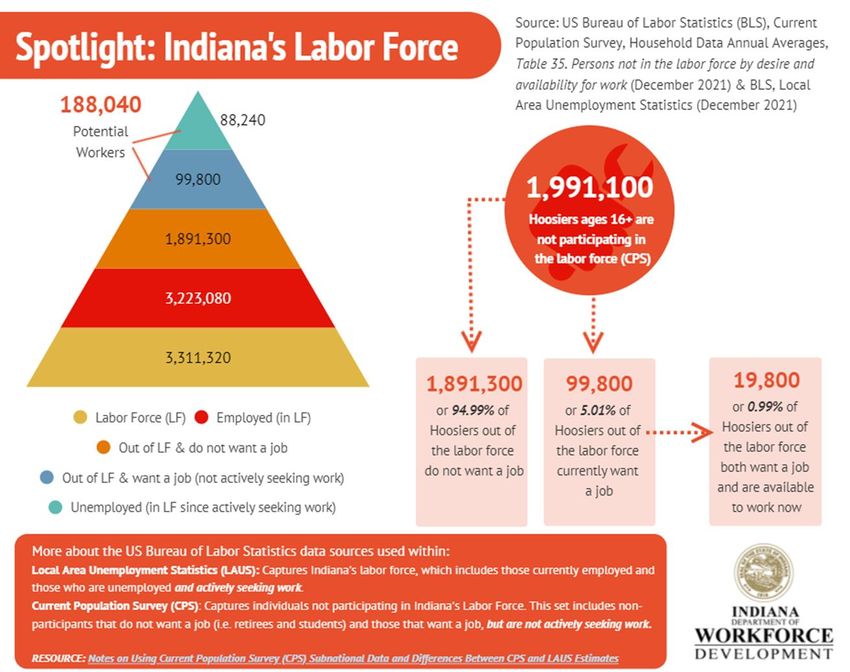
years out from earning a degree or credentialIndiana’s Labor
Force by the
Numbers
Connecting People and Employers through EngagementTwo-Year Change:
Out of the Labor
Force by Age
Connecting People and Employers through EngagementTwo-Year Change:
Out of the Labor
Force by Gender
Connecting People and Employers through EngagementRegular UI Claims
by Industry
Connecting People and Employers through EngagementNon-Seasonally
Adjusted County
Unemployment
Connecting People and Employers through EngagementUnited States 61.6%
Indiana 62.7%
Economic Growth Region 1 58.0%
Economic Growth Region 2 66.7%
Economic Growth Region 3 62.8%
Economic Growth Region 4 60.8%
Labor Force Economic Growth Region 5 66.4%
Participation by
Economic Growth Region 6 56.7%
Economic Growth
Economic Growth Region 7 54.5%
Region, Age 16+
Economic Growth Region 8 56.0%
Economic Growth Region 9 64.9%
Economic Growth Region 10 63.4%
Economic Growth Region 11 63.3%
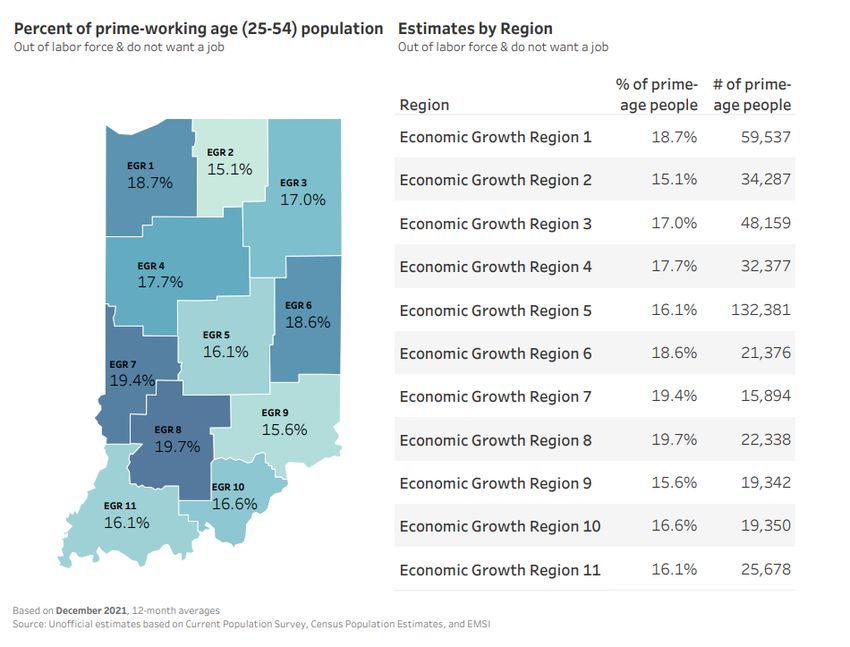
Connecting People and Employers through EngagementRegional and county-level estimates of prime working
age (25-54) Hoosiers by labor force status
These estimates are created by applying rates from:
• Unofficial CPS estimates by age and sex for December 2021 (12-month average) to
• 2020 Census population estimates by age in each of Indiana's 92 counties.
The estimates are adjusted to match labor force participation rates from EMSI (Sep 2021, 12-month average).
Out of Labor Force
by Region Drill
Includes the following measures (indentation indicates subset of previous description):
Total not in the labor force
Down, Age 25-54
Do not want a job now
Want a job
Did not search for work in previous year
Searched for work in previous year
Not available to work now
Available to work now (marginally attached)
Reason not currently looking:
Discouragement over job prospects (discouraged workers)
Reasons other than discouragement
Estimates are unofficial and preliminary and subject to change
Connecting People and Employers through Engagement• Regions 7 & 8 have the largest percentage of prime working age
individuals who are out of the labor force and do not want a job at
approximately 19%
• Region 5 has 132,381 estimated individuals who are prime working
age, out of labor force who do not want a job
Out of Labor
• Region 1 has 2.1% prime working age out of the labor force who say
Force: Prime they want a job but are not actively seeking work. An estimated
Working Age 6,500 individuals fall in this category.
25-54 • Regions 1, 3 & 5 have the highest percentage and population
Key Points estimates who are out of the labor force and available to work now.
• Regions 7 & 8 have the highest percentage of prime working age
discouraged workers
Connecting People and Employers through EngagementOut of Labor
Force: Prime
Working Age
25-54
(Do not want a job)
Connecting People and Employers through EngagementOut of Labor
Force: Prime
Working Age
25-54
(Want a job, but not
actively seeking
work)
Connecting People and Employers through EngagementOut of Labor
Force: Prime
Working Age
25-54
(Available to work
now)
Connecting People and Employers through EngagementOut of Labor
Force: Prime
Working Age
25-54
(Discouraged
workers)
Connecting People and Employers through Engagement• State labor force participation rate dropped from 64.6 in 2019 to 62.4 in 2021
• Ages 20-24, 45-54, and 55-64 saw the biggest labor force declines
• Men aged 65+ labor force participation increased from 2019-21 by 9.6%
• Men aged 20-24 labor force participation declined by 10%
• Women in the 45-54, 55-64, and 65+ age groups labor force participation
declined by 5.7%, 8.4% and 11.7% respectively
Labor Force • Unemployment is highest and labor force participation is lowest among those
Demographic without a high school degree- 42%, and highest among those with a Bachelor’s
degree or higher- 74%
Key Points
• By race, black individuals have the highest unemployment rate at 8.6%
• By race, labor force participation has declined the most among Hispanic
individuals, however it is still higher than those who identify as white or black.
White individuals have the lowest labor force participation rate and have
declined by 3.2% change over the two-year time span
Source: Bureau of Labor Statistics, Current Population Survey, 12-month average, Dec. 2019 – Dec. 2021
Connecting People and Employers through EngagementLabor Force
Participation by
Age Group: 2-Year
Change
Source: Bureau of Labor Statistics, Current Population Survey, 12-month average, Dec. 2019 – Dec. 2021
Connecting People and Employers through EngagementLabor Force
Participation &
Unemployment
Demographic
Breakouts: 2-Year
Change
Source: Bureau of Labor Statistics, Current Population Survey, 12-month average, Dec. 2019 – Dec. 2021
Connecting People and Employers through EngagementLabor Force
Participation &
Unemployment
Demographic
Breakouts: 2-Year
Change
Source: Bureau of Labor Statistics, Current Population Survey, 12-month average, Dec. 2019 – Dec. 2021
Connecting People and Employers through EngagementLabor Force
Participation,
Female, by Age
Group: 2-Year
Change
Source: Bureau of Labor Statistics, Current Population Survey, 12-month average, Dec. 2019 – Dec. 2021
Connecting People and Employers through EngagementLabor Force
Participation,
Male, by Age
Group: 2-Year
Change
Source: Bureau of Labor Statistics, Current Population Survey, 12-month average, Dec. 2019 – Dec. 2021
Connecting People and Employers through EngagementYou can also read