GROWTH BUILT TO DRIVE - Investor Presentation, March 2021
←
→
Page content transcription
If your browser does not render page correctly, please read the page content below
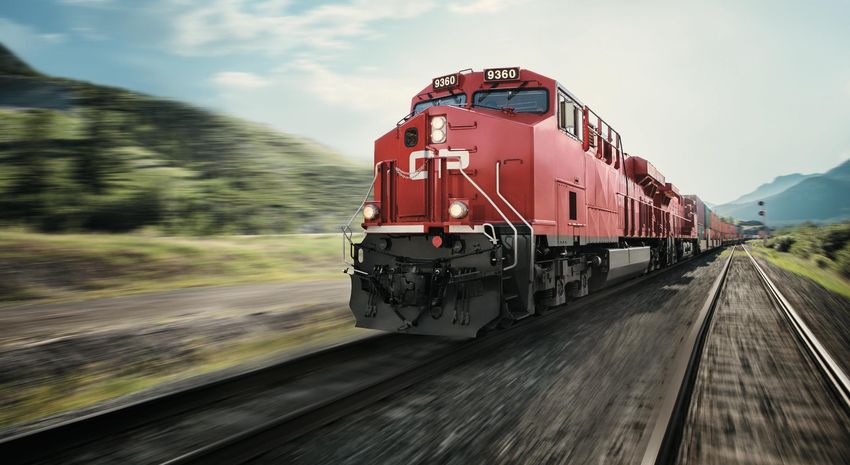
BUILT
TO DRIVE
GROWTH
Investor Presentation, March 2021
TSX/NYSE: CP
FORWARD LOOKING STATEMENTS
    The following investor presentation contains certain forward-looking information within the         populations; the availability and price of energy commodities; the effects of competition and
    meaning of applicable securities laws relating, but not limited, to Canadian Pacific’s              pricing pressures; industry capacity; shifts in current and anticipated future market demand;
    operations, priorities and plans, anticipated financial and operational performance, including      changes in commodity prices; uncertainty surrounding timing and volumes of commodities
    our 2021 full-year guidance, business prospects, market drivers and outlook, planned capital        being shipped via CP; inflation; geopolitical instability; changes in laws, regulations and
    expenditures, anticipated revenues and the source thereof, programs and strategies                  government policies, including regulation of rates; changes in taxes and tax rates; potential
    (including financing strategies), the anticipated efficiency of the high efficiency product (HEP)   increases in maintenance and operating costs; changes in fuel prices; uncertainties of
    train model and associated facilities, including growth in our high-capacity hopper car fleet in    investigations, proceedings or other types of claims and litigation; labour disputes; risks and
    2021 and beyond, shipment capacity, completion and the anticipated impacts on capacity              liabilities arising from derailments; transportation of dangerous goods; timing, completion and
    and efficiency of the HEP qualification of CP-served train-loading facilities. This forward-        impacts from capital and maintenance projects by CP and by third parties; currency and
    looking information also includes, but is not limited to, statements concerning expectations,       interest rate fluctuations; trade restrictions or other changes to international trade
    beliefs, plans, goals, objectives, assumptions and statements about possible future events,         arrangements; interruptions in the availability of land and equipment; realization of certain
    conditions, and results of operations or performance.                                               operating and cost efficiencies; climate change; various events that could disrupt operations,
                                                                                                        including severe weather, such as droughts, floods, avalanches and earthquakes, and
    Forward-looking information may contain statements with words such as “anticipate”,                 cybersecurity attacks, as well as security threats and governmental response to them, and
    “believe”, “expect”, “plan”, “financial expectations”, “key assumptions”, “outlook”, “guidance”,    technological changes; and the pandemic created by the outbreak of the novel strain of
    or similar words suggesting future outcomes. To the extent that CP has provided forecasts or        coronavirus (and the disease known as COVID-19) and resulting effects on economic
    targets using Non-GAAP financial measures, CP may not be able to provide a reconciliation           conditions, the demand environment for logistics requirements and energy prices, restrictions
    to a GAAP measure without unreasonable efforts, due to unknown variables and uncertainty            imposed by public health authorities or governments, fiscal and monetary policy responses
    related to future results.                                                                          by governments and financial institutions, and disruptions to global supply chains.
    Undue reliance should not be placed on forward-looking information as actual results may            The foregoing list of factors is not exhaustive. These and other factors are detailed from time
    differ materially from the forward-looking information. Forward-looking information is not a        to time in reports filed by CP with securities regulators in Canada and the United States.
    guarantee of future performance. The purpose of our 2021 full year guidance is to assist            Reference should be made to “Management’s Discussion and Analysis of Financial
    readers in understanding our expected and targeted financial results, and this information          Condition and Results of Operations” in CP’s annual and quarterly reports filed on Form 10-K
    may not be appropriate for other purposes.                                                          and 10-Q, respectively.
    By its nature, CP’s forward-looking information involves numerous assumptions, inherent             Forward-looking information is based on current expectations, estimates and projections and
    risks and uncertainties that could cause actual results to differ materially from those             it is possible that predictions, forecasts, projections, and other forms of forward-looking
    expressed or implied by the forward-looking information, including but not limited to the           information will not be achieved by CP. Except as required by law, CP undertakes no
    following factors: changes in, or unanticipated outcomes of, business strategies and growth         obligation to update publicly or otherwise revise any forward-looking information, whether as
    opportunities; general North American and global economic, credit and business conditions;          a result of new information, future events or otherwise.
    risks associated with agricultural production such as weather conditions and insect

2
KEY GAAP AND NON-GAAP MEASURES

NOTE ON NON-GAAP MEASURES                              $ in millions, except per share data, percentages and ratios                                        2016         2017         2018       2019       2020

     Except where noted, all figures are in millions   Total revenues                                                                                    $6,232       $6,554      $7,316      $7,792     $7,710
     of Canadian dollars.
                                                       Operating income                                                                                  $2,411       $2,519      $2,831      $3,124     $3,311
     Financial information is prepared in              Adjusted operating   income(1)                                                                    $2,411       $2,468      $2,831      $3,124     $3,311
     accordance with accounting principles
     generally accepted in the United States of        Operating ratio                                                                                   61.3%        61.6%        61.3%      59.9%      57.1%
     America (U.S. GAAP), unless otherwise             Adjusted operating ratio(1)                                                                       61.3%        62.4%        61.3%      59.9%      57.1%
     noted.
                                                       Net income                                                                                        $1,599       $2,405      $1,951      $2,440     $2,444
     CP presents non-GAAP earnings and liquidity
                                                       Adjusted income(1)                                                                                $1,549       $1,666      $2,080      $2,290     $2,403
     information in this presentation to provide a
     basis for evaluating underlying earnings and      Diluted earnings per share                                                                        $10.63       $16.44      $13.61      $17.52     $17.97
     liquidity trends that can be compared with the
                                                       Adjusted diluted earnings per    share(1)                                                         $10.29       $11.39      $14.51      $16.44     $17.67
     prior periods results.
                                                       Cash provided by operating activities                                                             $2,089       $2,182      $2,712      $2,990     $2,802
     It should be noted that CP’s non-GAAP
     measures as described in this presentation,       Cash used in investing activities                                                               ($1,069)     ($1,295)     ($1,458)    ($1,803)   ($2,030)
     have no standardized meanings and are not         Cash used in financing activities                                                               ($1,493)       ($700)     ($1,542)    ($1,111)    ($764)
     defined by U.S. GAAP and, therefore, are
                                                       Free cash(1)                                                                                      $1,007         $874      $1,289      $1,357     $1,157
     unlikely to be comparable to similar measures
     presented by other companies.                     Return on average shareholders’ equity(1)                                                         33.9%        43.4%        29.8%      35.6%      34.0%
                                                       Adjusted return on invested   capital(1) (“Adjusted   ROIC”)                                      14.0%        14.7%        16.2%      16.9%      16.7%

                                                       (1) For a full description and reconciliation of Non-GAAP Measures see CP’s 2020 Annual Report on Form 10-K and on investor.cpr.ca.
                                                       (2) Return on average shareholders' equity is defined as Net income divided by average shareholders' equity, averaged between the
 3                                                         beginning and ending balance over a rolling 12-month period.
FOUNDED IN PRECISION, BUILT FOR GROWTH

    Our precision railroading model transformed how our entire company operates and allows us to deliver
    industry-leading service. It’s a culture of excellence that we adhere to 24/7, 365. Today, this commitment to
    precision has us uniquely positioned to leverage our low cost base and best-in-class service to grow with
    our customers. By remaining disciplined, we will drive long-term sustainable, profitable growth for our
    customers and shareholders, alike.

4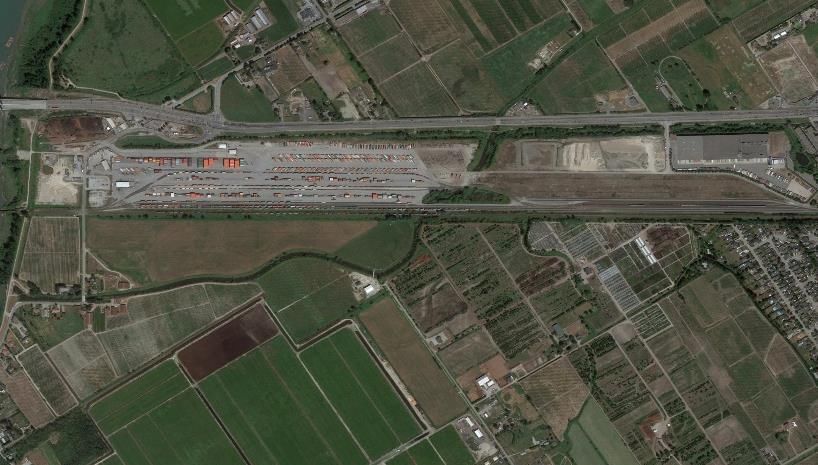
WE REBUILT THE ENGINE

        STREAMLINED
                                IMPROVED                     INVESTED IN THE
                                                                                       CULTURE
       ASSETS                       OPERATING               NETWORK                  OF ACCOUNTABILITY
                                   PERFORMANCE
    Right-sized resources to                                     Upgraded to            Railroader attitude:
     optimize our network.        Longer, faster trains     improve performance      Do what you said you’ll do.
                                  and less dwell time.      and increase capacity.

    PRECISION                   CONSISTENT, RELIABLE
                                                            LOWERED                      DEVELOPED THE
      RAILROADING                 SERVICE                       COST BASE                  TEAM
   Precision planning and       Leveraging our strengths    Unprecedented margin         Handpicked team.
execution to optimize service   to deliver superior value      improvement.             Best in the business.
     and control costs.            to our customers.

5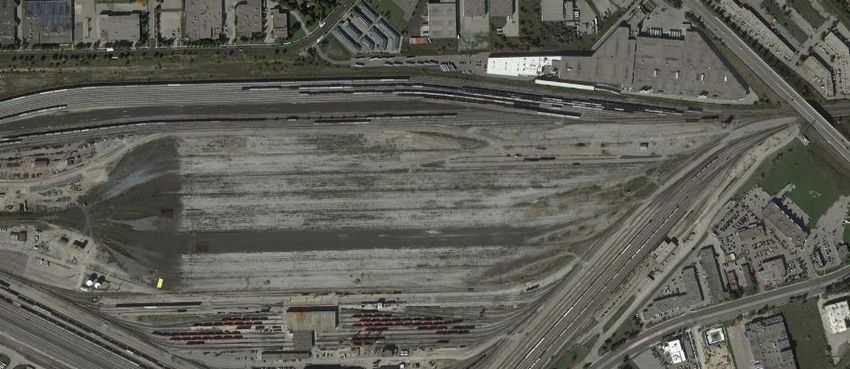
NOW WE’RE DRIVING GROWTH

 DIVERSIFIED                           INCREASED
                                                                     RIGHT                            VALUE
     BOOK OF BUSINESS            CAPACITY                        CULTURE & TEAM                          DRIVEN
     Balanced portfolio of         Efficiencies and network           Accountable,             Disciplined approach to valuing
      industries, regions      investments mean we have the     collaborative, passionate                  service.
         and markets.                 ability to do more.         team of railroaders.        We won’t commoditize ourselves.

       POWERFUL
                                  RESILIENT INNOVATION
                                                SERVICE
                                                        DISCIPLINED
FOOTPRINT                          PERFORMANCE             APPROACH
Strong network with shortest   Operating model performs in    Supply chain collaboration to   Pursuing the right customers
routes to major centers and      upturns and downturns.       enhance our service offering.     in the right lanes to grow
   ability to extend reach.                                                                           our business.

 6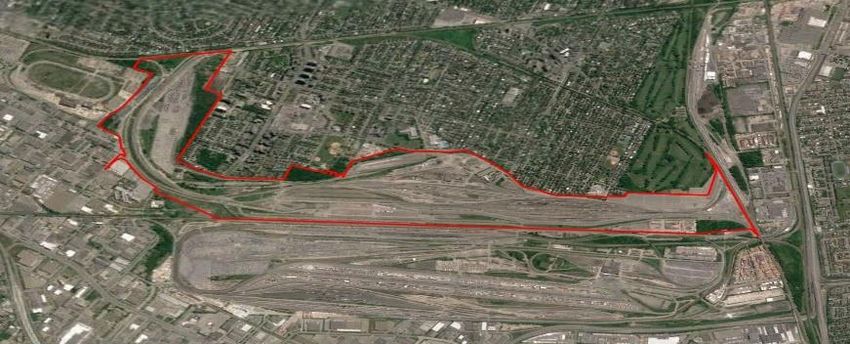
OUR
                                                                                                                                                NETWORK

                                                                                                                                                13,000 MILES
                                                                                                                                                RAIL NETWORK

                                                                                                                                                873 MILES
                                                                                                                                                AVERAGE LENGTH OF
                                                                                                                                                HAUL

                                                                                                                                                100+
                                                                                                                                                TRANSLOAD FACILITIES

POWERFUL FOOTPRINT
NETWORK OVERVIEW                                                                                                                                SHORTEST
• Competitive access to key markets in Canada and the U.S.                • Shortest routes in key lanes including Vancouver to the U.S.        ROUTES
                                                                            Midwest, Chicago and Detroit, as well as between Eastern Canada     IN KEY LANES
• Access to major ports on West and East Coasts.
                                                                            and Calgary and Vancouver.
• Most border crossings in Western Canada; provides routing
  optionality.                                                            • Access to a network of over 100 transload facilities; extends our
                                                                            service reach to markets not directly served by rail.
• Connections with Class 1 railroads and short-line partnerships extend
  the reach of our rail service.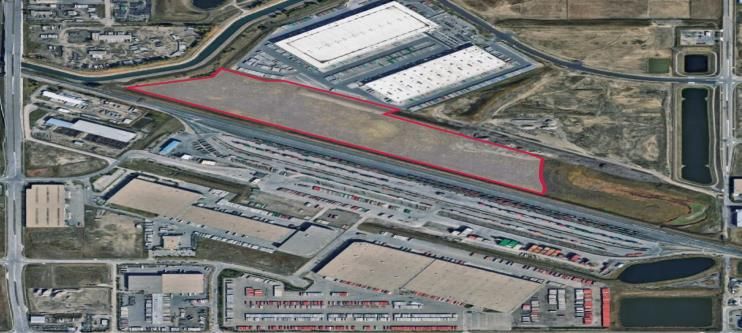
DIVERSIFIED
BOOK OF BUSINESS
                                                         Business Mix                                              Geographic Distribution              2019
                                                                                                                                                         2020Freight
                                                                                                                                                                Freight  Revenue
                                                                                                                                                                          Revenue Variance
                                                         % of 2020 Freight Revenue                                 % of 2020 Freight Revenue            Variance
                                                                                                                                                         FX-adjusted (1)

• Uniquely positioned with best-in-
  class service and capacity to
                                                                                                                                                                    Grain                   8%
  grow.

• Our diverse book of business                                                                                                                                       Coal -17%

  creates a powerful base to drive
                                                                                                                                                                   Potash                  6%
  sustainable growth.
                                                                                                                                                     Fertilizers & Sulphur                       15%
• Leveraging our strengths to grow
  with existing customers and bring                                                                                                                      Forest Products                    7%
  on new business.                                     Bulk                                       42%                        Global            40%
                                                       Grain                                      24%                        Asia              34%   Energy, Chemicals &
                                                                                                                                                                                 -1%
• Stronger margins allow us to                         Coal                                        8%                        Europe             6%         Plastics
                                                       Potash                                      7%
  compete for new opportunities.                                                                                                                     Metals, Minerals &
                                                       Fertilizers & Sulphur                       4%                        Cross-Border      30%                      -17%
                                                                                                                                                     Consumer Products
• Continually innovating with long-                    Merchandise                         37%
                                                                                                                             Canada to U.S.    22%
                                                                                                                                                              Automotive
                                                                                                                             U.S. to Canada     7%                            -9%
  term partners to help them win in                    Forest Products                      4%
                                                       Energy, Chemicals & Plastics        20%                               Mexico             1%
  the marketplace.                                     Metals, Minerals & Consumer Products 8%                                                                Intermodal         -2%
                                                       Automotive                           4%                               Domestic          30%
                                                                                                                             Intra-Canada      17%
                                                       Intermodal                                 21%                        Intra-U.S.        13%
                                                       Domestic                                   12%
                                                       International                               9%                                                                 Total Change   -1% Decline

 8       (1) For a full description and reconciliation of Non-GAAP Measures see CP’s 2020 Annual Report on Form 10-K and on investor.cpr.ca.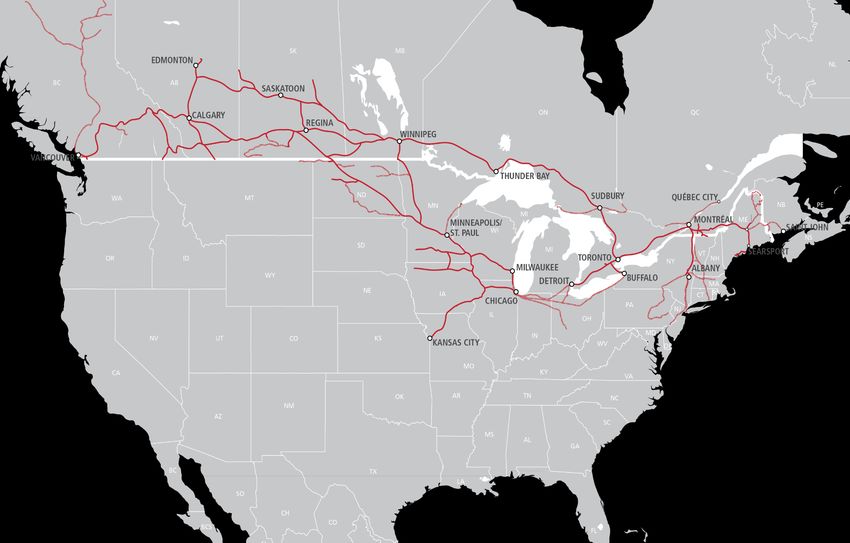
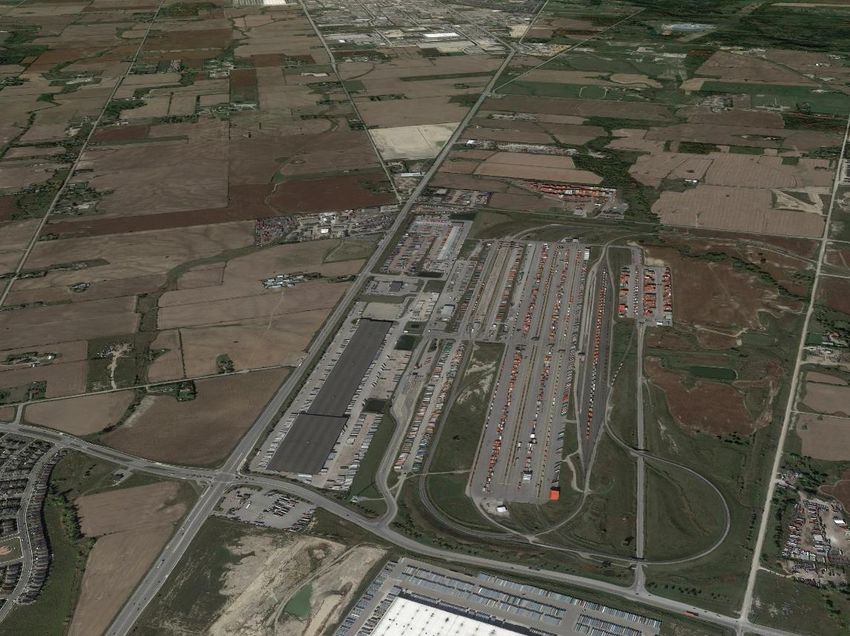
ROOM TO GROW

     Locomotives          Yard and        Network capacity     Ability to further   Surplus land
      available for   terminal capacity     through longer      increase train          gives
     future growth                        sidings, increased         length         us optionality
                                                speed

9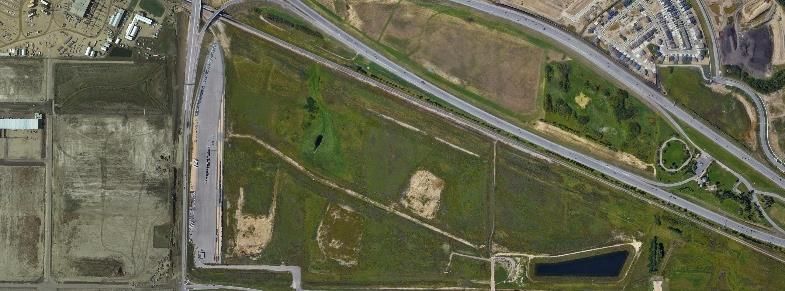
ROOM TO GROW
     SURPLUS LAND PROVIDES OPTIONALITY & LOW COST CAPACITY

               Vancouver
       •   Unmatched ability to expand footprint in Canada’s largest trade gateway
       •   Existing intermodal facility operating well below capacity
       •   CP owns >100 acres of vacant land adjacent to existing facility
       •   Provides optionality: ability to grow existing operations and provide customer
           solutions

                 Chicago
       Bensenville Yard
       •    Room to grow within existing footprint
       •    Tentative real estate agreement to add capacity, potential to build state-of-the-
            art intermodal facility
       Schiller Park
       •    75 acre site made surplus through consolidation of intermodal operations
       •    Potential to repurpose for growth opportunities or divest

10
ROOM TO GROW
TORONTO & AREA Wolverton Yard
Vaughan Intermodal
Facility
• 500 acre footprint; 150 acres vacant 520 acres
• Ability to more than double operations
with minimal capital CP mainline
• Ability to co-locate customers
Agincourt Yard
75 acres
11MORE ROOM TO GROW
Calgary Edmonton
(Dufferin) (Ellerslie)
52 acres
CP mainline
240 acres
Montréal (Les
Montréal (St-Luc)
Cèdres)
>750 acres
107 acres CP
mainline
12SPOTLIGHT
PRECISION PERFORMANCE PRECISION INNOVATION
OPERATIONS You can’t have precision without
measurement. Over the last several
• The cornerstone of our industry leading performance is our precision railroading operating model and disciplined focus years, we’ve made transformational
on planning and execution. changes to our technology infrastructure,
replacing aging legacy systems with a
• Faster train speeds and reduced dwell means better asset utilization and reduced costs for CP and our customers. new integrated data platform that has
exponentially increased the volume of
• Longer, heavier, faster trains increase network capacity and reduce operating costs. data available to us. We leveraged this
powerful platform to create Railway
Performance Monitoring (RPM), a new
Average Average Average Average system that provides deeper drill-down
Train Speed Terminal Dwell Train Weight Train Length capabilities to report on, and maximize,
(miles per hour) (hours) (tons) (feet) operations across our entire network.
23.5
22.6 6.8
22.2 22.0
21.5 6.7
7,929
6.6 The success of RPM allowed us to
6.5 7,217 7,214 7,313 7,388
6.4 launch Trip Plan. Trip Plan is driving the
9,707
9,100 9,129 next level of service performance and
8,614 8,806
reliability by providing by-the-hour
measurement of a shipment, from the
time a customer releases it, to when it
arrives at its destination. Importantly,
Trip Plan allows us to refine operations
5-year change: -6% 5-year change: -3% 5-year change: +13% 5-year change: +10%
and remedy trouble-spots to ensure we
deliver on our commitments.
2016 2017 2018 2019 2020 2016 2017 2018 2019 2020 2016 2017 2018 2019 2020 2016 2017 2018 2019 2020
13PRECISION PERFORMANCE
FINANCIAL
• Ability to generate earnings growth in various economic environments. • Opportunity to further improve margins. Targeting ~100 bps per year.
• Our focus: best-in-class service at lowest cost. • Strong free cash generation and an opportunistic approach to shareholder
returns.
• Driving stronger margins and topline revenue growth.
Adjusted Diluted Free Cash(1) Adjusted Operating
Earnings Per ($ millions) Ratio(1)
(percentage)
Share(1) 7%
($) (YOY) Cash From Operations
13% ($ millions)
(YOY) 2,990 62.4
Total Revenues $17.67
2,802 61.3 61.3
($ millions) $16.44 2,712 59.9
$14.51 57.1
2,182
1% 2,089
$11.39 7% (YOY)
$10.29 (YOY)
1,357
7.792 7.710 1,289
7.316 1,157
6.232 6.554 1,007
874 420 bp improvement
2016 2017 2018 2019 2020 2016 2017 2018 2019 2020 2016 2017 2018 2019 2020
14 (1) For a full description and reconciliation of Non-GAAP Measures see CP’s 2020 Annual Report on Form 10-K and on investor.cpr.ca.SPOTLIGHT
BUILDING FOR THE FUTURE We didn’t replace the locomotive,
CAPITAL INVESTMENT we replaced everything that
slowed it down.
Our capital investments have everything to do with running the business better, including margin Locomotive modernizations
improvement, productivity and service reliability – all key ingredients of our precision railroad operating upgrade aging units for better fuel
efficiency, service reliability and
model. safety – same productivity as a new
locomotive but with a lower price
Highlights Capital Expenditures tag. In 2021 we anticipate spending
($ millions)
$80M in capital for modernizations.
• Consistently investing $800M per year in maintenance capital.
1,647 1,671
1,551 1,550
• Strong pipeline of high return projects. 1,340
1,182
Investing in the future of the
• Two unique rolling stock investments – locomotive modernization grain supply chain.
and hopper car acquisitions – are elevating capital spending in Over the next several years, CP will
the near-term. be investing $500M to acquire
2016 2017 2018 2019 2020 2021E 5,900 new covered hoppers. The
new, high capacity cars, combined
Return On Average Shareholders’ Equity
with our 8,500-foot grain model, will
Adjusted ROIC(1) 8% 2%
(%) enable CP to move >40% more
Maintenance 5%
grain per train.
Rolling Stock
43.4 9%
Network Enhancements
33.9 35.6 34 50%
29.8 Information Systems
Other
14.0 14.7 16.2 16.9 16.7 PTC
26%
2016 2017 2018 2019 2020
15 (1) For a full description and reconciliation of Non-GAAP Measures see CP’s 2020 Annual Report on Form 10-K and on investor.cpr.ca.REWARDING SHAREHOLDERS
OPPORTUNISTIC APPROACH TO SHAREHOLDER RETURNS
We continue to return cash to shareholders by way of opportunistic share buybacks and increasing dividend payments.
Share Repurchase Program and Dividend Payout
Highlights ($ millions)
• Over $5B in shares repurchased (from 2016-2020)
o 22 million shares at an average price of
1,509
C$257/share
• $1.8B in dividends paid (from 2016-2020) 1,134
1,210 1,103 Shares $M
o 90% increase in dividends per share Dividends Paid $M
• July 2020: Announced a 15% dividend increase
381
• 5 consecutive years of dividend increases
• Targeting 25-30% adjusted dividend payout ratio(1) 348 412 467
255 310
longer term
2016 2017 2018 2019 2020
(1) Although CP has provided a target Non-GAAP measure (Adjusted dividend payout ratio), management is unable to reconcile, without unreasonable efforts, the target Adjusted dividend
16 payout ratio to the most comparable GAAP measure (Dividend payout ratio), due to unknown variables and uncertainty related to future results.LEVERAGING TECHNOLOGY
INNOVATING FOR THE FUTURE
Leveraging track analytics, dashboard applications and mobile devices to create industry-leading technologies to
advance customer service and operating performance.
• In-house technologies provide CP with hundreds of applications that track shipments, measure operational
performance and provide financial information in real-time
• Intermodal Demand Management: through customized algorithms, we are creating capacity by smoothing demand
over the week based on customer delivery requirements
• Mobile Workforce: using mobile devices to automate inventory reporting and provide required safety documents to
train crews
• CP FastPass: self-serve kiosks and mobile apps for drivers coming and going from our terminals means shorter
driver wait times, faster processing and lower terminal costs
• Robotic Process Automation: CP is using "bots" to automate high-volume manual activities to improve accuracy,
reduce costs and improve customer service
• Track Asset Management: inspection application working off a central repository in conjunction with track
inspection vehicles to create a consolidated view of track health
17PREDICTIVE ANALYTICS
ENHANCING SAFETY AND EFFICIENCY
Leveraging Big Data to drive further improvements in safety
and efficiency.
• Using patented technology, we accumulate valuable
data on wheels, rails, cars, locomotives and trains
in real-time, enabling us to anticipate issues and
take preventative measures
• Predictive analytics have reduced online failures by
91% -- significantly reducing risk of derailments, rail
fatigue and service interruptions
• Our patented algorithm improves safety and
provides a competitive advantage: 86% of all
equipment setoffs are confirmed defective versus
an industry average of 65%
18OPERATING RESPONSIBLY
ENVIRONMENTAL SUSTAINABILITY
Transportation by rail is one of the most economical and environmentally responsible methods of moving freight.
• The transportation sector is responsible for 29% of Canada’s annual GHG emissions, with the rail industry contributing only 1% to the country’s total annual
GHG emissions(1).
• Trains are 4 times more fuel efficient than trucks and produce 75% fewer GHG emissions (2).
• The transportation of freight by rail will continue to play an integral role in the low-carbon future for North America.
GHG Emissions by Sector in
Canada
(% of Canadian GHG Emissions)
Non-transportation 71%
Transportation (non-rail)
28%
Rail Transportation 1%
(1)Environment and Climate Change Canada (2019) National Inventory Report 1990-2017: Greenhouse Gas Sources and Sinks in Canada
19 (2)Association of American Railroads (2019). Freight Railroads Embrace Sustainability & Environmental Preservation. Whitepaper Fact Sheet.OPERATING RESPONSIBLY
CLIMATE CHANGE & EMISSIONS REDUCTION
• In July 2020 CP released a Climate Change Statement acknowledging the impacts of rising global temperatures and reiterating our commitment to
address climate change through innovation and industry leading best practices.
• CP has committed to setting science-based targets to reduce emissions in line with the Paris Agreement.
• CP is conducting scenario analysis to understand the full range of possible impacts from climate change related to our business.
• CP’s locomotive operations consume more than 92% of the energy needed to run our operations. While CP regularly outperforms industry averages for
fuel efficiency, we are committed to further improving the carbon footprint of our locomotives.
• Since 1990, CP has improved locomotive fuel efficiency by 43% representing 31 million metric tons of carbon avoided.
• CP’s consumes 14% less fuel per gross ton mile than than the North American Class 1 average.
Locomotive Fuel Efficiency Locomotive Emission Intensity
(Gallons/1,000 GTMs) (KG CO2E per 1,000 RTM)
1.149
1.060
12.8
1.035
0.999
0.980
0.980
0.955
0.953
0.942
11.8
11.2 11.2
11.0 11.0
10.7 10.7
16% improvement
18% improvement
2012 2013 2014 2015 2016 2017 2018 2019 2020 2012 2013 2014 2015 2016 2017 2018 2019
20OPERATING RESPONSIBLY CASE STUDY: OGDEN YARD TRANSFORMATION • In 2011, CP’s Ogden yard located in Calgary, AB was an inefficient industrial yard powered by half century-old natural gas fired boilers and a three- quarter century old steam tunnel system that supplied heating throughout all the buildings. Due to high operating costs and general inefficiencies, previous management made the decision to vacate the property and the land sat vacant. • In 2013, as part of the company’s turnaround plan, the abandoned yard was transformed into a new corporate campus. Head office operations were moved out of expensive downtown leased office space enabling cost savings, an improved employee experience and revitalizing the surrounding community. • In 2020, CP announced it had begun work to install a solar energy farm at the campus. The installation is expected to generate more power than consumed, equating to a 2,600 tonne reduction in GHG emissions annually. The project will also assist in reducing CP’s Scope 2 emissions. 21
OPERATING RESPONSIBLY
     SAFETY

     Safety is foundational at CP. We remain steadfast in our commitment to safety, across our entire operation.

     • CP has been North America’s safest railway for 15 consecutive years. Over the last decade, our train accident frequency has decreased more than 40%.
     • Each year CP allocates over 50% of its capital investments toward safety and replacement initiatives to ensure our network remains safe and efficient.
     • Management compensation is tied to safety performance: 20% of the short-term incentive program is weighted to safety.

                   Class 1 Compare:                                                                                                      FRA Personal Injury                                                      FRA Train Accident
                   FRA Train Accidents Frequency                                                                                         Frequency                                                                Frequency
                   (2013 – 2020)                                                                                                         (per 200,000 employee-hours)                                             (per million train-miles)

                       5.0                                                                                                     1.67        1.65
                                                                                                                                                                                                           1.12
                                                                                                                                                       1.48                                                                   1.10
                       4.0                                                                                                                                          1.42
      No. Per Million Train Miles

                                                                                                                                                                                                                                            1.06
                                                                                                                                                                               1.11
                       3.0
                                                                                                                                                                                                                   0.99
                       2.0                                                                                                                                                                                                                         0.96

                       1.0                                                                                                                        34% improvement                                                         14% improvement

                       0.0
                                          2013 2014 2015 2016 2017 2018 2019 2020                                              2016        2017        2018       2019        2020                         2016   2017        2018      2019       2020

                                       BNSF            CSX           NS           UP          CN            CP

22                                  Certain statistical highlights and safety indicators figures have been updated to reflect new information or have been revised to conform with current presentation.
OUR MARKETS (2020 Figures)
BULK
GRAIN

                                                                                                                                                     SPOTLIGHT
      Canadian Grain 72%   Grain is our largest market segment and we are the best at servicing it.     THE FUTURE OF GRAIN TRANSPORTATION
      Regulated 54%        CP is the only Class 1 railway with meaningful grain franchises in both
                                                                                                        15% of the high-throughput elevators we service are
      Non-regulated 18%    Canada and the U.S. Our network is strategically positioned through the
                                                                                                        8,500-foot high efficiency product capable (“HEP”).
                           heart of the grain-producing regions of Western Canada and the
                                                                                                        By the end of 2020, more than 25% of CP-served
      U.S. Grain 28%       Northern Plains of the U.S. We provide direct access from high-
      Domestic 19%                                                                                      train-loading facilities will HEP qualified. The 8,500-
                           throughput unit train loading elevators to major export port terminals for
      Export 9%                                                                                         foot HEP grain train, when combined with our
                           shipments overseas.
                                                                                                        investment in new hopper cars, will enable >40%
                                                                                                        more grain to be moved per train.
 24
BULK
COAL
SPOTLIGHT
Canadian Coal 89% Our Canadian coal business consists primarily of metallurgical coal. CONTINUOUS IMPROVEMENT IN THE
Leveraging our shortest routes to Vancouver terminals, more than 97% of COAL SUPPLY CHAIN
U.S. Coal 11% our Canadian coal shipments, which originate in Southeast B.C., are
We have successfully implemented a pull-to-demand
exported through the West Coast with the remaining 3% moving through
model that allows coal trains to run at evenly spaced
Thunder Bay terminals or Chicago.
intervals with a consistent flow to the ports. Our coal
For U.S. coal, CP receives coal from connecting railroads that serve fleet cycle time has improved up to 20% since 2012.
thermal coal mines in the Powder River Basin region of Montana and
Wyoming. The coal is them delivered to power generating facilities in the
25 Midwest states of Wisconsin and Iowa.BULK
POTASH &
FERTILIZERS
SPOTLIGHT
Potash 63% For export potash, our key competitive advantage stems from our shortest THE LEADING CARRIER FOR EXPORT POTASH
Export 42% route to Vancouver and the U.S. Pacific Northwest, via connections with
Domestic 21% U.S. carriers. In our domestic market, potash moved primarily to the U.S. CP has origin access to Canada’s 11 potash mines
Midwest for local application, eventually reaching end markets in the and the shortest routes to Vancouver and Portland.
Fertilizers 30% We move approximately 70% of potash produced in
Southeast U.S.
North America.
Sulphur 7% Our strong origin access to fertilizer producers in Western Canada and
shortest routes to destinations in the U.S. Midwest support our growth in CP is now operating trains with upwards of 200 cars
the fertilizer market. to Vancouver and 185 cars to Portland creating
26 capacity and a more efficient potash supply chain.MERCHANDISE
ENERGY,
CHEMICALS
& PLASTICS
SPOTLIGHT
Biofuels 17% Our network is ideally located to serve a wide range of commodities:
A DEDICATED TRAIN SERVICE
biofuels originate in the U.S. Midwest; chemicals originate in Eastern
Chemicals 75% The CP Energy Train, a non-crude train, is a direct
Canada, Alberta, the U.S. Midwest and Gulf of Mexico; crude originates
Crude 21% primarily in Western Canada; petroleum products originate service connecting production areas in northern
Petroleum Products 34% predominantly in Alberta, Saskatchewan and North Dakota; LPG and Alberta to Vancouver that runs faster than our
Plastics 11% plastics originate mostly in Alberta. competitor allowing customers to rationalize their
fleets.
27MERCHANDISE
METALS,
MINERALS
& CONSUMER
PRODUCTS
SPOTLIGHT
This portfolio includes a diverse mix of input materials such as sand, TRANSLOADS ENABLING GROWTH
Frac Sand 13%
Transcare Logistics, our wholly owned subsidiary, is a
Other Aggregates 33% cement, clay, gravel, salt, steel and non-ferrous metals. These materials
typically originate on CP’s network and are shipped across North transload and distribution company that operates four
Steel 29%
America. CP’s network of transload facilities enable CP to serve locations in Canada: Montréal, Toronto, Mississauga
Consumer Products 19% and Hamilton. Our Hamilton facility is the largest and
customers and facilities not located directly on our network.
Mines & Metals 6% fastest rail-to-truck steel transload facility and the first
automated rail-based transload operation in Canada.
28MERCHANDISE
FOREST
PRODUCTS
SPOTLIGHT
Pulp & Paper 55% Our network is ideally situated to connect raw materials and finished E-COMMERCE DRIVING ADDITIONAL
Lumber & Panel 42%
products to market. We have abundant railcar supply and network GROWTH IN FOREST PRODUCTS
capacity to capture emerging growth opportunities in forest products.
Other 3% Our transload network extends our reach to non-rail
served box and paperboard plants.
Our portfolio includes lumber, wood pulp, paper products and panel
As e-commerce continues to gain in traction, CP’s
transported from key producing areas in Western Canada, Ontario and
transload facilities and intermodal capabilities give us a
Québec to various destinations in North America and for export overseas.
competitive advantage to grow market share and
benefit from increased demand for packaging materials.
29MERCHANDISE
AUTOMOTIVE
SPOTLIGHT
Finished Vehicles 97% We ship the whole value chain: domestically produced vehicles, imports, VANCOUVER AUTO COMPOUND
Origin Canada 52% automotive parts and machinery. Our diverse portfolio includes Canadian-
Vancouver is Canada's primary automotive gateway
Origin U.S. 25% produced vehicles that ship to the U.S. from Ontario production facilities;
Imports 15% for Asian imports and one of the largest destination
U.S.-produced vehicles that ship within the U.S. as well as cross-border
Origin Mexico 5% markets. Recognizing the significant opportunity for
into Canadian markets; import vehicles that move through Vancouver to
growth in this market and the ability to offer a unique
Machinery 1% Eastern Canadian markets; and, Mexican-produced vehicles that ship to
solution in a deeply congested market, CP opened
Parts & Other 2% the U.S. and Canada.
its Vancouver Auto Compound on 19 acres of CP-
owned land.
30INTERMODAL
Domestic Intermodal 58% With industry-leading service performance, extended service reach, and SPOTLIGHT
Canada 53% an enhanced suite of product offerings, we’re growing with existing LEVERAGING OUR EXTENDED EAST COAST
Cross-border 4% customers and attracting new business. Our domestic intermodal provides REACH
U.S. 1% truck-like service for transcontinental and cross-border service. CP’s recent acquisition of the Central, Maine & Québec
International intermodal moves container volumes between the ports to (CMQ) presents additional growth opportunities in
International Intermodal 42%
inland destinations across Canada and the U.S.
Port of Vancouver 33% intermodal. CP can now offer the shortest route
Port of Montréal 7% CP has been leveraging our shorter route miles to provide transit time between Atlantic Canada and key North American
Other 2% advantages to our customers in key lanes. Containerized traffic from the markets.
Port of Vancouver is primarily long-haul business destined for business
31
centers across Canada and the U.S. Midwest.PORT OF VANCOUVER 32
CENTRAL MAINE &
QUÉBEC RAILWAY
(CMQ)
STRATEGIC ACQUISITION

 • Deepwater port access at Saint John and
   Searsport – provides CP with coast-to-coast
   access

 • Shortest routing from the Maritimes to
   Montreal, Toronto, Chicago and Western
   Canada

 • Opportunity to more than double revenues in
   12-24 months

 • Investing in the CMQ network to get it to CP
   safety and operational standards

   33
You can also read