Find a Zero: Which Billion Dollar Company Will be Bankrupt by 2020'
←
→
Page content transcription
If your browser does not render page correctly, please read the page content below

‘Find a Zero: Which Billion Dollar Company Will
 be Bankrupt by 2020’

 ABSTRACT: we contend that Advanced Micro Devices Inc., (AMD) one of
 Silicon Valley’s semiconductor success stories, will file for bankruptcy by 2020.
 Since 2008, this legacy company has survived by slashing operating expenses,
 spinning off its manufacturing business and transitioning away from its core
 PC business to “growth markets”. While it may be succeeding in marketing its
 turnaround narrative to the market, we see ADM at a point of no return. We
 identify a toxic combination comprising an uncompetitive product portfolio,
 technological leap forwards by competitors, several structural challenges, poor
 positioning due to an ineffective strategy and a worsening balance sheet. While
 it is bagging some wins, the clock is ticking and AMD will be unable to drive
 profitability in industries where product leadership, rather than merely pricing,
 determines success.

Participants: Bardavid, Toby; Pedretti, Ivan; Presa Perez, Aessandro

                                                                                     1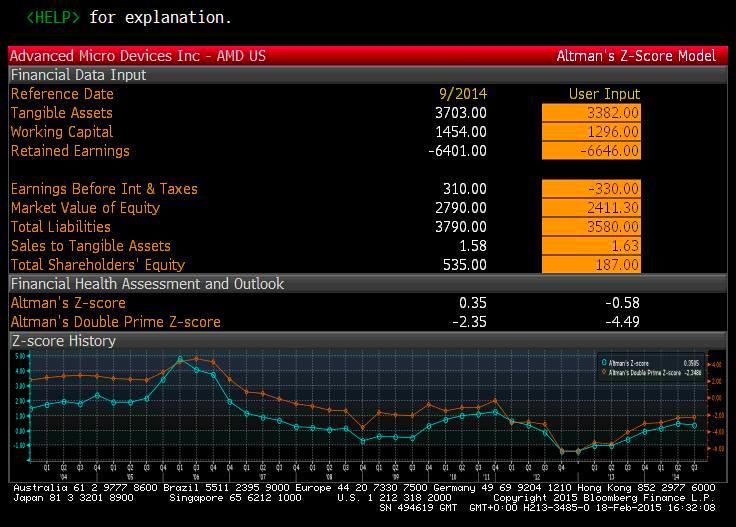
TABLE OF CONTENTS

I. COMPANY OVERVIEW                                              3

II. STRUCTURAL CHALLENGES PUSHING AMD TOWARDS BANKRUPTCY         4
A. INDUSTRY DYNAMYCS: WHERE WINNER TAKES IT ALL                  4
B. KEY INDUSTRY TRENDS                                           5
C. MANUFACTURING CAPABILITIES: ONLY FOR THE DEEP POCKETS         7
D. RESTRUCTURING TRANSITION: ELUSIVE GROWTH AVENUES              8
D. NO TRUCE IN THE BUDGET SEGMENT AS COMPETITION INTENSIFIES     9

III. BUSINESS FUNDAMENTALS FALLING APART                        10
A. PRODUCT PIPELINE: NOT MUCH EXCITEMENT AHEAD                  10
B. INNOVATION CONSTRAINED: NO R&D, NO PARTY                     12
C. TECHNOLOGY BETS – MISUNDERSTANDING THE POTENTIAL             13
D. MICROSOFT & SONY ILLUSORY WIN: A BITE FROM THE WRONG APPLE   14

IV. VALUATION AND FINANCIALS                                    17
A. LIQUIDITY ANALYSIS                                           17
B. VALUATION                                                    20

V. CONCLUSION                                                   22

VI. APPENDIX                                                    23
A. DCF MODEL ASSUMPTIONS                                        23

VII. GLOSSARY OF TECHNICAL TERMS                                25

                                                                 2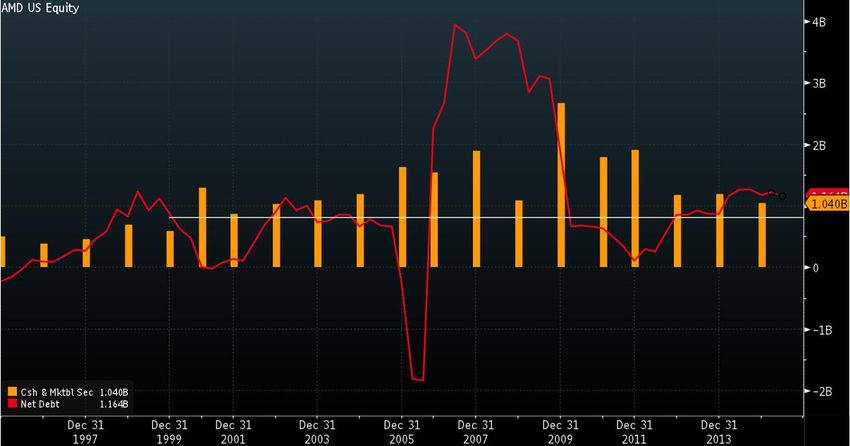
I. COMPANY OVERVIEW

 Advanced Micro Devices, Inc. (AMD) is a global semiconductor company based in
Sunnyvale, California, USA that designs, develops and sells microprocessors for computing,
communications and graphic visuals for business and consumer markets. It employed 10,149
staff as of September 2014. The company is quoted on the NASDAQ and traded at around
$2.4bn as of February 20th, 2015.

 In view of the awful performance in the past three years, AMD is transitioning away from
PC to “growth markets”, aggressively marketing its reorganization narrative to justify a
disproportionate valuation. We argue that AMD is a typical example of a legacy company,
which still benefits from its past reputation as a technological leader to fuel misconceptions
about its survival prospects. Although it plays a systemically crucial role to avoid the
complete monopoly of Intel and the likes in certain markets, it is not a sufficient argument to
out rule the option of bankruptcy. Surprisingly, many investors are buying into the turnaround
story advanced by its recently appointed CEO, Lisa Su, and we do not dispute that AMD still
retains some healthy business units. However, we think that AMD, which once reached a
valuation of $6.8bn in 2010, is destined to go bankrupt by 2020.

                                                                                             3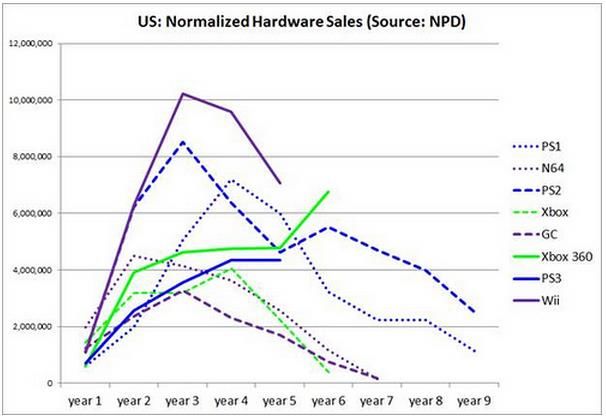
II. STRUCTURAL CHALLENGES PUSHING AMD TOWARDS
BANKRUPTCY

A. INDUSTRY DYNAMYCS: WHERE WINNER TAKES IT ALL

      In the semiconductor industry, small feature improvements can yield exponential
competitive advantages including lower cost, material usage reductions, lower power
consumption and greater performance. The semiconductor industry is characterized by
extremely short product life cycles (i.e. upgrade frequency of 12-18 months) thus radical
supplier substitutions and market share gains are common when chipmakers are unable to
meet the future requirements of customers1.

Figure 1. Semiconductor Product Lifecyle Management2

    Furthermore, this industry is highly cyclical, meaning that semiconductor companies are at
the mercy of the end consumer’s needs. For example, following Microsoft’s discontinuation
of support for Windows XP in 2014, many companies have updated their computers.

1   Marketline (2014), ‘Advanced Micro Devices, Inc. SWOT and Corporate Finance Report’, Marketline Strategy.
2   Poston, B. and Dury, J. (2006), ‘Semiconductor Product Lifecycle Management: Industry Adoption, Benefits and The Road Ahead’,
Kalypso Consulting White Papers. Accessed February 13, retrieved from: http://kalypso.com/downloads/insights/SemiconductorPLM.pdf

                                                                                                                                    4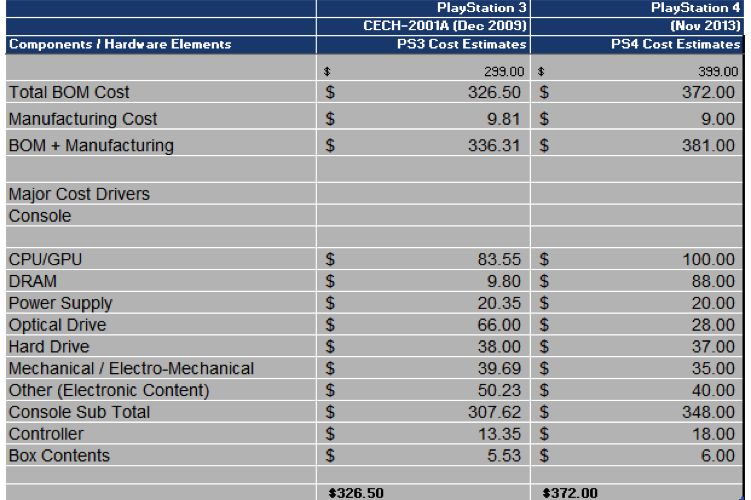
This ongoing corporate refresh cycle has boosted many companies’ revenues but not really
AMD’s, as the company is over-indexed to the volatile consumer PC segment 3 . During
industry downturns, semiconductor companies focus on R&D and creating innovative
products. This means that the companies with the deepest pockets are able to make
technological leaps, leaving competitors years behind. Therefore in some markets players can
earn quasi-monopoly status, as is the case for Intel in in desktop PCs and servers.

B. KEY INDUSTRY TRENDS

    Historically, consumers that needed more power tended to buy desktop PCs as opposed to
laptops. However, with technology advancements, market demand is pivoting away from
desktops, even for professionals and intense gamers. AMD has recognized this trend and is
refocusing on processors for laptops, but Intel already has a similar range on the market,
which is more performant and more power-efficient.

Figure 2. Notebook share of revenue growth for AMD (Trefis)

3Sur, H. and Peterson, B. (2015) ‘Advanced Micro Devices’, J.P. Morgan North America Equity Research. Accessed February 13th through
Thomson One Banker.

                                                                                                                                  5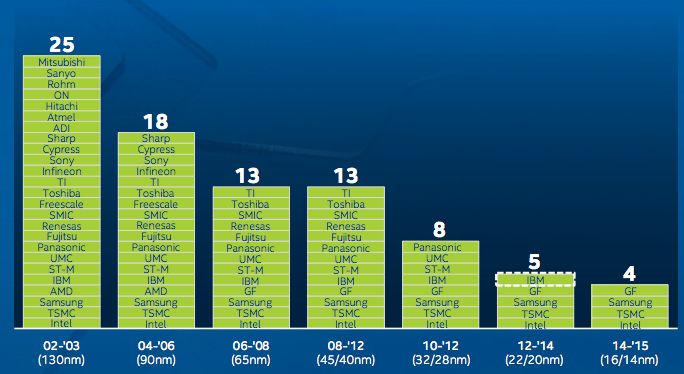
In the fast-growing mobile microprocessor segment, which is proven by the intensively
competitive landscape and by companies continually trying to enter this market. Both AMD
and Intel are looking to enter this market, but competitor Nvidia already has its popular Tegra
line of mobile processors. It is a risky move for AMD to pursue this avenue as they have
already tried and failed. In 2012, AMD launched its Hondo series, which promised good
performance specifications, but actually lacked power efficiency compared to Intel’s Clover
Trail, and was unfortunate enough to be launched for the unpopular Windows 8 tablet
operating system. While we believe there are opportunities to grab market share in the
semiconductor industry, we do not think AMD is strategically positioned to gain market
share.

                                                                                             6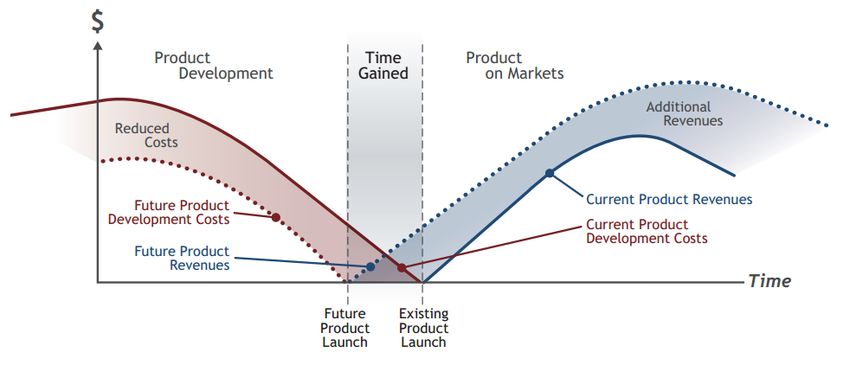
C. MANUFACTURING CAPABILITIES: ONLY FOR THE DEEP POCKETS

Figure 3. Number of players with leading edge fab (manufacturing) capabilities4

    Since AMD spun off its manufacturing business into GlobalFoundries in 2009, it means
revenue is now driven by pre- and post- production value chain activities, while competitors
such as Intel and Samsung, being integrated device manufacturers, still retain a production
advantage benefitting from in-house supply chain management. For instance, Intel has had a
monopoly for nearly 3 years on an advanced manufacturing technology called “FINFET” and
the company has used this manufacturing edge to dominate the PC and server markets and try
to build a presence in tablets and smartphones5. As GlobalFoundries expands its client base
and becomes less reliant on AMD orders, AMD is losing its ability to enjoy any preferential
treatment with only two pure, foundry-model players remaining.

4 Smith, S. (2014), ‘Investor Meeting 2014 - Stacy Smith (CFO)’, Intel Corporation, Santa Clara. Accessed February 13th, retrieved from:
http://files.shareholder.com/downloads/INTC/3989058672x0x796003/D44A974E-2F17-427C-8339-29B1268E83B1/2014_IM_Smith_Final-
2.pdf
5 Moore, J., Hettenbach, C., Rao, V., Dogra, S. and Lim, A. (2015), ‘What’s Moving Semi Stocks’, Morgan Stanley Research. Accessed

February 13th through Thomson One Banker.

                                                                                                                                      7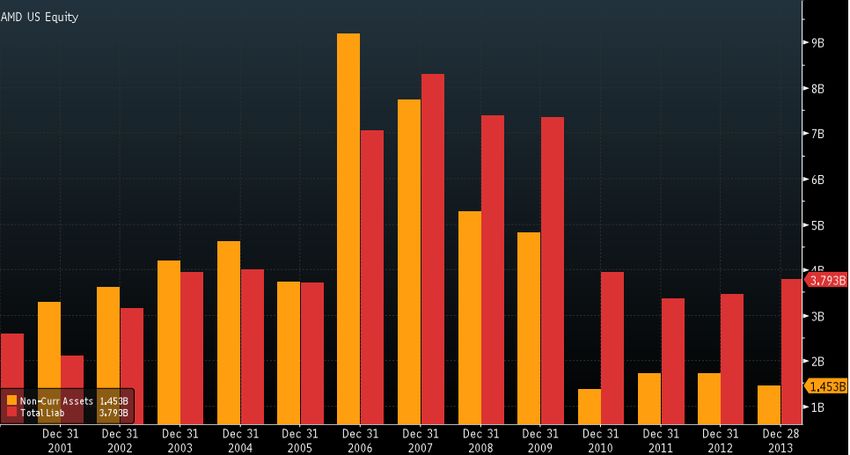
D. RESTRUCTURING TRANSITION: ELUSIVE GROWTH AVENUES

    AMD plans to ignite growth by departing from its core PC business – given the failure of its
fast-follower, budget-pricing strategy – and avoiding fierce rivalry with Intel. With the PC
market likely to be in long-term decline and AMD’s lack of commitment, we see its market
share further deteriorating. Essentially, AMD is engaged in a relentless diversification drive,
pursuing “growth markets” without being able to create a stronghold in a specific one – apart
from the semi-custom business in gaming, which will be addressed later. We concede that it is
rapidly expanding its addressable market, around $80bn in 2014 and estimated $100bn
exposure by 20181. Yet AMD’s ability to capitalize it is grossly overestimated.

Figure 4. Transition away from core business – but where?6

    Last quarter AMD hinted at virtual reality as a potential growth channel yet commercial
applications of this technology are still years away from materializing. Even if it were, it is
very unlikely that this could constitute a promising outlet for its GPU and CPU based semi-
custom business. We agree that these may be potential future growth avenues but these are
extremely long shots, more suitable for companies with deep pockets, such Samsung Intel -
certainly not for an ailing chipmaker. The semi-custom business is more promising but even
here, we will explain why AMD chose the wrong path.

6Su, L. (2014), ‘Investor Presentation’, Advanced Micro Devices Inc. [Online]. Access February 13th, retrieved from:
http://ir.amd.com/phoenix.zhtml?c=74093&p=irol-irhome

                                                                                                                       8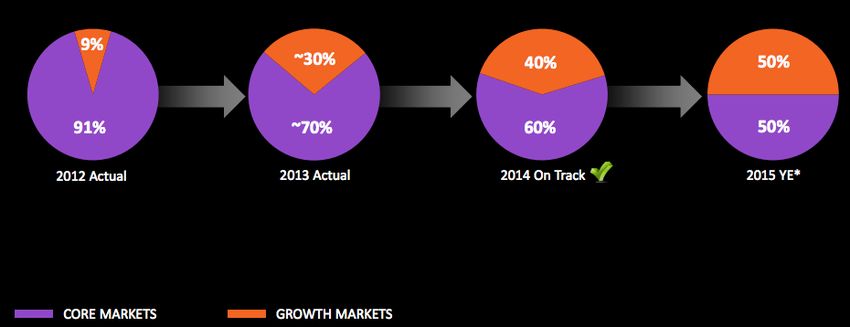
D. NO TRUCE IN THE BUDGET SEGMENT AS COMPETITION INTENSIFIES

  AMD is no longer the lone budget player, as incumbents want a slice of the cake. The last
revenue figures suggest is being further asphyxiated in the PC market as it market share
erodes to 19.4% from 26% in 20107. Its historical stronghold in the lower end is under attack
by incumbents, which squeezes its margins. Some companies such as Qualcomm have been
making new products, such as the SnapDragon 210, to take advantage of the demand in
emerging markets. Intel has begun its crusade to crush AMD in the low-end microchip
segment with its Bay Trail and Broadwell products. Even in the low end Intel uses 22nm
technology, which is more advanced than AMD’ 28nm technology used in its most recent
processors. With its slow retreat, we believe AMD’s revenues will take a big hit.

7 Trefis. (2015) ‘Analysis NYSE:AMD’, Trefis Equity Research. Accessed February 14th through Thomson One Banker.

                                                                                                                   9
III. BUSINESS FUNDAMENTALS FALLING APART
A. PRODUCT PIPELINE: NOT MUCH EXCITEMENT AHEAD
AMD has a history as an innovation leader but it is desperate for a technological
breakthrough. Unfortunately, there is not much to get excited about its product pipeline. In the
computer market, Intel has taken a historical leap forward with its 14-nanometre processors,
which will significantly reduce power usage, increase battery life and allow the production of
fanless devices. AMD’s technology is lagging roughly 1.5 years behind compared to Intel.
Figure 5. Intel takes a 2-generation lead over AMD on CPU process technology8
The decision to cut R&D is astonishing because revenue declines mean it cannot sustain
operations much longer without releasing successful products. AMD’s launch of a new
“Carizzo” processor range in 2015, aimed at notebooks and small desktop PCs, shows the
failure of its fast-follower strategy. Although it is a positive step towards simplifying its
notebooks offering, a direction Intel is also taking, this range is no match to Intel’s
“Broadwell”.
8 Nag, D. and Prisco, M. (2015), ‘Advanced Micro Devices: Falling Expectations or Falling Knife?’ Macquarie Research. Accessed
February 13th through Thomson One Banker.
10Carrizo might be more efficient than its predecessors but Intel’s Broadwell Thermal Design
Power (TDP) is much lower. Simply put, this means that AMD’s chips use much more energy
than Intel’s, which negatively affects the computer’s battery life, a crucial feature in consumer
electronics. Therefore AMD’s already weak revenue stream from the PC market is seriously
at risk.
Figure 6. AMD product introductions are disadvantaged relative to Intel (Mcquarie)
We do not have the bigotry to discredit AMD’s whole product pipeline – partly because
there is significant secrecy around it. Nonetheless, we believe that AMD’s product line-up for
the next two years merely offers promises of technological advancement under fancy
marketing labels but evidence clearly points to a severely deteriorating product mix.
11B. INNOVATION CONSTRAINED: NO R&D, NO PARTY
We believe the product pipeline deficiency is self-inflicted. While AMD has trimmed down
its operating expenses with remarkable skill, this has an inevitable and critical consequence.
R&D budget is down 50% since 2008 and now represents 1/10 of Intel’s.
By no means are we suggesting that the size of the budget is directly proportional to the
innovation capabilities of the company. Yet the words of AMD’s Global Communications9 in
2013 ironically resonate:
“If you look at what drives innovation, it's the investment and research in high-end
products […] that’s what helps fuel products like the Semi-Customs you see in consoles
and notebooks.”
This is a bad time for the company to be inconsistent with its own innovation strategy. In
fact, empirical evidence10 indicates that for companies competing in technologically mature
industries with limited number of competitors, R&D expenditure has a considerable linkage
to its financial performance and is crucial to avoid bankruptcy. The worrying part is that its
limited financial resources are stretched on several fronts while major competitors outgun its
R&D expenditure.
9 Williams, M. (2013), ‘PS4 and Xbox One High Volumes No Problem for AMD’, GamesIndustry.biz [Online]. Accessed February 14th,
retrieved from: http://www.gamesindustry.biz/articles/2013-06-25-ps4-and-xbox-one-high-volumes-no-problem-for-amd
10 Sueyoshi, T. and Goto, M. (2009), ‘Can R&D Expenditure Avoid Corporate Bankruptcy? Comparison between Japanese Machinery and
Electric Equipment Industries Using DEA–Discriminant Analysis’, European Journal of Operational Research, 196(1), pp. 289-311.
12C. TECHNOLOGY BETS – MISUNDERSTANDING THE POTENTIAL
Oppenheimers Global opportunities Fund defends AMD’s growth prospects based on the
belief that the company possesses a technology edge based on its proven superiority in GPU
technology. Yet their assertion that GPU has the potential to displace CPU for many
consumer electronics products is utterly misleading. A rigorous study 11 rebutted the hype
surrounding GPU’s performance miracle, which found that these processing units are much
closer in performance than previously suggested. Therefore the simplistic conclusion tat GPU
is an all-purpose, superior product is fundamentally flawed fad.
Similarly, ARM architecture, often regarded as the future of microprocessors, is not set to
disrupt the industry in the short-term horizon in which AMD needs a win. Therefore AMD is
making an extremely risky bet with its new “Seattle” server processor ARM-based, aimed at
micro-servers and low-power servers. We do not believe this will be very profitable, even in
the long run because even if ARM-based chips hold 10% of the market in 201712, this will
only represent $1bn of revenues, split between all the companies that make ARM-based
server processors.
11 Lee, V. W.; Kim, C.; Chhugani, J.; Deisher, M., Kim, D.; Nguyen, A. D.; Satish, N.; Smelyanskiy, M; Chennupaty, S.; Hammarlund, P.;
Singhal, R. and Dubey, P. (2010), ‘Debunking the 100X GPU vs. CPU Myth: An Evaluation of Throughput Computing on CPU and GPU’,
ACM SIGARCH Computer Architecture News, 38(3), pp. 451-460.
12 Green, Timothy. 'Some Companies Are Giving Up On ARM Servers: What It Means For Intel And Advanced Micro Devices (AMD,
INTC)', MotleyFool [Online]. Accessed Feb 15th.
13D. MICROSOFT & SONY ILLUSORY WIN: A BITE FROM THE WRONG APPLE
We do not contest that AMD struck a win in the videogame console segment and secured a
much-needed cash influx, strengthening its semi-custom business. However, we contend that
gaming is not the answer to AMD’s woes. The company recently gained marked share from
Nvidia to supply graphics processors to Microsoft’s Xbox and Sony’s PlayStation. As a
result, AMD now supplies all three major console firms (including Nintendo’s Wii U), which
account for almost 25% of its total revenues for 2014 (Bloomberg data).
We admit that AMD definitely devised a better product proposal than Nvidia for their semi-
custom APUs because they had solid expertise and genuine commitment13. However, Nvidia
claims it rejected the proposal because of its unattractive profitability. Nvidia’s senior VP,
Tony Tamasi, remarked14 that:
“We didn't want to do the business at the price those guys [Sony] were willing to
pay. […] Having been through the original Xbox and PS3, we understand the
economics of [console development] and the trade-offs.”
Realistically, AMD should only expect razor-thin margins, as console manufacturers, having
sold their products at a loss in the past, will opt for the most cost-effective option given the
weight of chips in the costs of production.
13 Moorhead, P. (2013), ‘The Real Reasons Microsoft, Sony Chose AMD for the Xbox One and PS4’, Forbes [Online]. Accessed February
14th, retrieved from: http://www.forbes.com/sites/patrickmoorhead/2013/06/26/the-real-reasons-microsoft-and-sony-chose-amd-for-consoles/
14 Baettig, R. (2013), ‘Qualcomm to Replace NVIDIA for Google's Next-Gen Nexus 7’, International Business Times [Online]. Accessed
February 13th, retrieved from: http://www.ibtimes.com/qualcomm-replace-nvidia-googles-next-gen-nexus-7-1136665
14Figure 7. Cost breakdown estimate by subsystem for PlayStation15
Generally console sales slow down in the third/fourth year due to price erosion, and the
console refresh cycle is about 3/4 years. Since the PS4 and XboxOne are in their second year,
we expect this revenue momentum to dissipate from 2017 onwards.
15 IHS (2013), ‘Sony Nears Breakeven Point on PlayStation 4 Hardware Costs’, IHS Pressroom [Online]. Accessed February 14th, retrieved
from: http://press.ihs.com/press-release/design-supply-chain-media/sony-nears-breakeven-point-playstation-4-hardware-costs
15In sum, AMD made a desperate move for revenue. The operating margins on the gaming
consoles are estimated16 at 6% - no wonder why they are the most expensive customers to
supply. By being over-exposed to gaming, AMD found a quick fix to its short-term revenue
shortage. Yet we contend that, strategically, growing the semi-custom business thorough this
market is in fact counter-productive to prevent bankruptcy.
16Chin, S. and Chin, S. (2015), ‘Advanced Micro Devices: 2015 Visibility Still Limited. Maintain Neutral’, UBS Global Research. Accessed
February 13th through Thomson One Banker.
16IV. VALUATION AND FINANCIALS
A. LIQUIDITY ANALYSIS
AMD currently sits on a respectable $805m cash pile17, in the target range of $1bn (optimal)
and $600m (minimum) desired by management. However, it is the first time since 2001 that
AMD has less than $1bn in cash on hand.
Figure 8. Cash & net debt – white line represents Q4 2014 cash position (Bloomberg)
Given our previous analysis, we argue that AMD will not secure sufficient revenue in time to
reverse a worsening liquidity position as the bulk of its obligations fall due from 2018
onwards.
Figure 9. Debt and Interest Distribution (Source: Bloomberg)
17 Advanced Micro Devices Inc. (2015), ‘AMD Reports 2014 Fourth Quarter and Annual Results’ [Online]. Accessed February 14 th,
retrieved from: http://ir.amd.com/phoenix.zhtml?c=74093&p=irol-newsArticle&ID=2008997
17AMD has resorted to emergency asset sales to support earnings. In 2013 alone18, it sold
$233m worth of property in favor of leasing. Gradual asset shrinking has started to reduce
AMD’s collateral basis, therefore increasing the interest rate imposed by debt-holders.
18Advanced Micro Devices, Inc. (2013), ‘Annual Report 2013’ [Online]. Accessed February 12 th, retrieved from:
http://ir.amd.com/phoenix.zhtml?c=74093&p=irol-reportsannual
18Moreover, AMD’s need for cash also led to fatal strategic missteps. By selling IP assets to
Qualcomm19 in 2009, it allowed its rival to build its mobile graphics capabilities from scratch.
No wonder why it finds itself having difficulty producing quality mobile chips.
AMD refinanced a chunk of its debt20 this year but the interest rate resulting from this new
bond issue will stretch its credit line to unsustainable levels. Moreover, AMD will surely avoid
opting for callable notes, as interest rates are expected to increase in the future years (FED
action). In sum, we do not believe that this high leverage is realistically addressable. Inputting
Q4’s results, we obtain a Z double prime Z-score that suggests the possibility of bankruptcy.
19 Qualcomm, (2009) ‘Qualcomm Acquires Handheld Graphics and Multimedia Assets from AMD’ [Press Release]. Accessed on February
12th, retrieved from:
https://www.qualcomm.com/news/releases/2009/01/20/qualcomm-acquires-handheld-graphics-and-multimedia-assets-amd
20
Business Wire, ‘Fitch Rates AMD's Private Placement Senior Notes 'CC/RR4’ [Online]. Accessed February 14th, retrieved from:
http://www.businesswire.com/news/home/20140220006570/en/Fitch-Rates-AMDs-Private-Placement-Senior-Notes#.VOeQF1PF_3o
19B. VALUATION
Using a simplistic Discounted Cash Flow Valuation model, with what we deem conservative
assumptions, we were able to estimate that the fair value of a share of AMD is 0.0035$ as
compared to its actual market price of 3.08$. This highlights a potential downside to the stock
of 99.9% and renders the stock virtually worthless. The figures represented in the table below
are calculated based on revenue assumptions. In 2015 & 2016 revenues are meant to decline
by 2% and 1% respectively due to the poor product pipeline as well as the continued effects
of the recent restructuring within the company. However we do believe that there will be a
reversal in this negative trend from 2018 onwards as the immediate negative effects of
restructuring will be replaced by the positive benefits, expected to be gained from the required
restructuring of the company.
Value based
on
mid-year
Actual Expected discounting*
USD Mn 2010 2011 2012 2013 2014 2015 2016 2017 2018 2019
Revenue 6,494 6,568 5,422 5,299 5,506 5,396 5,342 5,315 5,315 5,342
%growth 1.14% -17.45% -2.27% 3.91% -2.00% -1.00% -0.50% 0.00% 0.50%
NOPAT 815 368 -1,056 103 -155 215 160 159 105 52
%growth -54.85% -386.96% 109.75% -250.49% 238.60% -25.40% -0.50% -33.96% -50.22%
Free Cash Flows 382 623 -624 -87 -251 215 160 159 79 44 58.62
%growth 63.09% -200.16% 86.06% -188.51% 185.59% -25.40% -0.50% -50.63% -43.60%
20Perpetuity Growth Method
Free Cash Flow at year 5 58.62
WACC 8.2%
Perpetuity Growth Rate 2.6%
Perpetuity Value at the end of 5 years 1074.02
Present Value of Perpetuity (@ 8.2% WACC rate) 724.23
Present Value of Future Cash Flows (@ 8.2%WACC rate) 450.52
(=) Current Enterprise Value 1174.75
Short Term Debt 177
(+) Long Term Debt 2035
(-) Cash and Marketable Securities 1040
(-) Current Net Debt 1172
(=) Equity Value 2.752
Shares Outstanding 775
Estimated Value per Share 0.00355
Current Price (USD) 3.08
Estimated Upside -99.9%
21V. CONCLUSION
Time is missing for a successful transformation. With an uncompetitive product portfolio,
several structural challenges coupled with poor positioning (resulting from an ineffective
strategy), little hope is left for AMD given its worsening balance sheet. In our view, the
conditions we outlined support our case that AMD is a true 0 and we do not foresee the
company surviving beyond 2020.
22VI. APPENDIX
A. DCF Model Assumptions
Actual Expected
USD Mn 2010 2011 2012 2013 2014 2015 2016 2017 2018 2019
Revenue [1] 6,494 6,568 5,422 5,299 5,506 5,396 5,342 5,315 5,315 5,342
(-) Cost of Revenue [2] 3,533 3,628 4,187 3,321 3,667 3,453 3,419 3,349 3,349 3,365
Gross Profit 2,961 2,940 1,235 1,978 1,839 1,943 1,923 1,967 1,967 1,976
(-) Operating exenses [3] 2,113 2,572 2,291 1,875 1,994 1,727 1,763 1,807 1,860 1,923
Net Operating income 848 368 -1,056 103 -155 216 160 159 106 53
(-)Tax on operating income 33 0 0 0 0 1 0 0 1 1
NOPAT 815 368 -1,056 103 -155 215 160 159 105 52
(+) Depreciation & Amorization 383 316 260 236 203 216 214 213 213 206
(-) Capital Expenditure 148 250 133 84 95 108 107 106 106 107
(-) Changes in Net Working Capital [4] 667 -185 -308 358 204 108 107 106 133 107
(+) Changes in Net Long Term Deferred Liabilities -1 4 -3 16 0 0 0 0 0 0
Free Cash Flows 382 623 -624 -87 -251 215 160 159 79 44
% of Cash flows to be discounted - - - - 0.39 100% 100% 100% 61%
Discounting Factor Period (Mid-year convention)[5] - - - - 0.2 0.89 1.89 2.89 4.69
Discount factor @ 8.2%WACC - - - - 0.98 0.93 0.86 0.80 0.69
PV of FCF N/A N/A N/A N/A 82 149 137 63 19
EBITDA 1,231 684 -796 339 48 432 374 372 319 259
[1] Revenues: to reiterate the information provided in the report, our estimated growth rates
for revenues vary year on year. According to a Bloomberg consensus estimate, the average
growth rate would be -2.5% over the next 5 year. In order to prove that our arguments hold
even under less realistic and, indeed, optimistic assumptions we used less radical decline
values for revenue. Initially we expect revenues to decline by 2% and 1% respectively
however we expect there to be a reversal in this trend from 2018 onwards. This is based on
the assumption that the company will start to reap the benefits of its restructuring and the
positive effects will overshadow the costs of restructuring which would have become minimal
by 2019.
23[2] Cost of sales: on average over the past 5 years the cost of sales for AMD was 62.25% of
their total revenues. We believe that their new contracts for gaming consoles are more
expensive to maintain than their previous contracts. This assumption is supported by the fact
that Nvidia, the previous contract holder, decided to drop these contracts due to the small
profit margins caused by high cost of sales. Therefore we expect a slight increase in cost of
sales to 64% of revenue in the 2015 & 2016. Under optimistic assumptions we expect AMD
to achieve economies of scale within a short period of 2 years and thus reduce their costs of
sales from 2017 onwards to 63%. We believe any lower figure than that is not justifiable
based on historical figures and would be overly optimistic.
[3] Operating Expenses: our expectations are based on the CEO’s promise to reduce
operational expenses to increase efficiency in order to appease shareholders. We believe that
these claims, while potentially superficial, in the optimistic scenario may deliver cost savings
and therefore we assumed the operating expenses to decrease to about 32% of revenues in
2015. We do not however assume that costs will be maintained this low as the main cost
cutting is arising from decreasing expenditure in R&D which is not sustainable in an industry
so heavily reliant on exactly that. Therefore we believe that once the company starts to
stabilise slightly in terms of revenue, they will start to invest in R&D once again which will
push operating expenses up to around 36% of revenues in 2019 in line with the figures of
2014.
[4] Changes in net working capital: we assume slight positive fluctuations in inventory as
we do not believe that there will be high demand for their products as mentioned throughout
the report. Given higher inventories in the future we believe that changes in net working
capital will also fluctuate and therefore we expect a 3% change in net working capital
between 2017 & 2018 which reflects the decrease in demand shown by an increase in
inventories. This decrease in demand can also be attributed to the current gaming console
products reaching maturity in their life cycles.
[5] Mid-year discounting principle: value calculated as Time weighted average of the last 2
years (2018 & 2019) based on % of FCF discounted from each year. We used mid-year
discounting because the DCF was completed before the end of the financial year 2014 and
therefore values the company at the same time in 2019 before the end of the financial year.
24VII. GLOSSARY OF TECHNICAL TERMS
ARM Architecture: is an instruction set architecture, created by the British company ARM
Holdings, that reduces costs, heat and power use.
APU: an Accelerated Processing Unit is a microchip that combines both CPU and GPU.
CPU: the Central Processing Unit is the brain of the computer. It executes the instructions
users give to the computer.
GPU: the Graphics Processing Units is similar to the CPU but used primarily to work with
graphically intensive tasks, such as 3D modeling.
Thermal Design Power (TDP): the standard measure to determine the maximum amount of
heat generated by the CPU that the cooling system in a computer is required to dissipate in
typical operation.
25You can also read