INVESTOR PRESENTATION - March 2021 - Kamdhenu Group
←
→
Page content transcription
If your browser does not render page correctly, please read the page content below
INVESTOR PRESENTATION
      March 2021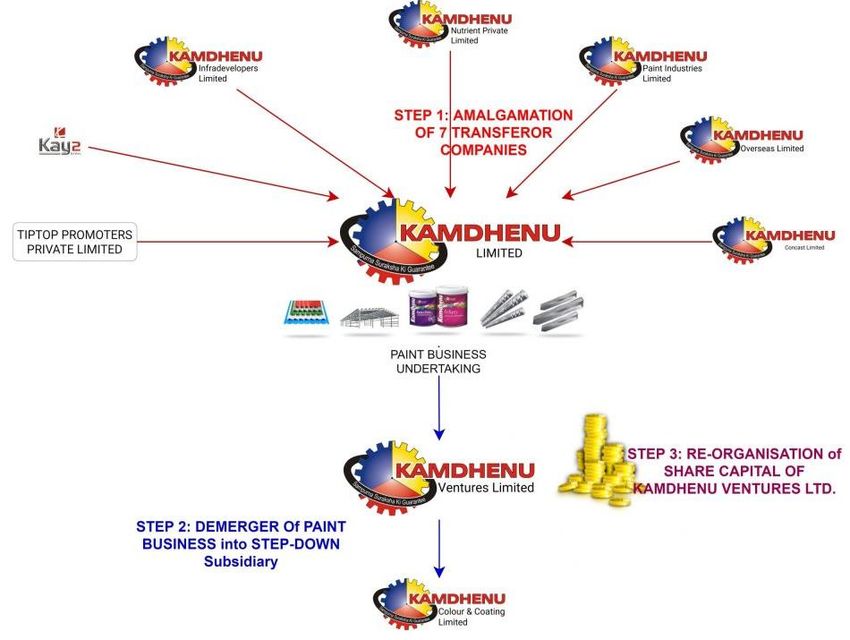
Company Overview

                                                     Brand Turnover
    India's Leading Company                                                       75+ Franchise Units to
      dealing with Manufacturing,
       Distribution, Marketing &
                                           Rs. 10,800+ Crores in FY20             manufacture Steel Rebars,
                                                                              Structural Steel Products & Colour
               Branding                                                             Coated Profile Sheets
                                             Volume Sales growth of 6% with
                                                  24.9 Lakh TMT sold

   KAMDHENU is Largest TMT
   selling brand in India, in the Retail
                                                                                7,500+ Dealers of Steel
                Segment                                                                  across India

     Kamdhenu Paints - COLOUR
        DREAMZ amongst top                                                      4,000+ Dealers of Paint
        decorative paint brands                                                      spread across India

                                                                                                                   2
Sustainable Growth through Creation of Brand ‘KAMDHENU’
                              Brand Turnover                                                                         Brand Expenses
                                                                                                                                                                                 Brand Creation over years

                                                                       12,027

                                                                            10,851*
                                           +17%                                                                                                        103   104

                                                               8,072
                                                                                                                                             69   70
                                                                                                                                        63
                                           5,924 5,968 6,052                                                                     48
                                   5,590
                                                                                                                            39
                           4,735                                                                                     33
                                                                                                              27
                   3,759                                                                                21
                                                                                                  17
           2,897
   2,274                                                                               Rs Cr
   FY10 FY11 FY12 FY13 FY14 FY15 FY16 FY17 FY18 FY19 FY20                                        FY10 FY11 FY12 FY13 FY14 FY15 FY16 FY17 FY18 FY19 FY20
*Sales volume increased by 6% YoY, however Steel prices dropped considerably
during FY20

                                                          Brand Expenses to Overall Brand Sales
                                                                                                       1.1%   1.1%
                                                                                                                                      1.0%
                                                                                                                     0.9%    0.9%
                                                                                               0.8%
                                                   0.7%    0.7%    0.7%     0.7%      0.7%                                                                         ▪   Synergistic Relationship with Dealers and
                                                                                                                                                                       Distributors
                                                                                                                                                                   ▪   Providing Franchisee Partners with Marketing
                                                                                                                                                                       Strategies
                                                   FY10    FY11    FY12     FY13      FY14     FY15    FY16   FY17   FY18    FY19     FY20                         ▪   Enhances Brand Equity & Pan-India Visibility

                                                                            Kamdhenu Brand Commands Premium over Best Local TMT Players across the Country                                                            3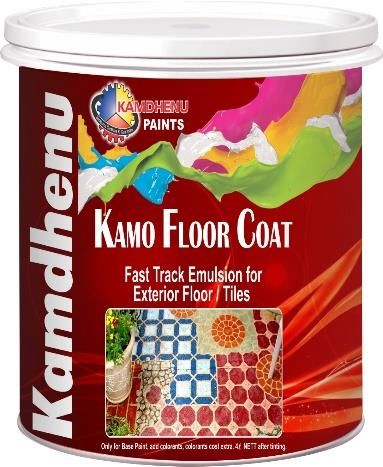
Our Journey

                    ▪     1995- Production of                        ▪      2006- IPO – Listed at       ▪     2016- Name Changed from Kamdhenu
                          Steel Bars                                        NSE/BSE                           Ispat Ltd. to Kamdhenu Ltd. –
                                                                                                              positioned as branding and marketing
                    ▪     2000- Certified for                        ▪      2008- Forayed into                company
                          international quality                             Decorative Paints
                          standards ISO 9001 &                              Business – COLOUR           ▪     2017- Launched Kamdhenu Nxt – TMT
                          BIS 1786:1985                                     DREAMZ                            interlock steel for next generation

            1994                   1995-2000            2001-2005                   2006-2010               2011-2015                  2016-2017          2018-2020

   ▪   Incorporation of                                                                             ▪       2013- Launched Kamdhenu                  ▪   2018 – Board
       Kamdhenu Ispat                             ▪   2004- Innovated                                       SS10000 premium TMT                          recommended to Hive-
       Limited                                        franchisee business                                   bars                                         off of the Paint Division
                                                      association model
                                                                                                    ▪       2014- Launched Kamdhenu                  ▪   2019 - Own
                                                  ▪   2005- Adopted Modern                                  Structural Steel                             Manufacturing
                                                      Technology of CRM                                                                                  Expansion
                                                      Belgium To Manufacture                        ▪       2015- Became largest TMT
                                                      TMT Steel Bars                                        selling brand in India                   ▪   2020 - Launched
                                                                                                                                                         Kamdhenu PAS10000
                                                                                                                                                         Steel Bar

                                                                                                                                                                              4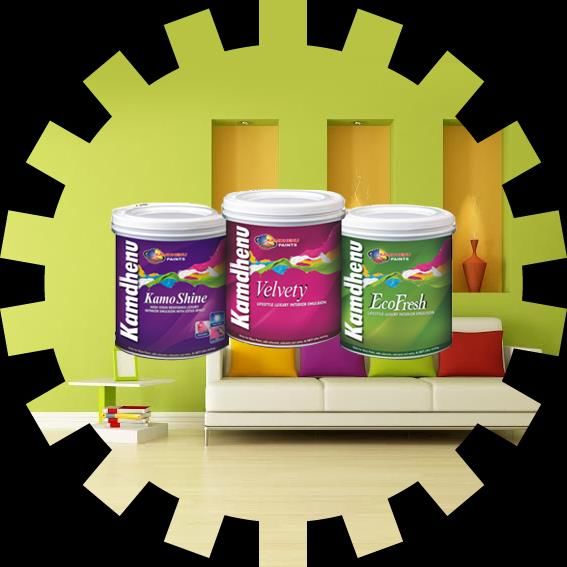
Strong Product Portfolio for all User Segments

             Kamdhenu TMT Bars                        Kamdhenu – Nxt TMT                             Kamdhenu – PAS 10000
                                                 Next Generation Interlock Steel and has      Unique Rib design which gives locking of 360
        TMT Bars are thermo-mechanically-
                                                   got the angular double rib design            degree. Its alloy gives it better rust-proof
           treated through leading world
                                                    having obtained all the rights to          qualities and gives capability to bear more
        tempcore based technology for high
                                                 manufacture, market and sell double rib       weight. Along with that it also gives double
                   yield strength
                                                               TMT bar                           earth-quake prevention to the building

          Kamdhenu Structural Steel                     Kamdhenu Colour Max                  Kamdhenu Paint – COLOUR DREAMZ

       Produced under franchisee agreement                                                    Offers a basket of 40+ SKUs of the high
                                                  Colour Coated profile sheets – versatile
        multitude of special contours such as                                                  end Exterior and Interior Emulsions,
                                                    color metal products make dream
       angles, channels, beams, flats, round &                                                Designer Finishes, Stainers, distempers
                                                     building look stylish and elegant
                       square                                                                                   etc.

                                                                                                                                               5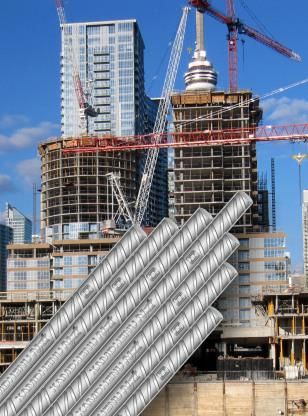
Awards & Acknowledgements

                                                                         World's Greatest Brands
 World's Greatest Brands    Asia's Most Promising   Indian Power Brand
                                                                         2017-18 amongst Asia
  2015 amongst Asia &      Brand 2015-16 by World       2016 Award
                                                                         & GCC for Steel as well
          GCC               Consulting & Research
                                                                           as Paints Division
                                 Corporation

                                                                                                   6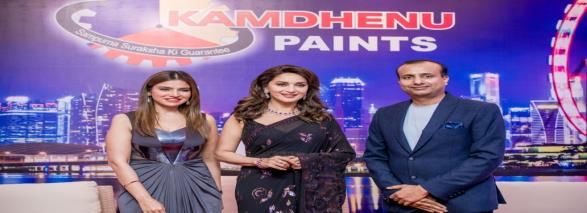
Strong Thrust on Advertising & Promotion Spends
                     Notable Celebrity Affiliations                                  ‘TARGET KA BADSHAH’ – Mega Paints Event for Dealer &
                                                                                                     Distributor Awards
                                                                                      ▪ Award functions and cultural events on annual basis
  Shilpa Shetty   Emraan Hashmi     Madhuri Dixit    Kanika Kapoor    Preity Zinta    ▪ Notable celebrity affiliations through brand promotions, event participations
                                                                                        help strengthen emotional connect with dealers where relationships were
                                                                                        formative

 Kangana Ranaut   Malaika Arora      Sonam Kapoor       Dia Mirza     Sonu Nigam

 Karishma Tanna      Govinda        Kareena Kapoor   Karisma Kapoor   Anil Kapoor

                                   Brand Promotions, Event Participation
                                  Have Helped Strengthen Dealer Connect
                                            & Expand Visibility

                                                                                                                                                                        7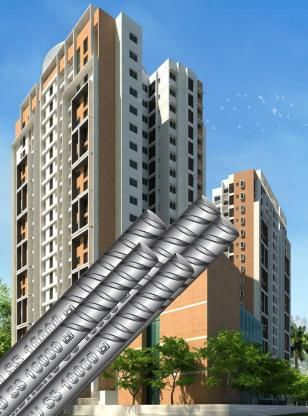
Brand Promotions – Print, Outdoor Media

                                    Medium                                                 Partner Newspapers

                                    National
                                   Newspapers
         Print Media
                                    Regional
                                   Newspapers
                                                     Rajasthan Patrika                   (Jansatta)              (Punjab Kesari)

      Outdoor Campaigns

                                  Kamodual Luxury – ‘Luxury Ka Double Dose’
                                   ➢ Social media campaigns to educate consumers about benefit of its products
                                   ➢ Enable people to make the right choice with Kamodual luxury
       Digital Campaign
                                   ➢ Campaigns to push purchases before festive season

                          Prominent Pan-India Brand with Wide Presence in Electronic, Print & Outdoor Media                        8
Experienced Board of Directors

   Mr. Satish Kumar Agarwal              Mr. Sunil Kumar Agarwal                 Mr. Saurabh Agarwal              Mr. Sachin Agarwal
 Chairman & Managing Director             Whole Time Director                    Whole Time Director              Whole Time Director

  Mr. Mahendra Kumar Doogar     Mr. Ramesh Chand Surana      Mr. Ramesh Chandra Jain         Mrs. Nishal Jain   Mr. Harish Kumar Agarwal
           Director                     Director                    Director                    Director                   CFO

                                                                                                                                           9
Steel Business
India’s Largest Branded TMT Bars Player

                                 Converted steel commodity into branded product becoming India’s
                         BRAND   Largest TMT Steel Bars brand (Thermo Mechanically Treated) with in-
                                 house capacity of 156,000 MT p.a.

                                 State-of-the-art Tempcore Technology from CRM, Belgium                     KAMDHENU
                                                                                                             PAS 10000
                                 44 Franchisee Units under “KAMDHENU Brand” steel rebars with the
                                 production capacity of 38 Lacs MT p.a.

                                 4% less weight per meter than normal and 20% more strength
                                                                                                           KAMDHENU Nxt and
                                                                                                         KAMDHENU PAS 10000 are
                                 Huge dedicated marketing network of 7,500 dealers                        Premium Product Brands

                                 Has 9 grades and used in all types of construction works ranging from
                                 Buildings to Dams
                                                                                                                                   11
Pan-India Decentralized Manufacturing
Decentralized Outsourced Manufacturing Model
▪ Communication : Working with a local manufacturer makes
the communication process easy. Real time conversations
result in a better understanding of the specifics and
preferences of the products by the Customer
▪ Low Minimums: Even the smaller quantity of the orders are
delivered efficiently. This will help us penetrate even in the
smaller Tier II & III cities of the Country
▪ Quick Turn-Around Times : Turnover time for
manufacturing is faster with diversified manufacturers. The
demand forecast is accurately known and the deliveries are
planned accordingly
TMT Plant (Owned) ▪ Transportation Costs : Saving in Freight & Transportation
75+ 11,500+ 225+ Cost is reduced to a large extent with manufacturing near to
the End Customer
Franchisees Dealers Distributors
Franchisee Units
Map not to scale. All data, information and maps are provided “as is” without warranty or any representation of accuracy, timeliness or completeness.
12Asset Light Business Model…
BRAND LEADERSHIP in STEEL RETAIL
Kamdhenu Group
Innovator – We do Research and Hierarchy of Marketing Network
introduce new products based on
Customer Requirement in the Market
Every franchisee is allowed to sell its product in a particular
region which is its designated geographical area. Franchisee has
Franchisee to sell through particular distributors.
Every distributor is also assigned a particular region which is its
designated geographical area
Distributor
Dealer
Franchise
Distributor
Every distributor shall facilitate the supply to a set of dealers in
the said designated geographical area on exclusive basis
Franchise Dealers / Distributors Dealer
Manufactures products based Committed chain of Dealers
on technology, design and and Distributors connected
quality specifications provided with Franchisee / Sales Depot
by Kamdhenu created by Kamdhenu
13…Creates Long-term Sustainability
Benefits to Kamdhenu Win–Win for Franchises
Expertise & Experience Quality Assurance
Easy availability of product in all Enhanced revenue and increase in Provide franchise units with Assurance of quality from
parts of the country Profitability due to Royalty earned expertise and experience for an Kamdhenu gives comfort to end
efficient business customers
Ready Marketplace Centralized Publicity
Saving Transportation cost Increase in Market share Ready Platform in niche market Assistance to Centralized
giving facelift to unorganized Publicity support of Kamdhenu
sector / new enterprise
Brand “KAMDHENU” Bank Funding
Improvement in Brand Equity Ensure quick delivery of Products Franchisee can leverage brand Presence and brand grants them
to consumers “KAMDHENU” easy & zero hassle availability of
bank funding
Capacity Utilization
Marketing Network
Efficient handling large volumes Bargaining Power Provides exceptional
Access to Marketing Network
across India distinctiveness and enables them
to earn premium on their products
thereby leading to higher capacity
utilization
14Huge Capacities at ZERO Capex
Manufacturing Capacities - Franchisees Company Owned - Manufacturing, R&D and T&D
Steel Division : Bhiwadi
Production Capacity : ▪ Increased the production Capacity from 72,000 MT to 156,000 MT per
▪ Steel Rebars – 38 Lacs MT per annum annum to support innovation and product development
▪ Structural Steel – 5 Lacs MT per annum ▪ Innovation Centre – Research & Development and new products /
designs based on customer requirement are introduced
▪ Coloured Coated Profile Sheets – 2.5 Lacs MT per annum
▪ Plant used as training centre for all technical staff deputed at the
franchisee's unit - trained on various technical, qualitative and
commercial aspects
▪ Revenue from Own manufacturing for FY20 stood at Rs. 334 cr
Product wise Total Number of Franchises
76 Regional Split
10
Installed Capacities (MT) Royalty Income (FY20)
22 West
44 West North
18%
28% 25% North
34%
45.5 L Rs 94 cr
17% 32%
South East
30% 16%
Steel Rebars Colour Coated Structural Steel Total South
Profile Sheets East
15Structural Steel - Fastest growing segment
Kamdhenu Limited manufactures Structural Steel under franchisee arrangement
Description Special Contours
▪ One such product which continues to
▪ Angles
pioneer new innovations
▪ Channels
▪ Beams
▪ It is counted as one of the most
▪ Flats
recycled material on Earth, made of
▪ Round & Square Pipes
88% cast-off product, fully recyclable
in the future
End-user Industries Advantages
▪ Industrial structures, flyovers, ▪ High Strength and High Ductility
bridges, dams, transmission line ▪ Superior Bend ability, Weld ability and
towers, underground platforms in Straightness
metro railways and other ▪ Available in every state of India
reinforcement structures across ▪ Economic in Application
the country ▪ Lower sectional weight and higher strength
technique
▪ Highly cost-effective and save steel
16Core Steel TMT Business
Revenue Break Up
Royalty Income through
Own Manufacturing Return on Capital Employed (ROCE)^ Debt to Equity Ratio
Franchisee Sales
+29%
CoVID-19 impact CoVID-19 impact + 290 bps 0.6
97.7
88.3 +15% 25.1% 24.4%
76.2 75.9* 22.9% 22.2% 0.4
20.0%
0.3 0.3
24.3 22.2 20.5* 23.5 0.2
35.6*
14.7*
Q3 FY20 Q4 FY20 Q1 FY21 Q2 FY21 Q3 FY21 Q3 FY20 Q4 FY20 Q1 FY21 Q2 FY21 Q3 FY21 Mar-17 Mar-18 Mar-19 Mar-20 Sep-20 Mar-17 Mar-18 Mar-19 Mar-20 Sep-20
-15% -18%
^Excluding Exceptional Items
245.9 72.0
209.2* 58.7*
1 Lower Working
Increased Focus on Own Capital Leading to
Manufacturing & Franchisee Better Capital
9M FY20 9M FY21 9M FY20 9M FY21 Business Efficiencies
2
Trading Sales
Improved Return
-99%
Ratios
-100%
79.6 237.0
Recouped Busines Strategy of 3
Ability to Innovate
Reducing B2B Trading Sales Newer Products and
0.4 1.4 Gain Market Share
Q3 FY20 Q3 FY21 9M FY20 9M FY21
17
*Lower sales due to CoVID-19 impact in Q1 & Q2 FY21 All numbers on standalone basis and in Rs. CrStrong Growth Outlook in Steel Business
Increased Capacity TMT Increase in Brand Revenue (Rs. Crs) Increase in Royalty Income (Rs. Crs)
33 10,851 94
CAGR +12% CAGR +15%
CAGR +21%
11 3,759
8
1,808 16
8
2007 2012 2020 2007 2012 2020 2007 2012 2020
50 Lakh Rs.22,000 cr Rs. 150 crs
Metric Tonne by FY23 by FY23
by FY23
Targeting EBITDA of ~Rs 100 cr in Steel Business by FY23 18Paints Business
Kamdhenu Paints – Leading Brand in Indian Decorative Paints Segment

                   Inception                                                                                                      Revenue Growth of ~6x

       Kamdhenu Paints – COLOUR DREAMZ                                                        SKUs                                             +494%

          2008 set up its own unit for                                                                                                                  226
          manufacturing of decorative Paints                                         40+ SKUs across 10+ product
              under its flagship brand                                                          categories
                                                                                                                                       38
                                                                                                                                                                     Rs cr
               Market Position
                                                                                                                                      FY09              FY20
                                                                                             Dealers
                 Top Paints
          Amongst the                                                                                                                                         +45%
                                                                                                                                               CoVID-19 impact
             Company in India                                                      ~4,000+ dealers associated with the     75.4                                  71.2
                                                                                                                                    64.2
                                                                                                 company                                                49.2*
                                                                                                                                             37.6*
                      Capacity
                                                                                              Painters                                                                       Rs cr

               Installed capacity of                                                                                      Q3 FY20 Q4 FY20 Q1 FY21 Q2 FY21 Q3 FY21
                                                                                 20,000+ Registered painters of which
               30,000^ KL p.a.
                                                                                 5,000+ are painters actively procuring                         -2%
                                                                                                                                       161.5           157.9*
                     Offerings
      •    Exterior & Interior Emulsions                                                  Sales Depots
                                                                                                                                                                     Rs cr
      •    Water based primers
      •    Wood Finishes                                                                                                             9M FY20           9M FY21
      •    Aluminium Paints                                                          33 Sales Depots across the country        *H1FY21 impacted by CoVID-19 outbreak
      •    Textured & Designer Paints

                                                                                                                                                                         20
^Re-aligned capacities for manufacturing of Premium and Texture Paint Products
Extensive Product Portfolio
Emulsions Primers
Type Premium Regular Type Premium Regular
Water Based
Exterior
Kamo Dual Primer Kamo Sealer
Weather Weather Kamo
Supreme Classic Shield
Solvent Based
Wood Primer Red Oxide Universal Primer (ST)
Kamo Hi Shine Velvety Sheen & Shine
Interior Distempers
Distempers
Kamo Beauty Kamo Silky Kamo Blaster Kamosilky Bunty Kyson
Dual Range of Products
Enamels
Kamolite
Kamo Dual Gold (High Gloss Enamel)
Diversified and Eco-friendly Product Portfolio 21Extensive Product Portfolio
Stainers, Specialty and Other Coatings Construction Chemicals
Kamoproof ALW
Designer & Kamocrete CRP WATER PROOFING
Kamo Super
Concrete Repair COMPOUND FOR
Textured Paints Mettalica
Product CEMENT MORTAR AND
CONCRETE
Wall Putty
NC Lacquer Melamine Kamoplast Wall Putty Kamocare Wall Putty
Kamwood Wood
Coatings
Other Products
NC Sanding
Sealer
Kamdhenu PU Kamoshine Luster Aluminum Paints, Kamoshine GP Aluminium Paint, Road Marking
Paints, Kamolite Roof Paint, Kamolite Heat Resistant Paint, Kamolite Stoving Paint &
Kniefing Paste Filler
New Products
Machine
Colorants Kamotint –
Universal Colorants
&
Stainers
Stainers Kamo Star
Exterior
Kamo Superstar Kamorich Weather Classic Max Kamo Star Putty Kamo Star Interior
Emulsion
Diversified and Eco-friendly Product Portfolio 22Niche Products with High Potential
Premium Wood Finish Water Proofing Solutions Floor Coat Dual Primer
➢ Kamwood Premium Wood finishes ➢ Our specialized water proofing ➢ Kamo Floor Coat (KFC) is a ➢ It's a unique primer which can be
works to protect and decorate solutions are an aid to the specialized paint (based on Fast applied on the walls at exteriors and
wooden surfaces household and industrial demands Track Emulsion) specially formulated interiors both
➢ It is clear in colour and highlights the for Exterior / terrace floor tiles,
➢ We have set up its ultra-modern ➢ It gives dual benefits to dealers as
natural grain of wood, enhancing the cement tiles and any walkways or
mechanized division for the they have to keep lesser inventory at
look and feel of the surface plain cemented surfaces
development of variety of shops followed with to the end
➢ The coat is moisture, fungus, heat construction chemicals ➢ Aimed at the segment having
consumer who doesn't have to buy
resistant adding to the life of the two different primers for the same
independent houses, bunglows,
wood surface ➢ Strict surveillance on behalf of house, it will be economical to his
hotels, cooperative housing societies
proficient engineers with technical pocket as well
➢ It can be applied to interiors and and resorts for giving a better looks
exterior expertise is done so as to ensure the to the cement floors
fineness of the product quality
23Focused on Premiumization of Portfolio
Revenue Breakup
FY10 FY15 FY20
10%
➢ Entry strategy in initial years focused on affordable variants like
21% 22%
10% powder-based paints, putty, distempers etc. to first gain the
53%
confidence and loyalty of the dealer & painter network
58%
26% 20%
80%
➢ After having achieved rapid growth and a good base and with
dealer relationships cemented, the brand decided to prioritize
Water Based Products Powder Based Products Solvent Based Products
premium offerings, gradually reducing the low-priced dealers to
focus on premium dealers
Average Selling price per KG/Ltr
+103% ➢ With renewed focus on premium products, innovative ideas such
75 as designer galleries, rewarding schemes & incentives and a
58 refreshed branding & advertisement campaign, the company has
37 been able to achieve 43% share of premium products and
increased the dealer count to 4,000+
FY10 FY15 FY20
Reducing Low-Priced Products to Focus on Premium Products 24Well-Entrenched and Highly Incentivised Dealer Network
Dealers Revenue Split (FY20) Dealer Split (FY20)
6% ➢ Kamdhenu’s sales are more
10% 8%
+28% 17% concentrated in North & East
India owing to a denser older
4,129 12%
dealer base in the region
3,230 30% 28%
226 cr 17% 4,129 ➢ The current dealer proportion in
other regions is higher than the
revenue contribution of these
regions, providing scope for
42% significant volume expansion in
FY10 FY20 30%
the future on existing
Strong Relationship with Dealers investments
Centre North West
Target linked incentives in form of gifts-in-kind, gift vouchers, East South
coupons
Best-in-class dealer margins on all products of paints products Penetration can be easily tripled in 5 years
An annual awards program to appreciate and encourage of
healthy competition amongst the dealers (Target Ka Badshah)
➢ Current scale at 4,000+ dealers of 50,000+ dealers in India
➢ Penetration can be easily tripled in 5 years through new dealers across
Company sponsored trips to domestic and overseas tourist regions
circuits ➢ Better understanding of various mini-markets, presence in all key states and
strong track record with existing dealers will drive next phase of dealer
Invitation to company’s cultural events, get-togethers etc. addition
A Targeted Dealer Network with a Core Focus on Premium Products 25Prominence in India’s Emerging Cities
Prominence in Tier I, II & III Cities through 33 Sales Depots
Focused strategy to set base in the smaller Indian towns identifying an
~70% of India’s urban population underserved gap in the paint industry
resides in Tier II & III cities, where
majority of Kamdhenu paints’
customer base is present
Leveraged Group’s deep networks through the steel business to attract
professional and loyal dealers and painters in these towns, creating a niche
market for itself
Kamdhenu commands strong market share in many sections of the North and
East markets
Dealer Split (FY20) Revenue Split (FY20)
11% 14% 13%
20%
4,129 226 cr
Kamdhenu Paints also
commands a stronghold in the
vast rural Indian hinterland 69% 73%
Tier I Tier II Tier III
Map not to scale. All data, information and maps are provided “as is” without warranty or any representation of accuracy, 26
timeliness or completeness.State-of-the-art Manufacturing Facilities & Infrastructure
Manufacturing Facilities – Quick Facts Robust Tinting Infrastructure
Production Capacity Revenue Potential ➢ 1,600+ tinting machines installed at dealer outlets to make wide range of shades
Facilities
(in KL) (Rs cr) by mixing Colorant from Computerized tinting machine with the paint bases
Own Production Plant at Bhiwadi, ➢ Minimizes inventories and ensures just-in-time delivery of the precise amount of
Rajasthan, capacity re-aligned for paint
30,000 450
manufacturing of Premium and
Texture Paint Products ➢ Reduces disposal of excess paint as hazardous waste
➢ Reduces labor requirements and space for handling and storage of paint inventory
Contract Manufacturing at Udaipur,
Punjab and Ghaziabad for Putty, 36,000 150 ➢ Reduces procurement costs for new paint
Distempers, Primers and Enamels
Total 66,000 600 Update on Paint Business
➢ Post the fire incident in Q1 FY20, the Company outsourced production from third party
manufacturers, ensuring quality standards
➢ Re-aligned capacity at Own Manufacturing plant for Premium and Texture Paint Products
➢ Operations at the Company’s owned Paint plant have resumed since Aug’20 and are
➢ Quality assurance at Outsourced Units by deputing own technical team at the manufacturer’s proceeding smoothly
plant
➢ Phase II of restoration of remaining building / plant & machinery to be completed by
the end of Q4 FY21 and full-fledged operations are expected to commence from Q1
➢ Optimal utilization of the existing capacity coupled with a strong distribution network could
FY22 to drive next level of growth
result in immediate capture of a significant market share
27Growth Strategies & Next 5-yr Vision
Rapid Revenue Growth Potential with Margin Expansion
Premiumization of
Portfolio Revenue (Rs cr) EBITDA Margin (%)
Urbanisation & Rising Increasing Density of Dealer
11%
Disposable Incomes Network
+28% 1,000 8%
450
226
Housing for All by 2022 Aggressive Investments
into Building Brand -1%
Equity FY20 FY23 FY26 FY20 FY23 FY26
Growth
Drivers
Expand pan-India visibility through aggressive spend on
Shortening Re-painting Launch of Innovative advertising and promotions
Cycles Products
Increase sales penetration in South India by tie up with
contract manufacturer
Potential Expansion into
Newer Product Segments Gaining Market Share from
Unorganised Players Targeting urban markets through institutional sales
Tapping Under-
Penetrated Markets
Robust hiring plan, ERP tools and IT-aided distribution
infrastructure
28Scheme of Arrangement
Rationale for Proposed Demerger
➢ Better management focus & operational flexibility and facilitate
KAY2 STEEL LTD
businesses to independently pursue their growth plans through
organic / inorganic means
TIPTOP PROMOTERS ➢ Enable both companies to raise necessary funds, invite strategic
PRIVATE LTD
investors, employ specialized manpower, etc., thereby creating a
platform to pursue next level of growth
➢ Strengthen, consolidate and stabilize the business of these
companies and facilitate further expansion and growth of their
Paint business will be demerged
respective businesses
into Kamdhenu Colour and Coatings
Ltd, a subsidiary of Kamdhenu
➢ Facilitate administrative convenience, ensure optimum
Ventures Ltd (KVL); KVL will be listed
on the stock exchanges utilization of various resources and result in significant
operational efficiencies
➢ Aimed at maximising shareholder value providing them an
opportunity to participate in the business of their choice based
Colour and
Coatings Ltd
on their risk-reward profile
✓ Amalgamation of Kamdhenu Concast Ltd, Kamdhenu Overseas Ltd, Kamdhenu Paint Industries Ltd, Kamdhenu lnfradevelopers Ltd, Kamdhenu Nutrients Pvt Ltd, Kay2 Steel Ltd
and Tiptop Promoters Pvt Ltd with Kamdhenu Ltd
✓ To simplify and streamline the promoter shareholding structure across multiple companies
✓ To remove multiple layers of the holding companies in tune with the Government policy
✓ Result in significant reduction in multiplicity of legal and regulatory compliances which at present is required to be made separately by the Transferor Companies and the
Transferee Company
29Overall Financials
Q3 & 9M FY21 - Statement of Profit & Loss^

  Particulars (Rs. Crs.)                                      Q3 FY21                  Q3 FY20                     YoY                   Q2 FY21                    QoQ                  9M FY21*             9M FY20
  Net Revenue from Operations                                    192.8                   255.4                     -25%                   146.4*                     32%                     427.3             716.4
  Cost of Material Consumed                                      104.0                    86.4                                              78.8                                             216.3             244.7
  Purchase of Stock-in-Trade                                     15.8                    110.1                                              14.0                                              39.3             310.8
  Change in Inventories                                           8.2                      -8.7                                              0.5                                              17.3             -29.1
  Total Raw Material                                             128.1                   187.8                                              93.3                                             273.0             526.4
  Employee Expenses                                              12.8                     13.3                                              12.3                                              35.0             38.1
  Other Expenses                                                 38.2                     42.2                                              32.1                                              90.0             116.2
  Other Income                                                    1.4                      0.3                                               1.1                                              3.4               0.5
  Depreciation                                                    2.2                      2.1                                               2.1                                              6.4               6.3
  EBIT                                                           12.9                     10.4                     25%                       7.7                     67%                      26.3             29.9
  Finance Cost                                                    3.3                      3.2                                               3.9                                              10.9              8.5
  Exceptional Items                                               0.0                   -24.4**                                              0.0                                              0.0              -25.1
  Profit Before Tax                                               9.6                     -17.2                      -                       3.8                    150%                      15.4              -3.7
  Tax                                                             2.5                      -4.2                                              1.3                                              4.3               -3.3
  Profit After Tax                                                7.2                     -13.0                      -                       2.5                    186%                      11.1              -0.4
  EPS                                                            2.68                     -4.91                                             0.94                                              4.15             -0.16

  Profit Before Tax (PBT) excluding
                                                                  9.6                      7.2                     35%                       3.9                    150%                      15.4             21.4
  exceptional items
 ^On Standalone Basis; *Performance during H1FY21 impacted by CoVID-19 outbreak

 **The Company had very old pending excise & service tax matters pertaining to the period from 2004 to 2012 under various stages of dispute totalling to ~ Rs.49 crores. In order to clear the old disputes
 and litigation, the Company had decided to settle all these pending matters by opting for this Sabka Vishwas (Legacy Dispute Resolution) Scheme, 2019. The Company accounted for an amount of
 Rs.24.39 crores towards the settlement of various old excise and service tax dispute.                                                                                                                                  31
Balance Sheet as on 30th September, 2020^
Particulars (Rs. Crs.) Sep 2020 Mar 2020 Particulars (Rs. Crs.) Sep 2020 Mar 2020
Equity Share Capital 26.9 26.5 Non Current assets
Property, Plant and Equipment's 76.7 79.4
Other Equity 156.7 154.2
Capital Work in Process 1.5 1.1
Total Equity 183.7 180.7 Right of Use Assets 5.9 6.8
Financial Liabilities Goodwill on Consolidation - -
Borrowings 6.9 0.4 Financial Assets
Lease Liabilities 5.8 6.6 Investment in Subsidiary 0.0 0.0
Investments 2.5 2.7
Other Liabilities 7.6 7.3
Loans 0.0 0.0
Provisions 4.2 4.0
Other Financial Assets 2.9 2.9
Deferred Tax Liabilities (Net) 5.4 5.6 Other Non-Current Assets 11.8 10.9
Total Non Current Liabilities 29.9 23.9 Total Non Current Assets 101.3 103.8
Financial Liabilities Current Assets
Inventories 66.4 78.2
Borrowings 99.8 117.5
Financial Assets
Lease Liabilities 1.7 1.7
Investment 4.7 3.5
Trade Payables 87.4 122.1 Trade Receivables 187.5 212.1
Other Financial Liabilities 15.8 8.7 Cash and Cash Equivalents 2.6 2.7
Other Current Liabilities 9.4 8.9 Bank Balances 2.4 2.3
Provisions 0.6 0.6 Loans 0.5 0.5
Other Financial Assets 37.7 42.2
Current Tax Liabilities (Net) - -
Other Current Assets 25.2 18.8
Total Current Liabilities 214.7 259.4 Total Current Assets 326.9 360.3
Total Equity and Liabilities 428.2 464.0 Total Assets 428.2 464.0
^On Standalone Basis 32Consistent Financial Performance^
Revenue Breakup - FY13 EBIT PBT PAT
33% +109%
+274%
+364%
36.6
548 cr 24.7
22.3
67%
17.6
6.6
4.8
Steel Paints
FY13 FY20 FY13 FY20* FY13 FY20*
*Excluding Exceptional Items & Tax calculated at normal tax rate after adjusting for deferred taxes
Revenue Breakup – FY20 Return on Equity Return on Capital Employed Debt to Equity Ratio
(ROE) (ROCE) (D/E)
+ 530 bps + 70 bps
23% 0.9
12.4% 12.4% 17.3%
15.9%
10.9%
12.3% 0.6 0.7 0.6
962 cr 11.6%
0.5
7.1% 9.0%
4.3%
77%
Mar-17 Mar-18 Mar-19 Mar-20 Sep-20
Steel Paints Mar-17 Mar-18 Mar-19 Mar-20* Sep-20 Mar-17 Mar-18 Mar-19 Mar-20* Sep-20
33
Rs.in Crs ^On Standalone Basis *Excluding Exceptional ItemsHistorical Profit & Loss Trend^
Particulars (Rs. Crs) FY20 FY19 FY18 FY17 FY16 FY15 FY14 FY13
Revenue 962.0 1,232.4 1,179.8 824.9 841.2 968.0 921.7 547.5
Total Raw Material Cost 710.5 972.9 968.8 634.8 667.8 821.9 793.8 427.8
Employee Expenses 50.2 47.2 40.5 34.0 30.9 24.1 21.9 21.2
Other Expenses 156.9 158.8 126.8 123.5 110.9 92.1 81.0 77.5
Other Income 0.6 0.4 0.7 0.5 0.5 0.4 0.4 0.9
Depreciation 8.4 7.4 7.7 7.7 5.2 5.4 4.7 4.3
EBIT 36.6 46.5 36.7 25.5 26.9 24.9 20.6 17.6
Finance costs 11.9 11.5 12.3 13.7 14.5 13.0 11.4 11.0
PBT 24.7 34.9 24.4 11.7 12.4 11.9 9.2 6.6
Tax 2.4# 12.5 8.7 3.6 4.3 3.9 3.3 1.8
PAT 22.3 # 22.5 15.7 8.1 8.1 8.0 6.0 4.8
# Excluding Exceptional Items & Tax calculated at normal tax rate after adjusting for deferred taxes
^On Standalone Basis 34Safe Harbor
This presentation and the accompanying slides (the “Presentation”), which have been prepared by Kamdhenu Limited For further Information, please contact :
(the “Company”), have been prepared solely for information purposes and do not constitute any offer,
recommendation or invitation to purchase or subscribe for any securities, and shall not form the basis or be relied on
in connection with any contract or binding commitment what so ever. No offering of securities of the Company will be
made except by means of a statutory offering document containing detailed information about the Company.
This Presentation has been prepared by the Company based on information and data which the Company considers
reliable, but the Company makes no representation or warranty, express or implied, whatsoever, and no reliance shall CIN: L27101HR1994PLC092205
be placed on, the truth, accuracy, completeness, fairness and reasonableness of the contents of this Presentation. This Mr. Harish Kumar Agarwal
Presentation may not be all inclusive and may not contain all of the information that you may consider material. Any
Group CFO & Head-Legal
liability in respect of the contents of, or any omission from, this Presentation is expressly excluded
hkagarwal@kamdhenulimited.com
www.kamdhenulimited.com
Certain matters discussed in this Presentation may contain statements regarding the Company’s market opportunity
and business prospects that are individually and collectively forward-looking statements. Such forward-looking
statements are not guarantees of future performance and are subject to known and unknown risks, uncertainties and
assumptions that are difficult to predict. These risks and uncertainties include, but are not limited to, the performance
of the Indian economy and of the economies of various international markets, the performance of the industry in India
and world-wide, competition, the company’s ability to successfully implement its strategy, the Company’s future levels CIN: U74140MH2010PTC204285
of growth and expansion, technological implementation, changes and advancements, changes in revenue, income or Mr. Varun Divadkar / Ms. Khushbu Shah
cash flows, the Company’s market preferences and its exposure to market risks, as well as other risks. The Company’s +91 9763702204 / +9820601181
actual results, levels of activity, performance or achievements could differ materially and adversely from results varun.divadkar@sgapl.net /
expressed in or implied by this Presentation. The Company assumes no obligation to update any forward-looking khushbu.shah@sgapl.net
information contained in this Presentation. Any forward-looking statements and projections made by third parties www.sgapl.net
included in this Presentation are not adopted by the Company and the Company is not responsible for such third party
statements and projections.
35You can also read