HALF-YEAR RESULTS PRESENTATION - FOR THE SIX MONTHS ENDED DECEMBER 31, 2021 February 24, 2022
←
→
Page content transcription
If your browser does not render page correctly, please read the page content below
HALF-YEAR RESULTS
    PRESENTATION
FOR THE SIX MONTHS ENDED DECEMBER 31, 2021

                          February 24, 2022
Disclaimer
This presentation contains "forward-looking statements" relating to VivoPower International PLC (“VivoPower”) within the meaning of the Private Securities Litigation
Reform Act of 1995, including, but not limited to, estimates relating to our future energy development and investment activities. You can identify these statements by
forward-looking words such as “may,” “expect,” “anticipate,” “contemplate,” “believe,” “estimate,” “forecast,” “intends,” and “continue” or similar words. Forward-
looking statements may include for example statements about potential revenue from electric light vehicle (“e-LV”) distribution agreements, future market outlooks,
the benefits of the events or transactions described in this communication and the expected returns therefrom. You should read statements that contain these words
carefully because they discuss future expectations; contain projections of future results of operations or financial condition; or state other “forward-looking”
information. These forward-looking statements are based on our current assumptions, expectations and beliefs and involve substantial risks and uncertainties that
may cause results, performance or achievement to materially differ from those expressed or implied by these forward-looking statements. Factors that could cause or
contribute to such differences include, but are not limited to: (a) our ability to obtain financing for our projects, our customers or our general operations; (b) our ability
to build, sell or transfer projects; (c) regulatory changes and the availability of economic incentives promoting use of renewable energy; (d) global economic, financial
or commodity price conditions; (e) our ability to develop technologically advanced products and processes; (f) our ability to successfully expand our e-LV and
sustainable energy solutions (“SES”) offerings and gain market acceptance of our offerings; and (g) other risks discussed in filings we make with the Securities and
Exchange Commission (“SEC”) from time to time. Copies of these filings are available online from the SEC or on the SEC Filings section of our website at
www.vivopower.com. By their nature, forward-looking statements involve risks and uncertainties because they relate to events, competitive dynamics, and depend on
the economic circumstances that may or may not occur in the future or may occur on longer or shorter timelines than anticipated or not at all. Although we believe that
we have a reasonable basis for each forward-looking statement contained in this presentation, we caution you that forward-looking statements are not guarantees of
future performance and that our actual results of operations, financial condition and liquidity, and the development of the industry in which we operate may differ
materially from the forward-looking statements contained in this presentation. All forward-looking statements in this presentation are based on information currently
available to us, and we assume no obligation to update these forward-looking statements in light of new information or future events.
Certain financial information contained in this presentation, including Adjusted EBITDA, is not calculated in accordance with International Financial Reporting
Standards as issued by the International Accounting Standards Board (“IFRS”) and may not be comparable to similar measures presented by other entities. These
measures should not be considered in isolation or as a substitute for measures prepared in accordance with IFRS. For a reconciliation of Adjusted EBITDA to net
income/loss, see slide 18. For a reconciliation of Group Adjusted (Underlying) EPS (“Earnings per Share”) to Basic EPS, see slide 19.

                                                                                      1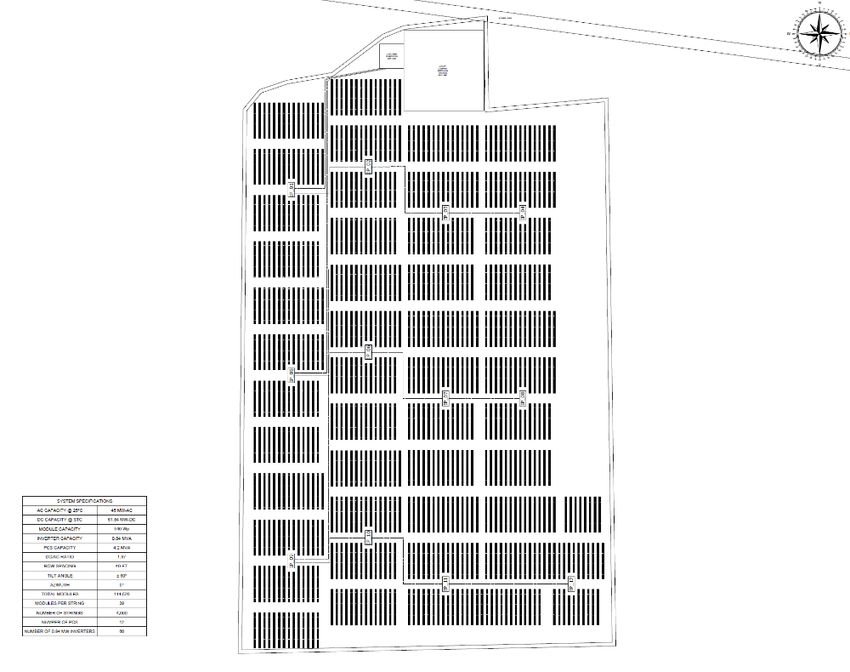
VivoPower’s Customer Value Proposition | Sustainable Energy Solutions (SES)
Our core purpose is to provide our customers with turnkey decarbonisation solutions that enable them to achieve net zero carbon status

                           Electric Vehicles                                                          Critical Power

                              • Design and development of ruggedised,                                   • Electric refit of customer premises
                                customised and/or off-road electric light                               • Installation and maintenance of EV
                                vehicles (e-LVs), electric drive and power                                charging stations
                                systems
                                                                                                        • Emergency backup and uninterruptible
                              • Rent or lease e-LVs to customers (opex) or                                power supply
                                sell e-LVs if customer prefers (capex)
                                                                                                        • Control systems, switch rooms, and
                              • Fleet monitoring, repair and maintenance                                  switchboards
                              • Training and change management

                            Solar Energy                                                               Battery Tech

                              • Design, build, and maintenance of                                       • Store excess solar energy and increase
                                renewable generation and microgrids                                       total renewable penetration
                              • Large-scale, small-scale, rooftop, and                                  • EV Battery as a Service (BaaS) model:
                                ground mount installations                                                  – Vehicle battery leasing
                              • On- or off-site options based on site                                       – Battery repair and maintenance services
                                availability and suitability
                                                                                                            – Battery second-life applications to
                              • Financing solutions (lease or PPA)                                            support “whole-of-life” value

                                                                             2
H1 FY2022

STRATEGIC & OPERATIONAL
REVIEW
Executive Summary | Strategic progress but results affected by extended COVID-19 lockdowns
Revenue decline due to harsh                           •       Six-month revenue decreased 11% year-on-year to $18.9m as Australia’s strict COVID-19 lockdowns extended through the majority of the
COVID lockdowns (AUS & EU)                                     period, causing delays to scheduled works for the Aevitas business units as well as significantly curtailing e-LV kit deliveries

                                                       •       Gross profit decreased by $2.8m year-on-year to $0.5m (excluding other income), attributable to COVID-19 driven drop in revenues, and
Gross profit and GP margin                                     $1.1m one-off COVID-driven cost overruns on Bluegrass solar project due to state border closures
declined due to revenue drop
and Bluegrass project                                  •       GP Margin declined to 3% versus 16% year-on-year due to COVID-19 related compliance costs, increases in supply chain costs and one-off
                                                               Bluegrass solar project COVID driven cost overruns

EBITDA & Operating Losses                              •       Adjusted EBITDA1 declined to ($4.9m) versus $1.2m for H1 FY21, while Operating Loss increased to ($7.3m) versus ($0.4m) for H1 FY21
due to COVID-19 lockdown                               •       Losses driven by reduced lockdown period revenues and Bluegrass solar project COVID driven cost overruns, in combination with
impact and growth opex                                         budgeted increases in corporate costs and growth opex to support hyperscaling of the Tembo business

Balance sheet cash decline but                         •       Cash balance decreased from $8.6m at June 30, 2021 to $3.3m as of December 31, 2021 (but has since increased post balance date)
continued support from key                             •       Decline primarily reflects investment in growth opex (for Tembo), one off COVID-19 losses attributable to Bluegrass solar project and other
shareholders                                                   COVID compliance costs for Aevitas, as well as slow down in collections due to COVID-19 lockdowns

                                                       •       Tembo distribution partner network expanded to 6 continents, with a VivoPower subsidiary established in the United Arab Emirates (UAE)
Key strategic initiatives
                                                       •       Tembo development of 72 kWh battery kit being prioritised (significant upgrade on previous 28 kWh battery solution)
executed upon despite COVID-
19 disruptions                                         •       Full control of US solar JV secured, rebranded to Caret, with LOI signed to launch renewable-powered digital asset mining business, Caret
                                                               Decimal (involving an initial contribution of 206.5 MW-DC at a valuation of $20m, versus book value of $12.1m for all of Caret portfolio)

B Corp status recertified and                          •       B Corp recertification successfully secured following mandatory re-assessment review
top global impact company                              •       Recognised as a top global impact company for the 2nd year in a row by the Real Leaders Impact Awards
award for 2nd year in a row                            •       Global winner of the 2021 Turnaround Management Association Transaction of the Year Award (sub-$50m revenue category)

        Notes:
        (1) For reconciliation of Adjusted EBITDA to IFRS net loss see slide 18.                              4
        All amounts shown are unaudited.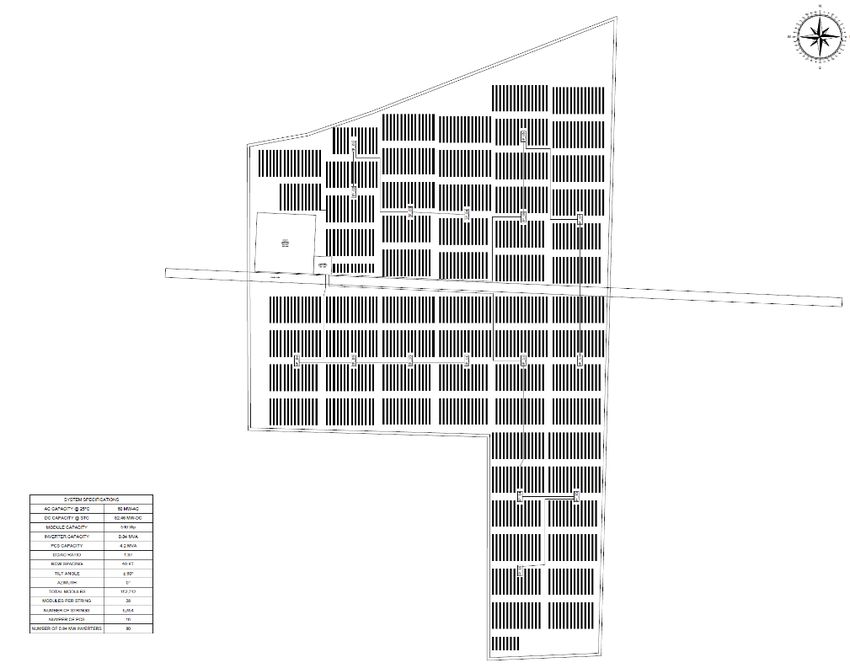
CY2022 Updates | Key markets reopening, business execution & metrics improving
Aevitas pipeline growing with     •   Head of work is up 72% year on year, reflecting pent-up work and additional projects in the solar, data centre and infrastructure sectors
cashflows improving               •   Cashflow is improving with material cash inflows since mid-January 2022, following COVID-19 lockdown related collection slowdown

                                  •   Tembo will move to expanded facility next to Eindhoven airport in the Netherlands on May 1, 2022
Tembo new facility secured to
                                  •   New facility comprises 29,795 square feet of space, representing a 113% increase over the current facility
accommodate growth
                                  •   The new facility can potentially accommodate assembly of up to 5,000 e-LV kits annually, depending on impact of microfactory strategy

                                  •   Toyota Motor Corporation Australia (TMCA) collaboration has experienced delays, but negotiation of an agreement with TMCA for the
TMCA collaboration and Artic          exclusive supply of Landcruiser electric kits focused on the mining sector is ongoing
Trucks LOI remain on foot
                                  •   Artic Trucks LOI extended to June 30, 2022, to accommodate further assessment of the new next generation 72 kWh battery platform

Non-dilutive funding              •   UK: R&D tax offsets worth up to 33% of R&D spend and other UK Government mobility, automotive, innovation and green grants
workstream continues on           •   EU: EIC (European Innovation Council) grants of up to US$2.8m and equity investment to fund scale up costs of up to US$17m
multiple fronts                   •   Global: working capital financing facilities (debtor finance, supply chain, trade finance)

GB Auto LOI has been              •   Completion was originally targeted for February 28, 2022, but significant disruption since December 2021 has caused delays to the due
extended, given COVID-19              diligence program
lockdown delays                   •   Due diligence is now on foot and the LOI is expected to be extended, providing a buffer for any further disruption

Caret Decimal has executed        •   Caret Decimal has entered into an LOI to acquire Decimal Digital (comprising 1,000 latest generation mining rigs) for an initial
LOI to acquire Decimal Digital,       consideration of $14m, accelerating the path to revenue generation for Caret Decimal
with fund raising commenced       •   Fund raising efforts have commenced at the Caret Decimal level with specialist capital raising advisers engaged to raise $50m+

                                                                                       5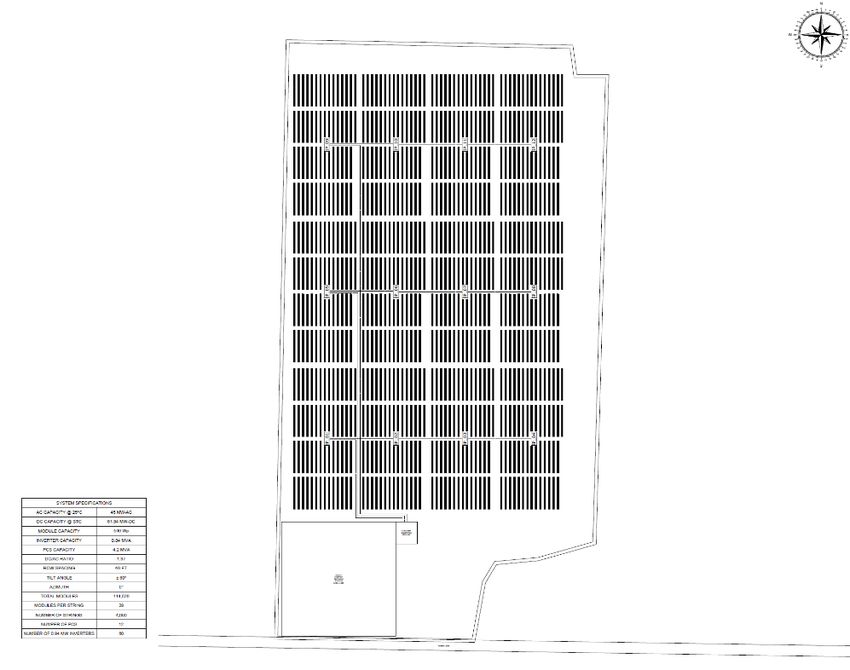
FY2022 Key Objectives | On track to drive execution as key markets reopen

  Expand SES pipeline                                Grow Aevitas         Deliver e-LV orders           Advance e-LV product       Cement partnerships             Execute on
     and delivery                                   business unit to      on schedule and on             design, supply, and       with TMCA and global       corporate initiatives
      capabilities                                   support SES                budget                    quality initiatives           distributors           to support growth

                                                                                                         Complete engineering
 Complete SES project(s)                      Complete all scheduled         Complete "build                                       Execute MSA to expand       Maximise value of US
                                                                                                         and mass production
   through Tottenham                          work (including delayed    slot" strategy to enable                                   and deliver on TMCA          solar portfolio via
                                                                                                           model for e-LVs
  Hotspur partnership                                projects)            just-in-time assembly                                         relationship            strategic initiatives
                                                                                                            Expand supply
  Build engineering and                        Expand collaboration      Execute to necessary                                     Grow global distribution       Complete digital
                                                                                                         chain network for key
   sales teams to grow                       including with SES + e-LV   assembly timelines to                                    network to all continents    transformation and
                                                                                                             components
       SES pipeline                           businesses to accelerate     deliver on orders                                         by end of CY2021         workflow automation
                                                      growth
                                                                                                        Increase R&D to improve
  Enhance capabilities                                                       Collaborate with                                     Secure commitments for      Retain focus on B Corp
                                                                                                           e-LV hardware and
through acquisitions and                         Complete strategic      distribution partners to                                 an additional 5,000+ e-LV   impact score and triple
                                                                                                            software to OEM
     joint ventures                             review (M&A and JVs)       deliver conversions                                         units globally              bottom line
                                                                                                               standards

        Notes:                                                                                      6
        Green text indicates objectives completed to date.
VivoPower’s Impact | B Corp retained & global impact leadership recognised again
VivoPower has retained its B Corp Certification and ranked among the top impact companies globally for the 2nd year in a row
Ranked 7th in the Construction,
B Corporation accreditation Energy, and Facilities category and Turnaround/Transaction of the Year
achieved and maintained since 2018 #89 out of 201 overall in the Real Award Winner 2020
Leaders Impact Awards 2022
Part of a global movement of people GlobalElectric Vehicles | Deliveries constrained by COVID-19 lockdowns & supply chain issues
Tembo is VivoPower’s electric vehicle unit focused on customised and ruggedised applications (including off-road)
OVERVIEW OF TEMBO E-LV MAJOR MILESTONES SUPPORT SALES, R&D AND PRODUCTION GROWTH
• Netherlands-based specialist battery-electric and off-road vehicle company Jul 2021 Sep 2021 Dec 2021 Feb 20221
• Global sales and distribution channels across four continents
• Services a diverse range of sectors – from mining, infrastructure and utilities to Mongolian Multi-national LOI executed to Expanded Tembo
government services, game safari and humanitarian aid – by providing customised light distribution deal distribution deal acquire GB Auto Eindhoven facility
electric vehicles, often for rugged applications signed with Bodiz signed with GHH Group in Australia announced
• After purchasing 51% of Tembo in November 2020, VivoPower completed the acquisition
of the remaining 49% in February 2021 Assembly and Greater R&D and
350 e-LV kits 3,000 e-LV kits
customer growth manufacturing
H1 FY2022 REVIEW GLOBAL DISTRIBUTION NETWORK EXPANDED TO EVERY CONTINENT
• Revenues of $0.9 million from the delivery of kits to key customers Nordics
• Revenues were impacted by operational disruption and delays in the assembly and 800 e-LV kits
Arctic Trucks
delivery of vehicle kit orders due to COVID-19 lockdowns
• Underlying EBITDA loss of ($2.3) million reflects growth in opex investment Canada
• Work has commenced on the next generation 72 kWh battery platform (a material 1,675 e-LV kits
Mongolia
upgrade on the previous generation 28 kWh battery platform) Acces Industriel
350 e-LV kits
• Distribution partner network expanded to 51 more countries and 3,350 additional kits Bodiz
• LOI announced to acquire GB Auto, with a view to expanding assembly capabilities in Australia
Australia 2,000 e-LV kits
Key: GB Auto
■ FY21
■ FY22 (Bodiz) 50 Countries
■ FY22 (GHH) 3,000 e-LV kits
GHH
Notes:
(1) Post half-year reporting period event. 8
All amounts shown are unaudited.Critical Power | Extended Australian lockdowns adversely impact revenues & margins
The Aevitas businesses in Australia deliver specialised, site-specific electrical and power generation infrastructure to optimise energy usage
OVERVIEW OF AEVITAS | J.A. MARTIN AND KENSHAW H1 FY2022 REVENUE CONTRIBUTION BY INDUSTRY
• Headquartered at Newcastle in the Hunter Valley region, Australia’s most densely
populated industrial belt Other, 8%
• Trusted power solutions provider to over 700 active government, commercial and Trades Services, 9%
industrial customers in some of Australia’s largest and fastest growing industries Solar, 40%
including data centres, solar PV, mining and resources, and health and aged care
• Responsible for delivering electrical services and infrastructure to support VivoPower’s Mining &
J.A. Martin Resources,
EV and SES offerings, including on-site renewable generation, batteries and microgrids,
20%
EV charging stations, and emergency backup power solutions
H1 FY2022 REVIEW
Agriculture, 24%
• The Aevitas businesses recorded $18.0m in revenue for the period, down 14% year-on-
year (y-o-y), primarily due to impacts of the COVID-19 pandemic on supply chains and
ongoing delays in the commencement and continuation of projects
Other, 21%
• Gross profit was $0.8m compared to $3.3m y-o-y, with gross margins decreasing to 4.4%, Data Centres,
down from 15.8% due primarily to one off $1.1m COVID related loss on Bluegrass solar 31%
project availability and costs of complying with costly COVID-19 public health directions
• Underlying EBITDA (excluding one-off Bluegrass overruns) was $1.3m, down 62%, Kenshaw Manufacturing, 7%
reflecting lower gross profit margins and increased overheads
• Awarded electrical works contract for the 119 MW-DC Hillston Solar Farm bringing total Infrastructure, 9%
of completed and contracted solar farms to over 450 MW-DC and completed the high- Mining &
profile supply and install of electrical generators to vaccination hub Resources, Health Care and Social
21% Assistance, 9%
Notes: 9
All amounts shown are unaudited.SES | Expanding project delivery and technology solution capabilities
First full-suite SES project with Tottenham Hotspur F.C. progressing
OVERVIEW OF VIVOPOWER SES
• Focused on delivering full-suite, holistic SES to industrial customers and other large
energy users comprised of three key elements:
̶ EV and battery leasing
̶ Critical power “electric-retrofit” of customers’ sites to enable optimised EV
battery charging, encompassing renewables, battery storage, and microgrids
̶ EV battery reuse and recycling
• SES draws on the combined experience and capabilities of VivoPower’s Critical Power
Services businesses in Australia, J.A. Martin and Kenshaw, as well as Tembo e-LV
HY FY2022 REVIEW
• Newly-established segment has generated immaterial revenues and not incurred any
significant costs to date
• Work ongoing to finalise design for Stage 1 SES project with Tottenham Hotspur F.C.
following successful completion of feasibility studies in June 2021
• Preliminary dialogue begun with major mining and port infrastructure organisations to
conduct feasibility studies for whole-of-facility electrification projects
• Memorandum of Understanding signed with Relectrify, a leading supplier of battery
energy storage systems utilising second-life EV batteries, with the collaboration
extended to explore future redeployment of Tembo batteries
• Software tools developed to allow customers to assess Total Cost of Ownership (TCO)
and ROI for adoption of light electric vehicle fleets
10Solar | US portfolio ownership fully secured, rebranded & Power-to-X strategy progressed
Vivo Solar is now Caret Solar, with LOI to contribute 206.5 MW-DC of advanced projects (out of 682 MW-DC) to Caret Decimal at valuation of $20m
OVERVIEW OF CARET SOLAR U.S. SOLAR PORTFOLIO SUMMARY
• Diversified portfolio totaling 38 solar projects in 9 states across the U.S. with combined
potential electrical generating capacity of 1.8 GW-DC Total VVPR Net
Portfolio % VVPR
̶ 12 projects in two states totaling 682 MW-DC being actively developed 87
MW-DC Holding MW-DC
̶ 1.1 GW-DC of previously discontinued projects being re-evaluated for development
• Management of former joint venture taken over by VivoPower in June 2020, and 100% Original JV 1,844 50% 922
595
ownership secured in July 2021, rebranding the business as Caret LLC
Current Active
• Focus is on maximising value across the portfolio, prioritising development of projects 682 100% 682
Projects
that are most economically attractive and advanced in their development
Total MW-DC By State
HY FY2022 REVIEW CARET DECIMAL BUSINESS MODEL
• Secured settlement to gain full ownership of remaining 50% of portfolio for $1
Solar Projects Mining Data Centre BTC + Transaction Fees
• Invested $0.5m in projects during the period to progress key initiatives:
̶ New land lease terms negotiated for 8 sites, substantially reducing operating costs B T
̶ Property tax abatement negotiations progressed with local authorities
T T
̶ Interconnection processes advanced with utilities and ISOs B
• Power-to-X strategy announced and being executed upon to maximise value: B T
̶ Excess renewable energy to power energy intensive applications such as
T
cryptocurrency mining and green hydrogen production
̶ Significant increase in interest from cryptocurrency mining hosting firms and miners Renewable solar energy powers crypto mining
̶ LOI executed to contribute an initial 206.5 MW-DC of projects at $20m valuation to operations, with option to sell electricity to grid
form Caret Decimal, a renewable powered digital asset mining business during high demand / high power price periods
Notes: 11 Main Grid
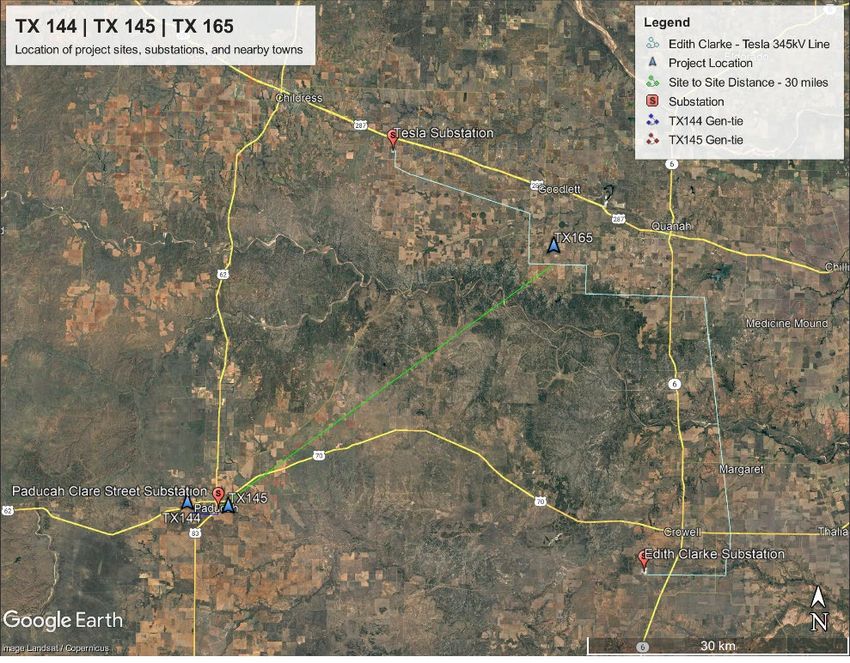
All amounts shown are unaudited.Caret Decimal | Solar sites for cryptocurrency mining
Under the LOI, Caret would contribute three initial solar projects totalling 206.5 MW-DC to Caret Decimal
TX-145
Location Cottle County, TX
Power Capacity (MW-DC) 61.84
Lot Size 350 acres
Target COD September 2023
TX-144
TX-165 Location Cottle County, TX
Power Capacity (MW-DC) 82.46
Lot Size 421 acres
Target COD October 2023
TX-165
Location Hardeman County, TX
TX-144 TX-145
Power Capacity (MW-DC) 61.84
Lot Size 336 acres
Target COD December 2023
12TX-145 | Site 1, Cottle County
Key Project Specifications
Solar Farm Number of Containers1 14
Data Centre
Initial Containers
Data Centre Containers
Initial Data DC Capacity @ STC 61.84 MW-DC
Centre
Containers Module Capacity 540 Wp
Data Centre
Expansion Inverter Capacity 0.84 MVA
Capacity
PCS Capacity 4.2 MVA
DC/AC Ratio 1.37
Row Spacing 40 feet
Tilt Angle ± 60°
Azimuth 0°
Total Modules 114,520
Modules per String 28
Number of Strings 4,090
Number of PCS 12
Number of 0.84 MW Inverters 60
Notes: 13
(1) Number of containers based on Tessarack TESSA-V6-50-3.4 (Capacity: 1 container per 3.45 MW)TX-144 | Site 2, Cottle County
Key Project Specifications
Solar Farm Number of Containers1 18
Initial Data DC Capacity @ STC 82.46 MW-DC
Centre
Containers Module Capacity 540 Wp
Data Centre
Expansion Inverter Capacity 0.84 MVA
Capacity
PCS Capacity 4.2 MVA
Initial Data Centre Containers
DC/AC Ratio 1.37
Row Spacing 40 feet
Tilt Angle ± 60°
Azimuth 0°
Total Modules 152,712
Modules per String 28
Number of Strings 5,454
Number of PCS 16
Number of 0.84 MW Inverters 80
Notes: 14
(1) Number of containers based on Tessarack TESSA-V6-50-3.4 (Capacity: 1 container per 3.45 MW)TX-165 | Site 3, Hardeman County
Key Project Specifications
Solar Farm Number of Containers1 13
Initial Data DC Capacity @ STC 61.84 MW-DC
Centre
Containers Module Capacity 540 Wp
Data Centre
Expansion Inverter Capacity 0.84 MVA
Capacity
PCS Capacity 4.2 MVA
DC/AC Ratio 1.37
Row Spacing 40 feet
Tilt Angle ± 60°
Azimuth 0°
Total Modules 114,520
Modules per String 28
Number of Strings 4,090
Initial Data Centre Containers
Number of PCS 12
Number of 0.84 MW Inverters 60
Notes: 15
(1) Number of containers based on Tessarack TESSA-V6-50-3.4 (Capacity: 1 container per 3.45 MW)H1 FY2022 FINANCIAL REVIEW
Profit and Loss Summary for the Half-Year Ended December 31, 2021
Profit & Loss (US$m)                                                H1 FY20221            H1 FY20211 Comments
Revenue
 Critical Power Services                                                        18.0                  20.9 Decrease due primarily to strict COVID-19 lockdowns in Australia causing delays to scheduled works
 Solar                                                                               -                  0.1 Prior year included solar farm income from Australian operations (now sold)
 Electric Vehicles                                                                0.9                   0.4 Revenue adversely impacted due to development and deliveries delayed by COVID lockdowns in Australia & Netherlands
Group revenue                                                                   18.9                  21.3
Gross profit
 Critical Power Services                                                          0.8                   3.3 Decrease in GM% from 15.8% to 4.4% due to one-off Bluegrass project overruns of $1.1m and other increased COVID-19
                                                                                                            related compliance costs and supply chain / logistics related cost increases
 Solar Development                                                                   -                  0.1 Income from solar farms in Australia
 Electric Vehicles                                                              (0.3)                 (0.1) Negative margin on low volumes and increased supply chain and logistics costs due to COVID-19
Group gross profit                                                               0.5                    3.3
Adjusted (Underlying) EBITDA 2                                                 (4.9)                    1.2 Decline reflects a reduction in revenues, gross profit and an increase in headcount to support growth
Restructuring & other non-recurring costs                                       (0.5)                 (1.9) Current period comprises one-off restructuring and remediation on legacy Tembo EV kits
Net finance income, expense & tax                                               (2.2)                   1.9 Reflects $4.8m foreign exchange losses and $0.5m increase in interest expense due to non-recurrence of Aevitas hybrids
                                                                                                            credit adjustment in the prior period, offset by a $1.2m decrease in income tax expense
Group (Loss) / Profit after tax                                              (10.0)                  (0.4) Decline due to $5.0m decline in EBITDA, $5.3m foreign exchange losses and interest increase, offset by $1.5m saving in
                                                                                                           non-recurring costs and tax charges
Group Basic EPS (dollars)                                                  ($0.49)               ($0.03)
Group Adjusted (Underlying) EPS 3                                          ($0.47)                  $0.10

         Notes:
         (1) All amounts shown are unaudited.
         (2) Adjusted (Underlying) EBITDA = Earnings before interest, taxes, depreciation and amortization, non-cash based share
              compensation, impairment of assets, impairment of goodwill, and restructuring and other non-recurring costs. See
              reconciliation of non-IFRS measures on slide 18.
         (3) Adjusted (Underlying) EPS = Earnings per share adjusted for restructuring and other non-recurring costs. See reconciliation of
              non-IFRS measures on slide 19.                                                                                                  17
         Numbers may not compute precisely due to rounding.
Reconciliation of Adjusted (Underlying) EBITDA to IFRS Financial Measures
For Half-Year Ended
Non-IFRS Financial Measures (US$m) December 31, 20211 December 31, 20201
Net profit/(loss) (10.0) (0.4)
Income tax expense (0.8) 0.4
Net finance expense/(income) 3.0 (2.3)
Share-based compensation (non-cash portion) 1.3 0.7
Restructuring & other non-recurring costs 0.5 1.9
Depreciation and amortization 1.2 0.9
Adjusted (Underlying) EBITDA (4.9) 1.2
Notes:
(1) All amounts shown are unaudited. 18
Numbers may not compute precisely due to rounding.Reconciliation of Adjusted (Underlying) Earnings per Share to IFRS Financial Measures
For Half-Year Ended
Non-IFRS Financial Measures (US$m – except where indicated otherwise) December 31, 20211 December 31, 20201
Net (loss)/profit for the period (10.0) (0.4)
Restructuring & other non-recurring costs 0.5 1.9
Adjusted (underlying) net profit/(loss) for the period (9.5) 1.5
Weighted average number of shares used in computing earnings per share (shares) 20,443,121 14,941,061
Group Basic EPS (dollars per share) ($0.49) ($0.03)
Restructuring & other non-recurring costs per share (dollars per share) $0.02 $0.13
Group Adjusted (Underlying) EPS (dollars per share) ($0.47) $0.10
Notes:
(1) All amounts shown are unaudited. 19
Numbers may not compute precisely due to rounding.Balance Sheet Summary as at December 31, 2021
Balance Sheet (US$m) Dec 31, 20211 June 30, 2021 Comments
Project investments 13.6 12.5 $1.1m increase comprises intangible development costs of $0.5m in Caret, $0.6m in Tembo
Other non-current assets 41.1 40.0 Increase of $1.1m comprises $2.0m capex of leased property in Kenshaw and $0.5m increase in deferred tax
assets related to pre-production losses in Tembo, less $1.1m depreciation and amortisation
Unrestricted cash 3.3 8.6 Reflects operating cash outflow and growth related expenses for Electric Vehicles business unit
Other current assets 13.8 15.4 $1.6m reduction due to timing of customer receipts in Critical Power
Total Assets 71.8 76.5
Current loans & borrowings (2.8) (1.0) Increase of $1.8m comprises primarily shareholder loans
Long term loans & borrowings (22.4) (22.1) Increase of $0.3m due to recognition of additional $0.7m lease liabilities following Kenshaw premises move,
offset by $0.4m repayments of other borrowings
Other liabilities (13.1) (13.0) $0.1m increase comprises $0.6m reduction in corporation tax provision in Critical Power, $0.5m reduction in
litigation provision following ex CEO claim settlement, $0.5m reduction in Tembo deferred income offset by
$1.0m growth in payables in Critical Power and $0.4m additional accrued shareholder loan interest
Total Liabilities (38.3) (36.1)
Net Assets 33.5 40.4 Decrease primarily due to losses incurred in the period
Net Debt 2 21.9 14.5 Increase due to reduction in cash levels as a result of investment for growth
Notes:
(1) All amounts shown are unaudited.
(2) Equals current and non-current debt obligations less unrestricted cash. 20
Numbers may not compute precisely due to rounding.THANK YOU Q&A
You can also read