Coronavirus Disease 2019 (COVID-19) Outbreak and Investing
←
→
Page content transcription
If your browser does not render page correctly, please read the page content below
Coronavirus Disease 2019 (COVID-19) Outbreak and
                         Investing
                                                     March 3, 2020
                                                       by Team
                                                  of Applied Finance
The US equity markets have fallen sharply the past week on concerns of coronavirus diseases 2019. This novel
coronavirus affects the respiratory system, was first identified in Wuhan, China more than two months ago, and has now
spread to all major economies globally. The headlines have been worrying and often sensational, as many unknowns
remain, and the American public is just starting to wrap their arms around the prospect that their life might be severely
impacted by the virus spread. However, it is important for all of us to understand the facts of this unfolding crisis, maintain a
healthy investment horizon, and act rationally. Though it is still too early to draw any definite conclusion, we understand
that COVID-19 is a highly contagious but non-life threatening disease to a majority of the public. We believe its overall
impact on China’s economy will be substantial but transitory, and its impact on the US economy will likely be rather limited.
Last week, sentiment has turned from being complacent (pricing this as an isolated China event impacting mainly travel
related industries) to being overly pessimistic (pricing this as a multi-year negative for most large cap US corporations).
Similar to our thoughts during the Great Recession, we believe the right approach to navigate this period of heightened
volatility is to stay calm, maintain a long-term investment horizon, invest in high quality, undervalued companies, and
exercise disciplined rebalancing. This should remain particularly true for the Valuation 50 and Dividend strategy investors.

Background Information about COVID-19

     Contagion: The current understanding is the virus mainly spreads from person-to-person who are in close contact
     with one another (within about 6 feet). It is transmitted via respiratory droplets, and when the droplets land in the
     mouths or noses of people who are nearby or possibly directly inhaled into the lungs. It may also be possible that a
     person can get COVID-19 by touching a surface or object that has the virus and then touching their own mouth, nose,
     or possibly their eyes. The COVID-19 virus is very contagious and because it is novel, few people have immunity
     against it. The odds for cured patients to be infected again are very low, however.
     Severity: The mortality rate is currently around 3.5% for China which has ~80,000 of confirmed cases, and 4% for
     Hubei Province, the epicenter, which has ~65,000 confirmed cases. The mortality rate will likely decline, however, as
     many early deaths were a result of patients’ inability to get care in an overcrowded healthcare system in Hubei and
     healthcare providers’ lack of experience treating the diseases in the early days of the outbreak. The virus does put
     certain people under more risk, including people with compromised lung capacity due to a combination of poor air
     quality and smoking, and the elderly (70 and older), and the sick who have cardiovascular disease, diabetes, chronic
     respiratory disease hypertension, and cancer. According to the data from the Chinese Centre for Disease Control and
     Prevention (CCDC), ~81% of the cases have been mild, ~14% have been severe, and ~5% critical. Rare deaths were
     reported among mild and severe cases, while the fatality rate was nearly 50% among critical cases.
     Treatment: There is currently no cure or specific antiviral treatment recommended for COVID-19. People with mild
     symptoms mostly recover without needing special treatment. For severe cases, treatment would include care to
     support vital organ functions. Separately, Gilead Sciences (GILD) announced last Wednesday it had begun two
     Phase 3 studies of its experimental antiviral treatment remdesivir, which is being tested as a Covid-19 treatment in
     two trials in China and one trial in the U.S. Health officials at WHO have expressed optimism about the possibility of
     remdesivir as a treatment for Covid-19 patients. Moderna (MRNA) developed an experimental coronavirus vaccine,
     which the company had shipped to the NIAID for testing in humans last week. The Moderna vaccine won’t be ready
     for mass scale utilization until at least spring/summer of 2021, however, even if it is proved effective.
How bad will the disease be in the US?

    We don’t think it will be nearly as bad in the US as in Wuhan and Hubei, China, when COVID-19 becomes a
    community transmitted disease. It has been widely reported and admitted by the head of China’s National Health
    Commission’s investigation into the outbreak, that the COVID-19 infection rate could have been significantly lowered if
    the Chinese governments had implemented strict quarantine measures in early December of 2019 or early January of
    2020. The Wuhan government didn’t even admit the coronavirus can spread from human to human or alert its citizens
    about the outbreak until around January 20, a few days before the abrupt lock down of the city before the Chinese new

                                      Page 1, © 2020 Advisor Perspectives, Inc. All rights reserved.
year. The Chinese government lost 1-2 months of precious time to effectively contain the virus, before enormous
humanitarian tragedies engulfed Wuhan and Hubei.
For the US, we have bought at least 1 month time since late January to prepare. A travel ban on China has been in
place for 4 weeks and quarantines have been exercised on all confirmed cases. Among the ~85 confirmed cases so
far, nearly half of the cases are U.S. citizens who were aboard the Diamond Princess cruise ship that was placed
under quarantine in Japanese waters or evacuated from Wuhan. One of the newest patients, however, a resident of
California's Solano County, had no known exposure to the virus through travel or close contact with a known infected
individual, and represents the first case of community spread for the US. What we urgently need is more clarity on the
scope of spread of this virus in our communities. The FDA on Saturday revised rules that will allow hundreds of
academic hospital labs in the U.S. to immediately begin testing for the novel coronavirus, creating the opportunity to
test thousands of patients. According to CDC, the U.S. had tested only ~500 people for COVID-19 by the last
weekend. There is no doubt more cases will be emerging, but we don’t believe US cities are in a remotely comparable
situation as Wuhan back in January when tens of thousands of affected people lived their life in a densely populated
city as usual, knowing little to nothing about the outbreak or their own infection.
Economic Impact on China and the US
We are not macro-economists, but common sense tells us the economic data out of China’s Q1 will be terribly bad. It
is not just that 60 million people in the Hubei province have been in lockdown for more than 1 month. Most of the major
cities, including Beijing, Shanghai, Guangzhou, etc. have been in a quasi-shutdown mode for the most part since the
Chinese new year. People who can work from home have been working from home but most industries requiring
manual labor have been largely inactive. Large enterprises have had a higher percentage of their businesses resume,
with Chinese governments allocating resources to help them reopen. However, most small and mid-sized businesses
remain closed. Chinese officials estimate the coronavirus spread will be under control by the end of April in the country.
If that prediction becomes reality, China’s economic activities would have a good chance of normalizing by the end of
Q2. After that, we believe it is realistic to assume China’s workers will work overtime trying to make up for some of the
lost GDP in Q3 and Q4.
Various fiscal and monetary stimulating measures will also be implemented by governments at all levels to accelerate
the economy. Therefore, while the epidemic’s tail risk could be significant, we believe the odds are high the Chinese
economy will have a V shaped recovery for 2020. Further down the road, however, China’s long term economic growth
pace could be reduced. We believe there will likely be increased scrutiny from foreign businesses and tempered
investment appetite for China, as a result of renewed concerns of China’s structural disadvantages. This coronavirus
outbreak, its spread and containment, is a perfect demonstration of what a totalitarian government can and cannot do.
The Chinese government has done an incredible job containing the spread since late January, but the outbreak could
and should have been contained and mitigated in its infancy if the local and central governments had worked hand in
hand in the best interests of average Chinese citizens.
As for the US economy, a large amount of US businesses do source intermediate goods inputs from China goods,
ranging from 5% to 20% depending on the industries. Manufacturing and wholesaling inventories, however, are at high
levels, after the busy holiday season in the US, and in anticipation of the normally 2 week-long Chinese new year
holiday. As a result, supply chain disruption for US companies, at least for Q1, should be minor. The economic impact
from supply chain disruption for Q2 is more of a wild card, depending on when China’s manufacturing will resume its
full capacity. Ironically, the trade war between the US and China had forced companies to diversify their supply chain
away from China over the past 18 months to various degrees, which will also help alleviate the virus shock.
Separately, large US companies generate revenues from China by selling products and services directly to consumers.
There is no doubt those companies’ Q1 revenues will experience a sizable decline year over year in China, and a
portion of the revenue will likely not be made up for in the rest of the year, think about Starbucks, McDonald, etc. For
other companies such as Apple or Microsoft, purchases of their products from Chinese consumers could very well just
be postponed to a later date, but not permanently lost. That said, depending on how the outbreak will spread inside the
US and the rest of the world, domestic and global demand outside China could also be impacted.
We believe a reasonably appropriate comparison is to compare it to the impact of 9/11 in 2001. After the tragic attack,
the consumer confidence index in the US fell to 85.5 in October of 2001, its lowest level since February 1994, from
97.0 in September. However, consumer confidence quickly bounced back to 95.0 in December, and 110.0 in March of
2002. It took just a few months for US consumers to return to their normal life, which speaks volume about the
resilience of the American people and economy. In addition, we are also having a very different economic backdrop
right now compared to late 2001. The US economy is growing at a healthy rate, the unemployment rate is at historical
lows, and consumer confidence is at historical highs (131.6 in January 2020, up from 128.2 in December). Before 9/11,
the US had two consecutive quarters of economic contraction and the country was just recovering from a spectacular
Page 2, © 2020 Advisor Perspectives, Inc. All rights reserved.tech bubble crash a year ago. We feel that the country is much better positioned to handle a demand shock at this
economic juncture than back then. That said, China essentially locked down the whole country to fight the coronavirus,
and we are not projecting any scenario similar to that for the US or European countries. It will be interesting to see
how effective Italy and South Korea handle the virus response as they are democratic societies with advanced
economies more similar to the US than China. We also take some comfort looking at Singapore, which despite its
proximity to China and dense population, has only 96 cases since the first case was reported on January 23.
Singapore was aggressive at the get go responding to the virus and has continued that approach to this day. It was
one of the first countries to impose restrictions on anyone with a recent travel history to China and parts of South
Korea. It has a strict hospital and home quarantine regimen for potentially infected patients and is extensively tracing
anyone who might have been in contact with others that were infected. Those seem to be similar measures the US
has implemented early on, and we are hopeful, despite an expected rise of cases in the foreseeable future, that the US
remains in a relatively good shape.
The Impact on the Large Cap. US Equity Market
There is no doubt a highly contagious virus outbreak like this will have a very significant and direct impact on air travel,
tourism, and potentially domestic demand for general discretionary consumption such as dining out, going to movies,
shopping at malls, etc. We expect the majority of the companies in the SP500 to report a negative impact from the
virus, immediate or lagged, big or small. 2020 earnings for most companies and therefore the index will have to be
revised lower. On Feb 27, Goldman Sachs revised its SP500 2020 EPS forecast to $165, down from $174, and flat
from 2019. Given the index entered the year trading at a nearly 18 times PE, this ~5% EPS cut would imply a ~10%
drop of the index from the 2019 year end level, assuming the multiple stays unchanged. Based on different EPS
revisions and different multiple scenarios, the SP500 may have an infinite number of scenarios for where it should
trade. The $165 EPS for 2020 could still be rosy and PE multiples usually contract when big downward earnings
revisions happen.
The SP500 has lost nearly 8% of its value year to date or nearly 15% from its 2020 high, which can be almost perfectly
explained by simple measures such as earnings expectations and earnings multiple, as short term price moves tend to
be conveniently dictated by handy but inadequate metrics. The intrinsic value of corporations, which may have
decades or even hundreds of years of corporate life, and the intrinsic value of the SP500 index, which is an aggregate
of the intrinsic values of its constituents, we argue, are not and cannot be determined by a simple multiple of one single
year’s profit estimates. When we look at the SP500, the index ended 2019 with an implied Equity Rate at the median
level of the past 20 plus years. The Equity Risk Premium is well above the historical median, however, mainly because
the risk free rate (the 10 Year US Treasury yield in our calculation) has declined significantly. These two factors made
US large cap stocks a relatively attractive investment entering 2020.
Page 3, © 2020 Advisor Perspectives, Inc. All rights reserved.*Applied Finance Research: Nominal Industrial Equity Rate and Equity Risk Premium at Calendar Year end
According to FactSet, back at 12/31/2019, the SP500 index was expected to see its EPS increase at ~10% and
revenues grow at ~5% for calendar 2020 and 2021.Using those and long-term market consensus assumptions to value
the industrial firms in the SP500 in aggregate, entering 2020 the index has up to 20%% upside, consistent with the
favorable implied equity risk premium we described above. However, with the index down nearly 10% from the start of
the year, the market is now pricing 2020 and 2021 sales and profits to decline 3% each year with no makeup of such
losses in the long-run. That approximately 15% decline in profit assumptions for two consecutive years from the initial
consensus estimates entering the year are quite pessimistic, and the market is not pricing in an accelerated EPS come
back in the year afterwards. To put things into perspective, the SP500 had its EPS decline by 15% and 78%
respectively in 2007 and 2008. In the following two years, the index’s profits increased 243% and 52% respectively,
ushering in a bull market that exists to today. At an individual company level, nearly 30 companies in the index have
lost more than 20% of their market values in the past week alone, and nearly 80 companies have seen their stock
prices decline more than 20% year to date. Those big under-performers are concentrated in cruise line operators,
travel companies, airlines, hotels, easy targets for such a crisis. Energy and material names also suffered.
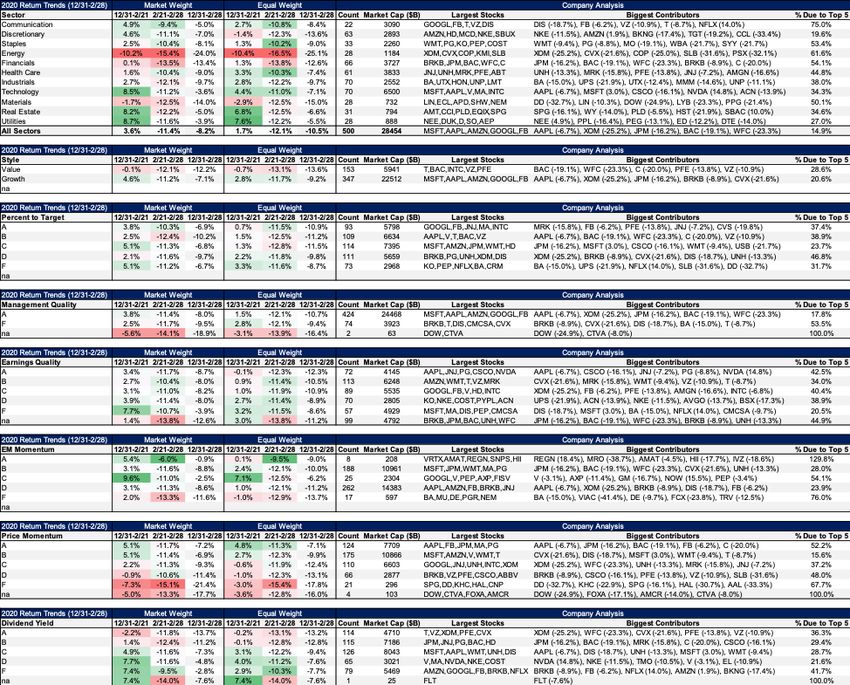
When we look at the year to date return for the SP500, price momentum was a strong factor impacting returns until
February 21, while valuation, quality, and dividend yield failed to outperform. In the same time period, growth also
handily outperformed value. From February 21 to 28, no factor helped or hurt returns in a notable way, and growth only
slightly beat value. Stocks have been selling off indiscriminately across all factor ranking percentiles. The only
criterion that would have worked is sector tilt, as sectors conventionally regarded as risky – Energy, Financials,
Materials, underperformed while sectors regarded as defensive – Communications, Staples, and Healthcare,
outperformed. This is a classic risk off sell off (please see return table at the end of the report).
We believe such classic “risk off” sell offs typically presents good buying opportunities, and this time is likely no
different. This coronavirus outbreak shall pass, just like the DotCom crash, 9/11, and the 2008/2009 financial crisis. In
fact, we don’t believe the coronavirus risk is even close to the devastating impact of the other events. The US will
survive and thrive, as it always has. That said, it is difficult to fight the emotional/psychological effects of fear and the
impulse to “cut the loss and run”. Therefore, it is important to consider the following facts about the market and the
Valuation 50™ in particular. Over the past 15 year, we have experienced the H1N1 scare, and the worst economic
downturn since the Great Depression. Over that 15-year period, the worst 12 month and 120 month annualized rolling
returns for the SP500 are - 47.5% and 5.9% respectively. For the Valuation 50™, they are - 46.7% and 6.1%.
Conversely, the best 12 month and 120 month annualized rolling returns to the SP500 are 66.5% and 17.0%, versus
68.2% and 17.9% for the Valuation 50™. These statistics illustrate the vital importance of having a long-term horizon
Page 4, © 2020 Advisor Perspectives, Inc. All rights reserved.when investing in long duration asset such as large cap US equities. Sharp sell-offs tend to be followed by sharp
upturns, and missing those quick rebound periods will set a wealth accumulation plan back for years or decades.
Lastly, this data also illustrates the benefits of being a Valuation 50™ investor. Not only has the strategy suffered less
during downturns than the SP 500 since its inception, but it has generated higher returns during upturns.
When we look at our Valuation 50™ and Valuation Dividend™ strategies, we see some holdings losing 20% or more
of their value in the past week. We ask ourselves, can the coronavirus’ negative impact on the economy for 2020 and
maybe 2021, really wipe out 20% of those companies’ lifetime growth and profits? Our answer is a resounding no.
Prices are always more volatile than intrinsic values, and we emphasize the two strategies’ diversification and quarterly
rebalancing discipline, which will help investors navigate periods of heightened volatility and take advantage of
potentially widened price/intrinsic value gap. This is obviously a fast evolving situation and we will keep you posted
about our ongoing thoughts.
S&P500 Sector/Style/Factor Returns
*Applied Finance Research Database: GICS sectors, style and custom factors 12/31/19 – 2/28/20
Disclaimer:
FOR PROFESSIONAL FINANCIAL/INSTITUTIONAL USE ONLY.
This material is not intended to be relied upon as a forecast, research or investment advice, and is not a recommendation,
offer or solicitation to buy or sell any securities or to adopt any investment strategy. The information and opinions are
derived from proprietary and nonproprietary sources deemed by Applied Finance to be reliable, are not necessarily all-
inclusive and are not guaranteed as to accuracy. As such, no warranty of accuracy or reliability is given and no
responsibility arising in any other way for errors and omissions (including responsibility to any person by reason of
negligence) is accepted by Applied Finance, its officers, employees. This material may contain ’forward looking’ information
Page 5, © 2020 Advisor Perspectives, Inc. All rights reserved.that is not purely historical in nature. Such information may include, among other things, projections and forecasts. There is
no guarantee that any forecasts made will come to pass. Reliance upon information in this material is at the sole discretion
of the reader.
The information in this report is not intended to be used as the primary basis of investment decisions, and Applied Finance
makes no recommendation as to the suitability of investing in any particular security. Due to individual investor
requirements, this report should not be construed as advice meant to meet the investment needs of any investor. Any
opinions and projections expressed herein reflect our judgment at this date and are subject to change without notice.
Applied Finance, its owners, employees and/or clients may have positions in any security that is discussed in this report.
The S&P 500 Index is a market capitalization-weighted index of 500 of the largest U.S equities and is often used as the
standard for measuring large-cap U.S. stock market performance. An investor cannot directly invest in an index and the
performance of the index may be materially different from the actual performance obtained by a specific investor.
The Russell 1000 Index is a market capitalization-weighted index of 1000 of the largest U.S. equities. The Russell 1000
Value index measures the performance of the Russell 1000’s value segment, which includes firms with lower price-to-book
ratios and lower expected growth values.
Copyright 2020 Applied Finance - Disclaimers: Applied Finance refers to Applied Finance Capital Management and its
Affiliated Companies; Applied Finance Group (AFG) and Applied Finance Advisors (AFA).
Page 6, © 2020 Advisor Perspectives, Inc. All rights reserved.You can also read