Rise of Electric Vehicles: Impact on Commodities and Emerging Markets
←
→
Page content transcription
If your browser does not render page correctly, please read the page content below
EM ERGING M A R K ETS DEBT

                                                                              Investment Management
                                                                              active.williamblair.com

Rise of Electric Vehicles:
Impact on Commodities and Emerging Markets

Metals have often been crucial in the advancement of societies and            August 2021

modern living standards. With most metals sourced from emerging market        Head of Emerging Markets Debt
(EM) countries, their impact to these economies is indisputable. In this      Marcelo Assalin, CFA
paper we explain how demand drivers stemming from electric vehicles (EVs)
                                                                              Portfolio Manager
and their infrastructure could impact the utilization of several metals and   Luis Olguin, CFA
the countries from which they are sourced.
                                                                              Corporate Credit Analyst
                                                                              Alexandra Symeonidi, CFA
Introduction
According to the International Energy Agency (IEA), transportation emissions account
for almost one-fourth of direct CO2 gases released into the atmosphere1—and vehicles
are responsible for three-fourths of these emissions, thus making them one of the key focus
areas of regulatory efforts on climate change.
Governments around the world have set optimistic targets to cut greenhouse gas
emissions in an effort to reduce pollution. Tax benefits, grants, and outright bans on internal
combustion engine vehicles aim to promote the transition into cleaner transportation.
While consumers are being incentivized to switch to less polluting automobile alternatives
there is also an undeniable grassroots sentiment by individuals to reduce their
environmental impact.
Under its New Energy Vehicle (NEV) 2021-2035 strategy, released in November 2020,
China plans to increase penetration of EV sales to 20% of total new vehicles by 2025. In the
same month, U.K. Prime Minister Boris Johnson announced a ban on new petrol and diesel
cars from 2030 as part of the country’s green plan. The European Union (EU) will aim to
increase EV stock to 30 million cars on the road by 2030, up from 1.4 million currently,
while also effectively banning internal combustion engine auto sales by 2035. And recently,
U.S. President Joe Biden set a target that 50% of the vehicles sold in the country should
be EVs by 2030.
The push toward EVs and their infrastructure supports the demand for several metals,
and we believe a number of metals we call commodities of the future—lithium, nickel,
aluminum, and copper—are well positioned to benefit from this demand surge.
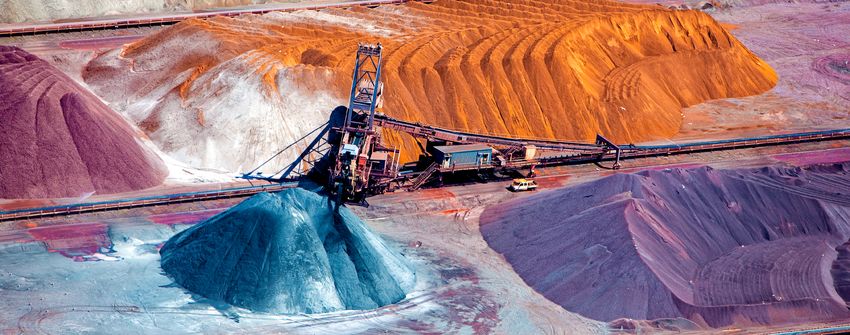
Although mining is perceived to have negative environmental consequences, nowadays
there are ways to reduce the environmental impact of the extraction of minerals.
Companies are striving to improve the sustainability of their operations by switching to
renewable energy sources and recycling water.
1 “CO2 Emissions from Fuel Combustion 2020,” International Energy Agency (IEA).
2 | RISE OF ELEC TRIC V EHICLE S: IMPAC T ON COMMODITIE S A ND EMERGING M A RK E TSElectric Vehicles
There are several types of EVs. Battery EVs (BEVs) we believe EVs should continue to gain market share
are fully electric with rechargeable batteries and no in the near term.
gasoline engine. Plug-in hybrid EVs (PHEVs) can be
recharged by plugging into an external energy source Lithium: Elemental for EV Battery Production
or by their internal engines. Fuel cell EVs (FCEVs) The rise of EVs is likely a major reason for the surge in
generate power through oxygen and compressed demand for lithium, a key component of lithium-ion
hydrogen. Conventional hybrids (HEVs) combine an batteries. Bloomberg estimates that lithium demand from
internal combustion system and electric propulsion batteries will increase fivefold from 2021 to 2030.3 S&P
to improve efficiency. Exhibit 1 illustrates. expects lithium demand from all uses to triple by 2025 to
almost 1.5 million metric tons.4
In 2020 the global EV car stock hit 10 million units,
2 Global EV Outlook 2021, International Energy Agency (IEA).
soaring 43% over 2019 numbers.2 In the EU, 54% of all
3 BloombergNEF.
car registrations were EVs in 2020. While forecasts 4 “Lithium Supply Is Set to Triple by 2025. Will it be Enough?” S&P Global Platts,
vary, we believe there is a clear trend in favor of EVs, and October 2019.
EXHIBIT 1
Types of Electric Vehicles
Battery EV (BEV) Plug-in Hybrid Fuel cell EV Conventional hybrid
EV (PHEV) (FCEV) (HEV)
Power Source Electric Battery Gasoline/Diesel and Battery Hydrogen Gasoline/Diesel and Battery
(plug in) (Charged from Engine)
Average Battery- 181 Miles 26 Miles 300-Plus Miles N/A
Only Range
Estimated Cost of €33.2K €34.3K €44.6K €33.7K
Ownership by 2025
Sources: U.S. Department of Energy, Newmotion by the Shell Group, European Consumer Organisation. Cost of ownership is from “Electric Cars: Calculating the Total Cost
of Ownership for Consumers” Element Energy, for The European Consumer Organisation, as of April 25, 2021. The cost is an estimation for a medium car bought new in 2025
and includes depreciation, VAT, fuel, electricity, insurance, and maintenance.
EXHIBIT 2
Expected Increase in Metal Demand from Lithium-ion Batteries, 2021 to 2030
Nickel 5.2x
Aluminum 5.7x
Copper 5.5x
Lithium 5.3x
0x 1x 2x 3x 4x 5x 6x
Source: BloombergNEF, as of 2021.
W ILLI A M BL A IR IN V ES TMENT M A N AGEMENT | 3Electric Vehicles (continued)
“As is the case with other metals, EMs EXHIBIT 3
play a pivotal supply role in lithium” Chile Dominates in Lithium Reserves
Alexandra Symeonidi, CFA
10
9
8
7
More than 90% of lithium supply is mined as primary 6
product in hard ores. Total global reserves are estimated 5
at 21 million metric tons in 2020, 23.5% higher than they 4
were in 2019 due to continuing exploration of the soft 3
metal. As is the case with other metals, EMs play a pivotal 2
supply role. 1
0
Chile Australia Argentina China United States Zimbabwe
Although about 50% of mined lithium currently comes
from Australia, most known reserves are in Chile. Estimated Reserves as of 2020 (In Million Metric Tons)
In fact, more than 40% of world reserves are found in
Chile. As the country continues to turn reserves into Source: U.S. Geological Survey (USGS), as of 2021.
production, its lithium exports should increase, affecting
its trade balances. This is already beginning to occur:
Chilean lithium exports were almost four times higher
in 2020 than they were a decade ago.5 Although country
resources shown in exhibits 3 and 4 are measured in EXHIBIT 4
metric tons of lithium compounds, the countries below Global Lithium Production Has Spiked Over the
report in lithium carbonate equivalent, which is a metal Past 3 Years
with very high lithium content.
100
5 Banco Central de Chile. 90
80
70
60
50
40
30
20
10
0
2000 2004 2008 2012 2016 2020
Lithium Total Production (In Thousand Metric Tons)
Source: USGS, as of 2021.
4 | RISE OF ELEC TRIC V EHICLE S: IMPAC T ON COMMODITIE S A ND EMERGING M A RK E TSElectric Vehicles (continued)
Over the past few years, companies have invested in Chile production, although they can also include manganese,
given the country’s vast lithium reserves. In late 2018, titanate, and iron. Exhibit 5 illustrates.
China-based Tianqi Lithium, one of the largest hard rock
lithium producers in the world, acquired roughly 24% of Nickel: High Grade, High Demand
Sociedad Química y Minera de Chile (SQM). Nickel is also experiencing demand from EV batteries
because it helps deliver higher energy density and greater
Moreover, companies in the sector have set aggressive storage capacity. The very common NCA batteries for
targets to increase production to meet expected demand. EVs, for example, are 80% nickel.
Tianqi Lithium, for example, produced more than
70,000 metric tons of lithium carbonate, comprising about Indonesia is the world’s largest producer of nickel,
21% of total global supply, in 2020, and its production comprising up to 30% of global nickel supply in 2020,
is expected to grow 70% in 2021. SQM, another significant according to USGS estimates.6 In January 2020, Indonesia
player in the market, increased lithium production by enacted a two-year nickel export ban to help accelerate
43% in 2020 to 64,600 metric tons, comprising about the construction of new smelters and preserve nickel
20% of global supply. Production is expected to increase resources. The decision will allow Indonesia to process
by another 47% in 2021. SQM expects lithium carbonate nickel domestically and potentially benefit from an
demand to grow from 330,000 metric tons in 2020 to upcoming demand surge in the metal.
900,000 to 1,000,000 metric tons in 2025.
The second and third largest nickel producers are the
Lithium-ion battery technologies, such as the EVs Philippines and Russia, with approximately 13% and 11%
themselves, are diverse. Depending on end-use, they of total global nickel supply, respectively.
are produced with a number of other metals and
new technologies keep changing. Lithium, nickel, and
cobalt are the most common elements of EV battery 6 USGS, 2021.
EXHIBIT 5
Lithium-ion Battery Technology Uses and Advantages
Lithium, Lithium, Lithium, Lithium, Lithium, Lithium,
Cobalt, Nickel, Nickel, Manganese, Titanate, Iron,
Oxide Cobalt, Manganese, Oxide Oxide Phosphate
(LCO) Aluminum, Cobalt, (LMO) (LTO) (LFP)
Oxide Oxide
(NCA) (NMC)
Uses Portable EVs, Electronic Most Common Medical EV Production, EVs, Electric
Electronics Devices Among EVs Applications, Energy Storage Motorcycles
Electric Bikes
Main Advantage Smaller Volume Higher Capacity Lower Cost Safer Fast Charge Long Lifecycle
Source: William Blair, as of June 2021.
W ILLI A M BL A IR IN V ES TMENT M A N AGEMENT | 5Electric Vehicles (continued)
EXHIBIT 6
Indonesia Accounts for 30% of Total Nickel Production
900
800
700
600
500
400
300
200
100
0
Indonesia Other Philippines Russia N. Caledonia Australia Canada China Brazil Cuba United States
2020 Estimated Nickel Production (In Thousand Metric Tons) 2019 Nickel Production (In Thousand Metric Tons)
Source: USGS, as of 2021.
As with all metals, nickel quality (grade) varies. In the
EXHIBIT 7
construction of EV batteries only high-grade nickel is used.
But the high-grade nickel market is very concentrated. High-Grade Nickel Production Is Concentrated
As shown in exhibit 7, seven companies accounted for
83% of total supply in 2020.7 The largest high-grade nickel
supplier in the world is Russia’s Norilsk Nickel, which
had a 22% market share in 2020, followed by the Chinese
22% 17%
Jinchuan Group, with 17% market share in the same Nornickel
year. Brazil’s Vale accounted for 12% of total market share Jinchuan
in 2020. Glencore
8%
Vale
Companies have long recognized the potential demand Sherritt
surge for nickel due to EVs and related infrastructure and 8% BHP
17%
are committed to increasing supply to the market. Norilsk 3% Sumitomo
Nickel, for example, has a strategic ambition to increase Other
nickel production up to 17% from 2020 to 2030. Vale, 12%
13%
meanwhile, plans to boost nickel production 20% from
current production levels by 2025.
7 Nornickel annual report, December 2020. Source: Nornickel annual report, as of December 2020.
6 | RISE OF ELEC TRIC V EHICLE S: IMPAC T ON COMMODITIE S A ND EMERGING M A RK E TSElectric Vehicles (continued)
Solving the Weight Problem: Aluminum
EXHIBIT 8
While battery technology certainly differentiates EVs
from conventional vehicles, it also makes vehicles heavier. China Accounts for More Than Half of the World’s
Replacing steel parts is one way to reduce vehicle weight Aluminum Capacity
and improve energy efficiency. Aluminum, a lightweight
but strong and malleable metal, is a good substitute for
certain steel components and can help reduce the vehicle’s
overall weight.
29%
Although aluminum is more expensive than steel per China
metric ton, EV automakers have been increasingly India
using the metal, particularly for battery, motor housings, Russia
and body structural components, as they transition to Canada
56%
multi-metal vehicles. Mexico is the fifth largest producer 4% Other
of auto parts in the world, primarily serving the all- 5%
important U.S. auto market. We believe its auto components 5%
industry is well poised to benefit from the rise in
lightweight auto parts.
China dominates both the supply and demand of
Source: USGS, as of 2021. Shows 2020 estimated aluminum capacity, in thousand
aluminum. In 2020, China produced about 37 million metric tons.
metric tons, according to USGS estimates, which is
about half of the total global aluminum supply.
China has also increased its share of global aluminum
EXHIBIT 9
production capacity from 11% in 2000 to almost 60%
currently. This increase has at times created oversupply China Increased Aluminum Production From
and depressed prices. However, Chinese consumption 11% in 2010 to 57% in 2020s
has also grown due to urbanization, economic growth,
investments in infrastructure and real estate, and, most 70 60%
recently, the focus on EVs.
60
50%
The largest aluminum producers in the world are
based in China. Aluminum Corporation of China Limited 50
40%
(Chalco) and Hongqiao Group are the largest producers
of primary aluminum globally. Chalco is 32% owned by 40
Aluminum Corporation of China, which is a state-owned 30%
and strategic company for China. Russia’s United Company 30
Rusal is the third largest primary aluminum producer 20%
globally, accounting for 6% of global production in 2020. 20
It believes aluminum is the way to more sustainable 10%
industries and sees demand spiking in the coming years. 10
0 0%
2000 2002 2004 2006 2008 2010 2012 2014 2016 2018 2020
World Production (In Million Metric Tons, Left Axis)
Percentage from China (Right Axis)
Source: USGS, as of 2020.
W ILLI A M BL A IR IN V ES TMENT M A N AGEMENT | 7EV Infrastructure
Regardless of the type of EV or its components, all EVs China is home to the largest network of charging stations
need charging stations, and the growth of EVs on worldwide. In 2020, about 800,000 out of the total 1.3
the roads requires proportionate growth in charging million public charging stations, or 62%, were in China.9
stations worldwide. And China has been building public charging stations at
a very fast pace, with Chinese public charging stations
The lack of charging stations is cited to be the first growing 55% year-over-year in 2020.
barrier for EV adoption in company fleets by members
of EV100, an initiative that brings together companies We believe charging station investments are set to
committed to switching their fleets to EVs and grow around the world. For example, the EU targets
installing charging infrastructure for employees and 1 million charging stations by 2025 as part of its European
customers by 2030. Green Deal Investment Plan, a significant increase
from the roughly 290,000 public charging stations in the
Unlike internal combustion vehicles that can only be EU currently (just 13% of which are fast charge). The
fueled at gasoline stations, EV owners have several target might sound optimistic, but industry experts, such
options for charging: at home, at work, or at public stations. as the European Automobile Manufacturers’ Association
Public charging stations are particularly important in (ACEA), are pushing for 1 million charging points by
the EV rollout as they provide autonomy and flexibility 2024 and 3 million by 2029.
to EV drivers. In 2020, public charging stations grew 46%
year-over-year to 1.3 million units, of which 30% were The United Kingdom’s Committee on Climate
fast chargers.8 Change suggests 1,170 charge points will be required
per 100 kilometers of road by 2030, but in 2019 there
were just 570 charge points per 100 kilometers of
EXHIBIT 10 road. The government’s 10-year green plan includes an
Chile and Peru Dominate Global Copper Mining investment of £1.3 billion for charging stations to
address this future need.
7 Meanwhile, the U.S. administration is planning to build
500,000 charging stations in the next few years. That’s up
6 significantly from the 100,000 public charging stations
that existed in the United States in 2020, of which just 17%
5
were fast charge.
4
Copper: EV Infrastructure Gives Doctor Copper a Facelift
Copper is sometimes viewed as being so critical to the
3
world that it can be referred to as Doctor Copper because
2
its ability to predict economic turning points suggests it
has a Ph.D. in economics.
1
Copper is likely to benefit from EV infrastructure
0 investments due to its heavy use in vehicles and charging
Chile Peru China United States Australia
stations. It has excellent electrical conductivity and is
durable, allowing it to endure extreme temperatures.
2020 Expected Copper Production (In Million Metric Tons)
These properties make copper ideal for wiring and other
2019 Copper Production (In Million Metric Tons)
electrical applications.
8 BloombergNEF.
Source: USGS, as of 2021. 9 Global EV Outlook 2021, International Energy Agency (IEA).
8 | RISE OF ELEC TRIC V EHICLE S: IMPAC T ON COMMODITIE S A ND EMERGING M A RK E TSEV Infrastructure (continued)
In addition, an EV contains three to five times more First Quantum Minerals (FQM), which is a copper miner
copper than a conventional one. The International Copper operating primarily in Zambia and Panama, produced
Association (ICA)10 predicts that more than 250,000 an equivalent of 4% of global supply last year. The company
metric tons of copper per year will be consumed as a result increased its copper output by 40% as the Cobre Panama
of the higher stock of EVs in 2030, from about 80,000 mine has recently fully ramped up. Cobre Panama is
metric tons currently. one of the largest copper mines in the world, and FQM is
one of the few companies in the industry to bring such
The world’s largest copper producing country is Chile, large projects online recently.
with about 29% of global copper mine supply. Peru and
China are the second and third largest producers of
mined copper, accounting for 11% and 9% of global supply,
respectively. On the consumption side, China is also the 10 “EV motors boost copper demand”, International Copper Association,
March 2020.
largest consumer of copper, accounting for almost 60% 11 Bloomberg data.
of global demand as of March 2021.11 12 Banco Central de Chile.
13 Banco Central De Reserva Del Perú.
Although China is a diverse economy exporting a variety
of goods, Peru and Chile’s exports are more concentrated.
Copper exports constituted 56% of the total value of EXHIBIT 11
Chilean exports12 from January to May in 2021 and 32%
China Now Accounts for 57% of Global
of Peruvian exports13 from January to April 2021,
highlighting how important copper is to these countries. Copper Demand
Copper Mines: Mostly Located in EMs
As a top holder of the world’s reserves, Chile is home to 27 17
a number of copper producers as well as the world’s
largest mine, La Escondida, which alone accounts for 25 15
about 5% of world production. The largest global producer
is Corporacion Nacional del Cobre, Chile’s national 23 13
copper mining company, with 1.6 million metric tons in
2020, approximately 8% of global production. At a smaller 21 11
scale, Antofagasta, which recently had its debut issuance
in the EM corporate universe, is producing an equivalent
19 9
of 4% of global supply.
17 7
Southern Copper Corporation is the world’s fifth largest
15 5
copper producer, with operations in Peru and Mexico. 03/11 03/12 03/13 03/14 03/15 03/16 03/17 03/18 03/19 03/20 03/21
In 2020 the company produced about 1 million metric tons
of copper, which is about 5% of global supply.
World Copper Demand (In Million Metric Tons, Left Axis, 12-Month Rolling)
China Copper Demand (In Million Metric Tons, Right Axis, 12-Month Rolling)
“An EV contains three to five times
more copper than a conventional one.” Source: Bloomberg, as of June 2021.
Luis Olguin, CFA
W ILLI A M BL A IR IN V ES TMENT M A N AGEMENT | 9ESG Considerations: The Canary in the Metal Mine
Developed markets and EMs alike are joining the UN’s Low-carbon aluminum is one example of a green
“Race to Zero,” committing to achieving net-zero metal. Produced using mostly renewable energy sources
carbon emissions by 2050 at the latest. Governments such as hydropower, it typically emits about four
around the world are mapping out sizable investment plans metric tons of CO2 equivalent per metric ton of aluminum
earmarked for transition to more sustainable economies. produced. This is roughly three times below the
For example, the European Green Deal Investment industry’s global average emission rate of 11 metric tons
Plan, set forth by the EU, stated it will mobilize at least of CO2 equivalent per metric ton of aluminum produced.
€1 trillion in sustainable investments over the Recently, a different labelling 14 but also trading 15 of
next decade. the metal has been discussed, highlighting the focus on
sustainable mining.
As industrialized economies look to transition to a
sustainable future, they will need to make investments Companies have also been introducing low-carbon
in infrastructure, which, apart from government nickel, which will emit less than four metric tons of CO2
commitments, will need resources and materials. In equivalent per metric ton of nickel equivalent produced.
this regard, mining or recycling and reusing metals This is a substantial reduction from the global industry
is necessary. average of 29 metric tons of CO2 equivalent per metric
ton of nickel equivalent produced.
From an environmental, social, and governance (ESG)
perspective, mining for metals can be a controversial topic So, while mining can have a sizable environmental
requiring in-depth exploration. footprint, metals extracted by mining companies
are crucial to transition to cleaner economies and address
On one hand, mining can have adverse environmental climate change. The overall cost or benefit of mining
consequences; it often requires large surface areas, to economies and societies will depend on how companies,
potentially damaging biodiversity, and processing can investors, and consumers adjust and contribute to the
cause high emissions as well as water and soil pollution. world transition to a sustainable future.
On the social side, employee safety and working
conditions have been an increasingly important topic
for mining companies to address.
14 “Green aluminum needs common standard, labeling plan: Carbon Trust,
Reuters, June 2020.
However, mining can have positive externalities as 15 “London Metal Exchange plans ‘low-carbon’ aluminium trading”,
well. In many EM countries mining is a source of Financial Times, June 2020.
employment, providing higher income to communities,
thereby contributing to higher standard of living.
Mining also attracts foreign direct investments (FDI).
Both those externalities contribute to higher
social standards.
Like many industries, the mining industry is evolving.
The European Copper Institute found that the copper
industry reduced CO2 emissions by 60% from 1990
to 2020 by investing in efficiency and reducing energy
consumption. But the green initiatives have just started:
nowadays, mining of “green” metals (which are metals
produced with renewable energy sources and sustainable
practices) is a new way to address emissions in the sector.
10 | RISE OF ELEC TRIC V EHICLE S: IMPAC T ON COMMODITIE S A ND EMERGING M A RK E TSConclusion
In conclusion, the push toward EVs and their infrastructure supports the demand
for several metals, and we believe the “commodities of the future” are well positioned to
benefit from this demand surge. And because all those metals are primarily produced
in EM countries, EMs have a pivotal role to play in the transition to green transportation,
in our view.
“While mining for these metals is perceived to have
negative environmental consequences, companies are
aiming to improve the sustainability of their operations.”
Alexandra Symeonidi, CFA
Specifically, lithium is a key component of the lithium-ion batteries used in EVs, and Chile
owns the world’s largest lithium reserves. The NCA batteries commonly used in EVs are
80% nickel, which is mostly produced in Indonesia, the Philippines and Russia. Aluminum,
meanwhile, can replace some steel components in EVs, offsetting increased weight from the
aforementioned battery technologies, and China is supplying more than half of the world’s
aluminum needs. Lastly, copper could also benefit from EV infrastructure investments
due to its heavy use in vehicles and charging stations, and Chile and Peru have been global
leaders in copper production for many years.
While mining for these metals is perceived to have negative environmental consequences,
companies are aiming to improve the sustainability of their operations in part by switching
to renewable energy sources and recycling water.
W ILLI A M BL A IR IN V ES TMENT M A N AGEMENT | 11About William Blair William Blair is committed to building enduring relationships with our clients and providing expertise and solutions to meet their evolving needs. We work closely with the most sophisticated investors globally across institutional and intermediary channels. We are 100% active-employee-owned with broad-based ownership. Our investment teams are solely focused on active management and employ disciplined, analytical research processes across a wide range of strategies. As of June 30, 2021, we manage $74.1 billion in assets. We are based in Chicago with resources in New York, London, Zurich, Sydney, Stockholm, Singapore1 , and The Hague, and dedicated coverage for Canada. (William Blair International (Singapore) Pte. Ltd. is regulated by the Monetary Authority of Singapore under a Capital Markets Services License to conduct fund management activities.) Important Disclosures This material is provided for information purposes only and is not intended as investment advice, offer, or a recommendation to buy or sell any particular security or product. This material is not intended to substitute a professional advice on investment in financial products and any investment or strategy mentioned herein may not be suitable for every investor. Before entering into any transaction each investor should consider the suitability of a transaction to his own situation and, the need be, obtain independent professional advice as to risks and consequences of any investment. William Blair will accept no liability for any direct or consequential loss, damages, costs or prejudices whatsoever arising from the use of this document or its contents. Any discussion of particular topics is not meant to be complete, accurate, comprehensive, or up-to-date and may be subject to change. Data shown does not represent and is not linked to the performance or characteristics of any William Blair product or strategy. Factual information has been taken from sources we believe to be reliable, but its accuracy, completeness or interpretation cannot be guaranteed. Information and opinions expressed are those of the author and may not reflect the opinions of other investment teams within William Blair. Information is current as of the date appearing in this material only and subject to change without notice. This material may include estimates, outlooks, projections and other forward-looking statements. Due to a variety of factors, actual events may differ significantly from those presented. Investing involves risks, including the possible loss of principal. Investing in foreign denominated and/or domiciled securities may involve heightened risk due to currency fluctuations, and economic and political risks. These risks may be enhanced in emerging markets. Investing in the bond market is subject to certain risks including market, interest rate, issuer, credit, and inflation risk. References to specific securities and their issuers are for illustrative purposes only and are not intended as recommendations to purchase or sell such securities. William Blair may or may not own any securities of the issuers referenced and, if such securities are owned, no representation is being made that such securities will continue to be held. It should not be assumed that any investment in the securities referenced was or will be profitable. This material is distributed in the United Kingdom by William Blair International, Ltd., authorized and regulated by the Financial Conduct Authority (FCA), and is only directed at and is only made available to persons falling within articles 19, 38, 47, and 49 of the Financial Services and Markets Act of 2000 (Financial Promotion) Order 2005 (all such persons being referred to as “relevant persons”). This document is distributed in Australia by William Blair Investment Management, LLC (“William Blair”), which is exempt from the requirement to hold an Australian financial services license under Australia’s Corporations Act 2001 (Cth). William Blair is registered as an investment advisor with the U.S. Securities and Exchange Commission (“SEC”) and regulated by the SEC under the U.S. Investment Advisers Act of 1940, which differs from Australian laws. This document is distributed only to wholesale clients as that term is defined under Australia’s Corporations Act 2001 (Cth). This material is distributed in Singapore by William Blair International (Singapore) Pte. Ltd. (Registration Number 201943312R), which is regulated by the Monetary Authority of Singapore under a Capital Markets Services License to conduct fund management activities. This material is intended only for institutional investors and may not be distributed to retail investors. This material is not intended for distribution, publication, or use in any jurisdiction where such distribution or publication would be unlawful. This document is the property of William Blair and is not intended for distribution or dissemination, directly or indirectly, to any other persons than those to which it has been addressed exclusively for their personal use. It is being supplied to you solely for your information and may not be reproduced, modified, forwarded to any other person or published, in whole or in part, for any purpose without the prior written consent of William Blair. 1 William Blair International (Singapore) Pte. Ltd. is regulated by the Monetary Authority of Singapore under a Capital Markets Services License to conduct fund management activities. Copyright © 2021 William Blair. “William Blair” refers to William Blair & Company, L.L.C., William Blair Investment Management, LLC, and affiliates. William Blair is a registered trademark of William Blair & Company, L.L.C. 13282952 (08/21)
You can also read