MAPPING GRABEN-FISSURE SYSTEMS IN THE TAUSSIG AND GALINDO REGIONS OF VENUS
←
→
Page content transcription
If your browser does not render page correctly, please read the page content below
MAPPING GRABEN-FISSURE SYSTEMS

      IN THE TAUSSIG AND GALINDO

                 REGIONS OF VENUS

                                   By

                           Alexandria Leung

A thesis submitted to the Faculty of Science in partial fulfillment of the

          requirements for the degree of Bachelor of Science

                     Department of Earth Sciences

                          Carleton University

                            Ottawa, Ontario

                              March, 2013
The undersigned recommend to the Faculty of Science acceptance of this thesis

    MAPPING GRABEN-FISSURE SYSTEMS IN THE TAUSSIG AND GALINDO

                                   REGIONS OF VENUS

Submitted by Alexandria Leung

In partial fulfillment of the requirements of the degree of Bachelor of Science.

                                                          -------------------------------------------------

                                                                   Thesis Supervisor

                                                          -------------------------------------------------

                                                                   Thesis Co-Supervisor

                                                          -------------------------------------------------

                                                          Chair, Department of Earth

                                                          Sciences

                                                                                                        i)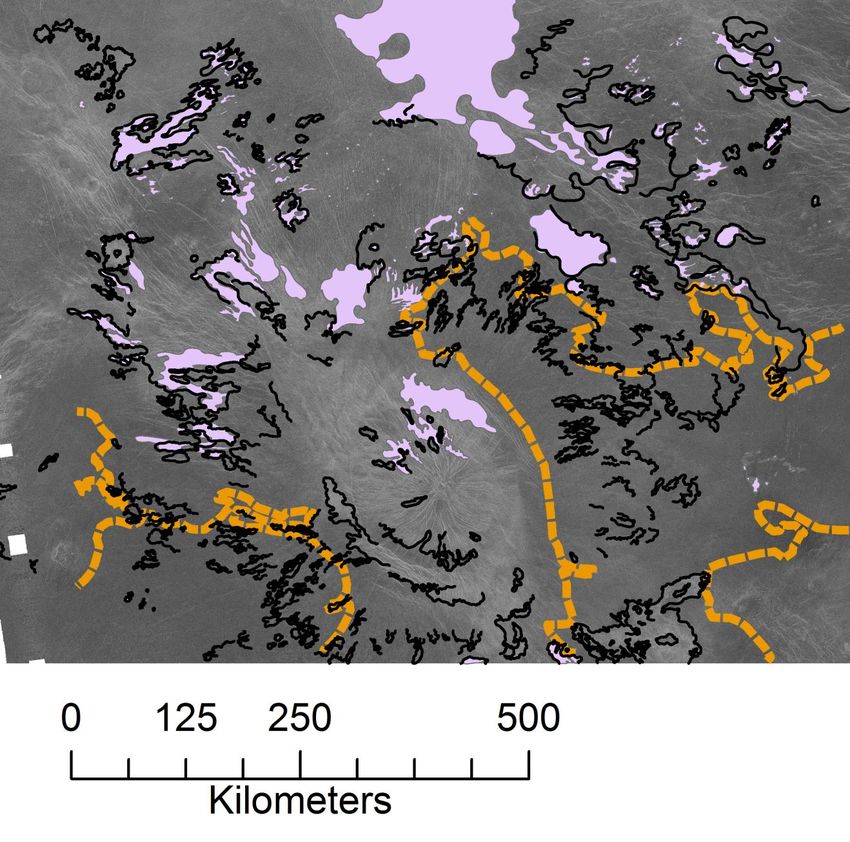
Abstract

 An area within the Taussig and Galindo regions was mapped, focusing on mapping of

radiating graben-fissure systems found near the Dhorani Corona, as part of the Venus

Global Dyke Swarm Project. A total of 13 graben-fissure systems were identified, with 6

systems identified as radiating, and 3 systems identified as linear. Relative ages were

determined between the systems using cross-cutting relationships between the intersecting

graben segments, as well as local flood basalt events. The abundance of different radiating

systems that were found northwest from Dhorani Corona suggested that the accumulation

of basalts was not deep enough to completely bury the earlier graben systems. It is

suggested that the main radiating system around the Dhorani Corona was the youngest

unit, and that basalts may have come from this system. The discovery of new large

radiating dyke swarms adds to the global count of more than 100 confirmed magmatic

plumes.

                                                                                          ii)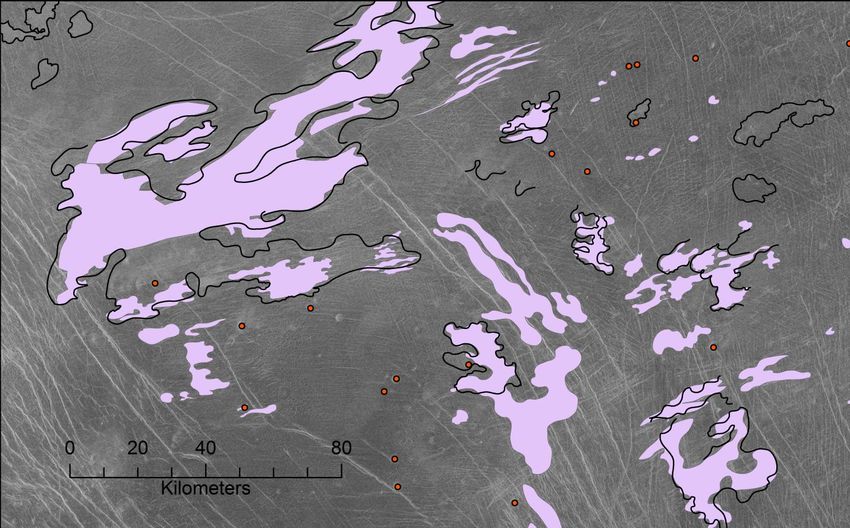
Acknowledgements

 I would like to thank my co-supervisor, Dr. Richard Ernst, for frequently meeting with me

to discuss and provide insight to the geological history of Venus. Your insight and

enthusiasm inspired me to work in the same manner. I would also like to thank my other

co-supervisor, Dr. Claire Samson, for her valuable feedback throughout my mapping

progress. Your feedback encouraged me to continue to work towards improvement.

                                                                                      iii)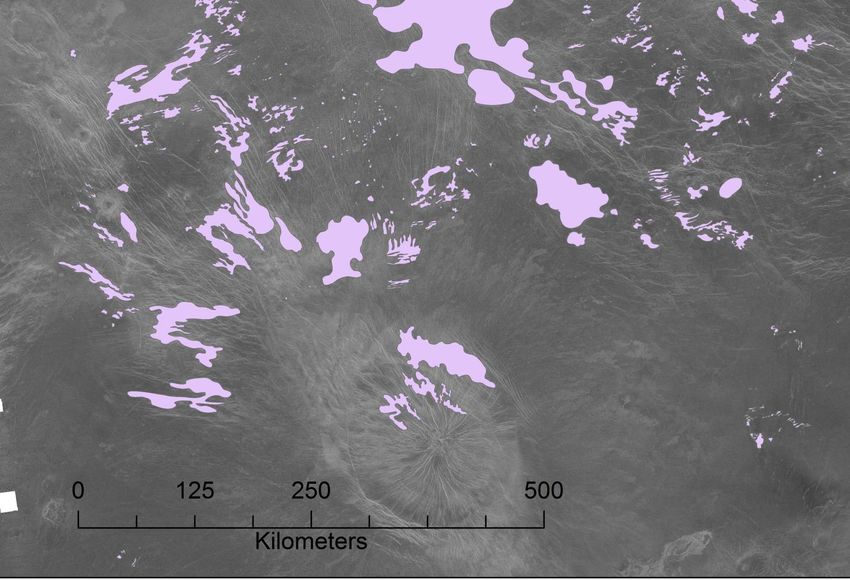
Table of Contents

Chapter 1- Introduction:

      1.1 The Planet Venus -------------------------------------------------------------------------------------------- 1

      1.2 Mapping on Venus ------------------------------------------------------------------------------------------- 2

      1.3 Venus Global Dyke Swarm Mapping Project -------------------------------------------------------- 2

      1.4 Research Objectives ----------------------------------------------------------------------------------------- 3

Chapter 2- Background Information:

      2.1 Previous Missions to Venus ------------------------------------------------------------------------------- 5

      2.2 The Magellan Mission -------------------------------------------------------------------------------------- 6

      2.3 Synthetic Aperture Radar --------------------------------------------------------------------------------- 6

      2.4 Geological Background of Venus ------------------------------------------------------------------------ 7

Chapter 3- Methods:

      3.1 Using SAR images on ArcGIS 10 ------------------------------------------------------------------------ 9

      3.2 Geological Features on Venus: Dyke Swarms, Coronae, Areas of Flooding, and Other
      Features ------------------------------------------------------------------------------------------------------------ 10

      3.3 Cross-cutting Relationships ----------------------------------------------------------------------------- 15

Chapter 4- Observations:

      4.1 Radiating Dyke Swarms Observed -------------------------------------------------------------------- 16

      4.2 Flooded Regions and Inliers ----------------------------------------------------------------------------- 21

Chapter 5- Discussion:

      5.1 Magmatic Centres and their Distributions --------------------------------------------------------- 23

      5.2 Cross-cutting Relationships and their Relative Ages of Associated Magmatic Centres

      ------------------------------------------------------------------------------------------------------------------------- 24

      5.3 Systems Associated with a Corona Annulus -------------------------------------------------------- 28

      5.4 Basaltic Flooding and its Association with Resurfacing Events ------------------------------ 28

      5.5 Comparisons to Previous Mapping -------------------------------------------------------------------- 29

Chapter 6- Conclusion

      6.1 Future Research --------------------------------------------------------------------------------------------- 31
                                                                                                                                 iv)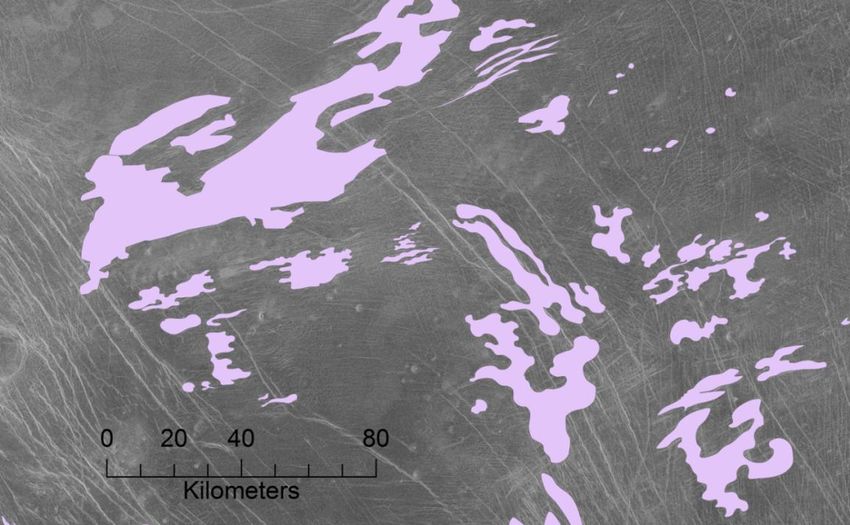
List of Figures

Figure 1: Study area of the thesis, with corresponding SAR image ------------------------------------------ 4

Figure 2: A diagram of left looking illumination against a smooth surface, and a rough surface -- 10

Figure 3: An example of a radiating, a partially circumferential graben-fissure system, and an

example of a linear graben-fissure system -------------------------------------------------------------------------- 11

Figure 4: An example of a corona----------------------------------------------------------------------------------- 12

Figure 5: An example of lobate flows in the study area --------------------------------------------------- 13

Figure 6: Various features found on Venus: an impact crater, shield volcanoes, and pit

craters along a graben ------------------------------------------------------------------------------------------------- 14

Figure 7: An example of cross-cutting relationships between intersecting graben-fissure

systems ----------------------------------------------------------------------------------------------------------------------- 16

Figure 8: An overall view of all the mapped graben-fissure systems and their link with

magmatic centres --------------------------------------------------------------------------------------------------- 18, 19

Figure 9: Cross-cutting relationships between Systems 2 and 8-------------------------------------- 19

Figure 10: Cross-cutting relationships between Systems 13, 14, and 15 -------------------------- 20

Figure 11: The overall mapping of flooded and non-flooded areas, and approximate areas of

deep flooding and inliers ----------------------------------------------------------------------------------------- 22, 23

Figure 12: Partially flooded area, showing topographic high areas (Inliers) --------------- 26, 27

                                                                                                                                     v)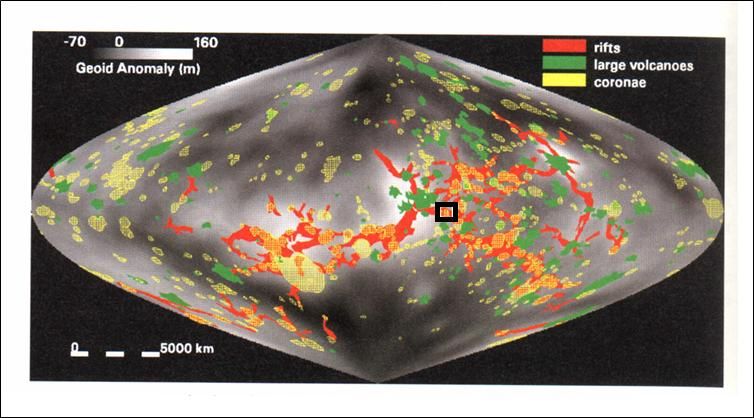
List of Tables

Table 1: A summary of all mapped graben-fissure systems --------------------------------------------- 20

Table 2: Number of observed cross-cutting relationships between systems 2, 3, 4, 5, 6, and 7

------------------------------------------------------------------------------------------------------------------------------ 21

                                                                                                                                vi)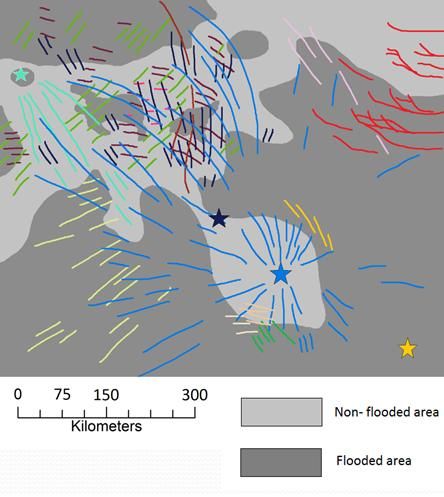
Chapter 1: Introduction

1.1-   The Planet Venus

 Since the development of the planetary sciences in the early 1960s, we have been

compelled to study the surficial features of other planets within our Solar System, and

compare them with the features of our own planet Earth. In these past 50 years, this

research has led us to a greater understanding of our own planet’s history, and continues to

provide a greater insight in that aspect. The history of Venus can help us define the

magmatic and tectonic history of our own planet because it is dominated by plume

magmatism, an important phenomenon also on Earth.

 Venus is the second planet of the inner terrestrial planets, and is similar to Earth in

many aspects, being 81.5% of the Earth’s mass, 85.7% of the Earth’s volume, and 95.1% of

the Earth’s density (Williams, 2010). The surface gravity is about 90.7% of its value on

Earth (Basilevsky and Head, 2003). Venus also is similar to Earth in its relative position

from the Sun, where it orbits around the Sun in an equivalent of 225 earth days (Williams,

2010; Davis, 2012). Before space exploration, the surface of Venus was expected to be very

similar to Earth; however, later discoveries found that it had many different and unique

characteristics (Basilevsky and Head, 2003).

 The sidereal rotation period of Venus is much slower than Earth’s. Venus is rotating in a

retrograde fashion with a Venus sidereal day being equivalent to -243 Earth days (Williams,

2010; Davis, 2012). Taking both rotations into account, Venus has a solar day of about 117

Earth days, with 58.5 Earth days remaining sun-illuminated and the other 58.5 Earth days

without light (Basilevsky and Head, 2003). In addition to this difference, Venus lacks a

moon, a magnetic field, and atmospheric water; it was determined that 96.5% of the

                                                                                             1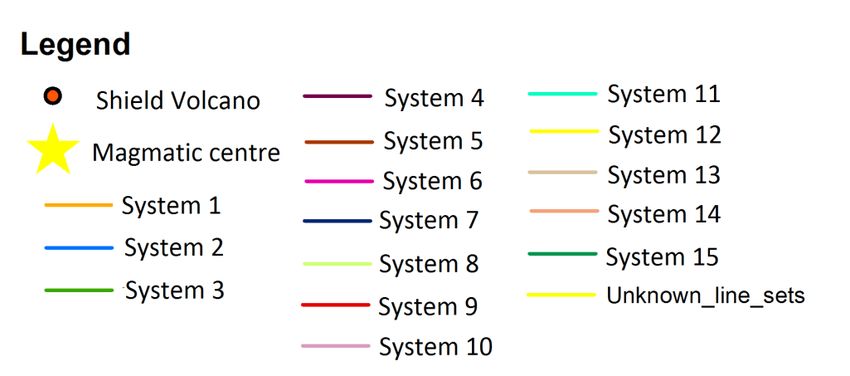
atmosphere was made up of carbon dioxide, contributing to an extremely high average

temperature of about 450°C and a high atmospheric pressure of about 9300 kPa (Nimmo

and McKenzie, 1998; Williams, 2010).

1.2-      Mapping on Venus

        The surface of Venus was previously unexplored due to the large sulphurous-yellow

      cloud that obscured most of its surface and was opaque to regular cameras (Williams,

      2005). It was not until the development of synthetic aperture radar imaging (SAR), as

      well as its application during the Pioneer Venus Mission in 1978 and the Venera 9

      Mission in 1975, that surface exploration could occur (Williams, 2005). During the

      Magellan Mission of the early 1990s, the latest Mission dedicated to studying the

      surface of Venus, the surface of the planet was remapped at a resolution of 75 m/pixel,

      which was ten times greater than the previously taken images (Williams, 2005). These

      images are available on the USGS planetary website1. With the availability of the

      Magellan SAR images, systematic efforts to map the entire surface of Venus at 1:10M

      and 1:5M scales have occurred, with a few areas still in progress.

1.3-      The Venus Global Dyke Swarm Mapping Project

    The most recent global geological map of Venus has been produced by Ivanov and Head

(2011). A project led by Dr. Richard Ernst and Dr. Claire Samson at Carleton University,

known as the Venus Global Dyke Swarm Mapping Project, has focused on mapping the

surface of Venus with greater detail and concentrating on radiating dyke swarms. This

project aims to produce a global map of all the graben-fissure systems mapped out at the

highest resolution available, and to assess which systems are underlain by dyke swarms in

1
    http://www.mapaplanet.org/

                                                                                                2
order to gain a better understanding of the tectonic and magmatic history of Venus (Ernst
et al., 2009; Studd et al., 2011).
1.4- Research Objectives
For my thesis, I am mapping the graben-fissure systems that are found in the Taussig and
Galindo regiones of Venus as part of the Venus Global Dyke Swarm Mapping project. I am
also mapping the varying thickness of the areas flooded by lava flows found within my
study area, defining the areas of thick flooding, partial flooding, and no flooding. My study
area was chosen because it was expected to have an abundance of graben-fissure systems,
and therefore an abundance of cross-cutting relationships to help determine its tectono-
magmatic history. In addition to mapping the surface features, I will also compare my
findings with the map produced by Ivanov and Head (2011) and Chapman (1999), to better
understand the geological history and processes of this area of Venus.
3Figure 1. Study area of this thesis: (Top) The boundaries of my research area, outlined in
black. Image from Herrick (1999). (Bottom) Corresponding SAR image acquired during the
Magellan Mission. Locations of subsequent figures are outlined in white.
4Chapter 2: Background Information
2.1- Previous Missions to Venus
The majority of our information on Venus can be attributed to planetary Missions that
were sent to collect the data. Early attempts to explore Venus began in 1961, when several
spacecraft belonging to the Sputnik, Venera, and Mariner series were launched (NSSDC,
2012). The Mariner 2 marked the first successful planetary spacecraft, where it flew by
Venus in 1962 (NSSDC, 2012). Since its success, several later spacecraft, including the
Mariner 5 (1967), Mariner 10 (1973), Vega 1, and 2 (1984) were sent to fly by Venus. These
spacecraft were dedicated to collecting data on the temperature and composition of the
atmosphere. Other spacecraft, including those of the Venera series from 9 (1975) through
14 (1982), were dedicated to measuring more aspects of Venus’s atmosphere and surface,
including the temperature, pressure, and composition. Venera 13 and 14 were also
dedicated to analysing the composition of the rocks on the planet (NSSDC, 2012).
The Venera 9 spacecraft provided the first glimpse of Venus’s surface in 1975, using a TV
panoramic view from the lander (Basilevsky and Head, 2003). In 1978, the first spacecraft
equipped with a synthetic aperture radar (SAR) sensor, the Pioneer Venus Orbiter, was
sent to create a global map (at a resolution of 50-140km/pixel) of the surface of Venus. The
Venera 15 and 16 spacecrafts were also equipped with a SAR sensor, and produced a higher
resolution (about 1.2- 2.4 km/pixel) map of Venus in 1983 (Tanaka, 1994; NSSDC, 2012).
The most recent Mission that focused on global SAR mapping was the Magellan Mission
launched in 1989 (NSSDC, 2012) with a resolution of about 75m/pixel. Recent Missions to
Venus include the Venus express launched in 2005, and a few ongoing and upcoming
Missions include the MESSENGER and Akatsuki (NSSDC, 2012).
52.2- The Magellan Mission
The Magellan Mission was launched on May 4, 1989, arrived at Venus on August 10, 1990,
and began systematic radar imaging on September 15, 1990 (Tanaka, 1994; Williams, 2005).
The Mission’s main goals were to obtain a near-global radar map of the surface of Venus
using the SAR sensor, obtain a near-global topographic map of Venus using the altimeter,
and to obtain high resolution global gravimetric data (Tanaka, 1994; NSSDC, 2012).
The Magellan was divided into six cycles, where each cycle lasted about 243 Earth days,
and orbited Venus about 7.5 times per day (Tanaka, 1994). During the first three cycles, a
total of 98.3% of the surface was mapped, with 83.7% of the surface mapped in the first
cycle in the left looking position, 54.5 % of the surface mapped during the second cycle
using the right looking position, and 22.8% of the surface mapped again in the third cycle in
the left looking position (Tanaka, 1994); (Williams, 2005). Cycles four and five focused on
global gravimetric data of Venus, and beyond the fifth cycle Magellan conducted a special
experiment, known as the windmill experiment. In this experiment, the solar panels of the
spacecraft were tilted at an angle so that the atmospheric drag would put a torque on the
craft. The corrections that were required to offset this torque gave information on the upper
atmosphere (NSSDC, 2012; Williams, 2005).
2.3- Synthetic Aperture Radar
Synthetic Aperture Radar (SAR) was used in order to map the surface of Venus, since
radar waves are unaffected by cloud cover (Basilevsky and Head, 2003). The Magellan
spacecraft was equipped with a large (3.7m) high-gain antenna dish, along with a SAR
sensor behind the dish that could detect emitted wavelengths of 12.6 cm (Tanaka, 1994;
Ford, 2004). As the transmitted radar signal travelled to the surface of Venus, the radar
6sensor received image data by sensing the backscatter of the waves reflected against the
planetary surface (Young, 1990; Tanaka, 1994).
Where regular radar would transmit and receive the signal in one location, SAR involved
emitting waves in rapid succession, as well as receiving the backscattered signals (echoes)
while the sensor (on the spacecraft) is in motion (Tanaka, 1994; Williams, 2005).The
received signals are post-processed with a computer, based on the known topography,
spacecraft parameters, large incidence angles, and motion of the spacecraft (Tanaka, 1994).
The processed data resulted in images with a resolution of 75 m/pixel, a resolution that
would have normally been generated with an aperture much larger than the spacecraft’s
(Tanaka, 1994; Williams, 2005).
2.4- Geological Background of Venus
From early data collected on the surface rocks of Venus by the Venera and Vega landers,
it has been determined that the surface is made up of basaltic rocks (Basilevsky, 2003;
NSSDC, 2012). With the interpretation of the SAR images, the surface of Venus was shown
to be covered with various volcanic, extensional, and highly deformed features; many of
these features are similar to the volcanic features found on Earth, while other features are
unique to Venus. Notably throughout Venus’s geological history, there has been no sign of
plate tectonics (Basilevsky and Head, 2003).
The features that have been found on Venus have been reported to correspond to the post-
Paleozoic, late-Phanerozoic, and possibly as far back as the middle to late Proterozoic on
Earth (Basilevsky and Head, 1998). In comparison to Earth’s geological history in the past
2 Ga, which has shown a consistent global balance of extension and compression at the
divergent and convergent plate boundaries, Venus’s geological history was characterized by
7the frequent switching of dominance between extension and compression events. Initially
there was a dominance of compression features, changing to a dominance of extension
features, back to compression, and finally dominance again in the formation of extension
features (Basilevsky and Head, 1998). Over time, the amount of deformational structures
on Venus decreased.
The surface of Venus has a low global impact crater count of around 1000, which suggests
that most of the surface is relatively young. It has been hypothesized that there was a
major global resurfacing event (Basilevsky and Head, 1998; Ivanov and Head, 2011). Based
on local crater counting, the majority of the surface is also reported to have a uniform
surface age of approximately 300-600 Ma, which suggests that the resurfacing occurred
around that time frame (Nimmo and McKenzie, 1998). The global resurfacing event is also
thought to have occurred within a short period of 100 Ma (Nimmo and McKenzie, 1998),
although a longer time span cannot be ruled out (e.g., Ernst and Desnoyers, 2004) and
models of continuous resurfacing are also possible.
There are three distinctive phases of geological history on Venus: they are known as the
Fortunian, Guiniverian, and Altian phases (Ivanov and Head, 2011). The Fortunian phase
was distinguished as having intense deformation and a thickened crust, while the
Guiniverian phase involved intense volcanic activity and formed many of the radiating dyke
swarms. These phases were followed by the Altian phase, which is characterized by the
abundance of lava flows on the surface. It has been suggested that about 70% of the surface
was covered during the Guiniverian phase, while the Altian phase covered about 19% of the
surface.
8Chapter 3: Methods
3.1- Using SAR images on ArcGIS10 and Interpretation of SAR images
For this study, 4 left-looking SAR images bounded by latitudes 0° and -20°, and
longitudes 230° and 265° on Venus were obtained in the sinusoidal projection from the
USGS planetary website, as TIFF formatted images. The TIFF image format was chosen in
order to remain consistent with previous mapping efforts on Venus by our group, such as
Studd (2006), Gupta (2007), Studd (2010), and Davey (2012). These images were imported
into ArcGIS 10, and georeferenced using the geodetic parameters for Venus. A sinusoidal
projection centred on a meridian of 247.5 was selected for display during mapping and all
the maps of this thesis are in this projection.
Mapping the features on these images began with delineating a well-defined radiating
graben-fissure system and extending it further from its centre. Additional units were
mapped in different colours. While the SAR images appear to be the same as regular
photographs in depicting topographical features, the SAR sensor is different from a
conventional camera in that that the radar waves are the source of illumination, instead of
the Sun (Tanaka, 1994). Due to the aperture looking from the left side, the radar waves
that strongly reflect back to the antenna will appear brighter in the image, and indicate a
facing sloped feature (Tanaka, 1994). When the radar waves are reflected in directions
away from the antenna, they will appear darker in the image. This usually indicates
specular reflection from a flatter surface.
This illumination property can be used to identify geological features that are found in the
SAR images. For example, depending on the orientation of the linear features with respect
9to the illuminating radar waves, only one side of the graben would be seen as strongly
reflected lines in the SAR images.
Figure 2. A diagram of left looking illumination against a smooth (left) surface, and a rough
(right) surface.
3.2- Identification of Geological Features on Venus
The various features that were encountered during mapping included domal features
such as coronas and shield volcanoes, compressional and extensional features such as
wrinkle ridges and graben-fissure systems, and other features such as impact craters, and
lava flows.
Dyke Swarms
Dyke swarms are often associated with the extensional linear features of graben-fissure
systems, which are frequently arranged on the surface in a radial pattern centred on a
10volcanic centre (e.g. Fig. 3). However, in many cases there is no apparent magmatic activity
at the focus of the radiating system; these are known as “cryptic centres”. Other patterns
include the linear patterns, which are sets of graben-fissures that share a similar trend
direction, and the circumferential patterns, which are often found near coronae (Ernst et al.,
2003; Studd et al., 2011). The linear patterns may also transition to a curved or fanning
pattern at one end. Graben-fissures are often found intersecting with other sets of graben-
fissures.
Figure 3. (Top): An example of a radiating (blue) and a partially circumferential (yellow)
graben-fissure system. (Bottom): An example of a linear graben-fissure system (purple).
Location shown in Figure 1.
11Coronae
Coronae do not have an analog on Earth, and are recognized by a circular to oval shaped
uplifted annulus that surrounds a lower area flooded by plains-forming volcanics
(Basilevsky and Head, 2003). These features are associated with domal uplift, followed by a
collapse in the centre that produces the characteristic annulus (Ivanov and Head, 2011).
Radiating dyke swarm patterns are often associated with coronae, where their pattern
converges within the inner rim of the corona (Studd et al., 2011).
Figure 4. An example of a corona. Location shown in Figure 1.
12Flood Boundaries
Local volcanic flooding often varies in brightness, which suggests that the surface of the
lava flows vary in smoothness (Basilevsky and Head, 2003). The magmatic source can often
be inferred based on the lobate patterns of the flows which trend in the direction of flow
(Fig.5). Areas that are clearly covered by lava flows will be described as “flooded”. Those
flooded areas that are not cut by wrinkle ridge deformation are generally considered to be
the youngest (Basilevsky and Head, 2003). In addition, elevated areas that are surrounded
lava flooding but remain unflooded themselves are inliers that preserve the pre-flooding
surface. These inliers often show clearer features of older generations of graben-fissure
systems.
Figure 5. An example of lobate flows in the study area. Location shown in Figure 1.
Other features
Other features include impact craters, pit-crater chains, and shield volcanoes. Impact
craters are characterized by the ‘mottled’ texture of an irregular-shaped circular feature,
with a smooth centre, while pit crater chains are chains of ‘sinkholes’ typically aligned
13subparallel to and sometimes along graben-fissure systems (Davey, 2012; Davey et al.,
2013). Shield volcanoes are characterized by their domal appearance, and are often found
with a small pit-shaped centre (central caldera).
Figure 6. Various features found on Venus (top): an impact crater, shield volcanoes (bottom):
pit craters along a graben. Locations shown in Figure 1.
143.3- Cross-cutting Relationships
Cross-cutting relationships were observed in several areas around the Dhorani Corona (-
116.7°, -8.2°), (Fig. 1) and showed multiple types of such relationships. Intersecting dyke
swarms, partially exposed (i.e., partially flooded) radiating dyke swarms, and regions of
lava flooding were the main features used to infer cross-cutting relationships. Cross-cutting
relationships were evaluated between pairs of systems, and were tallied with an Excel
spreadsheet with a point added in each case to the younger graben (Table 2). In each case,
whenever a younger looking graben in one system appeared to be cross-cutting the other
graben in another system, a tally was given to the cross-cutting segment. The resulting
totals were compared with each other- the unit with the higher sum would be considered as
the younger unit.
Flooded to partially flooded areas were also observed to help determine the relative ages
of the identified systems. Shallow flooded areas appear to have faded graben-fissure
systems, while in deeply flooded areas all older graben-fissure systems are completely
obscured. Younger (cross-cutting) graben-fissure systems can be distinguished from older
partially flooded systems as follows: younger systems remain very bright against these
smooth surfaces, while older graben-fissure systems that were partially flooded appear to
be more faded than those in the areas outside of the shallow flooded area. Inliers indicate
an area of high topography, and often contain well preserved, older generations of graben-
fissure systems.
15Ddds
Figure 7. An example of cross-cutting relationships between intersecting graben-fissure
systems. The lighter blue graben cross-cuts all of the graben sets, followed by the green
graben cross-cutting the dark blue and purple graben sets, and the dark blue cross-cutting
the purple graben segments.
Chapter 4: Observations
4.1- Radiating Dyke Swarms observed
Within my study area ( -120.5°,-3.4° to -112.6°, -9.8°) (located mainly within the Galindo
quadrangle and covering approximately 573 645km2), 13 graben-fissure systems were
identified. Most of these graben-fissure systems were closely situated around the feature,
Dhorani Corona (Fig. 1; Table 1), with 5 sets found to be cross-cutting each other in the
northwest of the feature where the greatest density of graben-fissures were observed. One
set was identified as having a distinct radiating pattern, while four sets showed a fanning
pattern, and eight other sets appeared to be linear or were too small to discern a pattern.
Most graben-fissure systems that were identified in this area were partially to completely
flooded.
16Cross-cutting relationships were observed between systems 2, 3, 4, 5, 6, and 7 (Group 1)
as well as between systems 2, and 8 only (Group 2, shown in Fig. 9) and tentatively
observed in between systems 13, 14, and 15 (Group 3, shown in Fig. 10). In the first group,
a total of 697 cross-cutting intersections were observed. These findings are summarized in
Table 2.
In the second group, systems 2, and 8 had a more straightforward chronological
relationship with significantly fewer, but easier to interpret, intersections encountered.
System 8 appears to be consistently cross-cut by system 2, suggesting that system 8 is older
than system 2. This is further suggested by the limited coverage of system 8, being
restricted to the west side of the Dhorani Corona, whereas system 2 proliferated throughout
most of the section.
In the third group, systems 13, 14, and 15 were flooded with a shallow layer of lobate flows
trending to the south; this suggested that the source of flooding came from system 2, and
that system 2 was younger than these systems. System 14 appeared to strongly cross-cut
system 2, suggesting that system 14 was younger than system 2. The cross-cutting
relationship between system 13 and 15 was not clear, as they both were strongly obscured
by the shallow flooding.
1718
Figure 8. (Top) An overall view of all the mapped graben-fissure systems and their link

with magmatic centres where known. (Bottom) A simplified diagram of the top map.

Figure 9. Cross-cutting relationships between Systems 2 (blue), and 8 (green). System 2 is

cross-cutting System 8. Location shown in Fig. 1.

                                                                                          19
Figure 10. Cross-cutting relationships between Systems 13, 14, and 15. Location shown in
Fig. 1.
Table 1: A summary of all mapped graben-fissure systems. Identification column represents which systems
were already identified.
System # System Type Identification Graben Type Trend Magmatic centre type Approx. Centre Location Distance from centre
1 Graben Unidentified Linear NW-SE Cryptic (-116°, -17.5°) 81.3 km
2 Graben Dhorani Corona Radiating n/a Visible (-116.7°, -8.2°) 8.2 km
3 Graben Unidentified Radiating NE-SW Cryptic n/a n/a
4 Graben Unidentified Linear W-E Cryptic n/a n/a
5 Graben Unidentified Individual N-S Cryptic n/a n/a
6 Graben Unidentified Linear W-E Cryptic n/a n/a
7 Graben Unidentified Radiating N-S Cryptic (-117.8°, -7.3°) 79.8 km
8 Graben Unidentified Radiating NE-SW Cryptic n/a n/a
9 Rift Identified n/a W-E n/a n/a n/a
10 Graben Unidentified n/a N-S Cryptic n/a n/a
11 Graben Unidentified Radiating NW-SE Cryptic (-121.6°, -3.6°) 132.3 km
12 Graben Unidentified n/a N-S Cryptic n/a n/a
13 Graben Unidentified n/a W-E Cryptic n/a n/a
14 Graben Unidentified n/a NW-SE Cryptic n/a n/a
15 Graben Unidentified n/a NNW-SSE Cryptic n/a n/a
20Table 2. Number of observed cross-cutting relationships between systems 2, 3, 4, 5, 6, and 7. In each pair of
comparisons those sites in which a graben of system x cross-cut a graben of system Y were tallied under the
system x heading and those in which the opposite cross-cutting relationship occurred and the system Y graben
was younger were tallied under the system Y heading.
System 7 System 3 Overall System 3 System 2 Overall System 2 System 4 Overall
Total tallies 57 80 137 Total tallies 28 67 95 Total tallies 71 9 80
Tally % 42 58 Tally % 29 71 Tally % 89 11
System 7 System 2 Overall System 3 System 4 Overall System 2 System 5 Overall
Total tallies 7 32 39 Total tallies 64 55 119 Total tallies 4 1 5
Tally % 18 82 Tally % 54 46 Tally % 80 20
System 7 System 4 Overall System 3 System 5 Overall
Total tallies 107 69 176 Total tallies 0 5 5
Tally % 61 39 Tally % 0 100
System 7 System 5 Overall
Total tallies 2 9 11
Tally % 18 82 System 4 System 5 Overall
System 7 System 6 Overall Total tallies 1 11 12
Total tallies 13 5 18 Tally % 8 92
Tally % 72 28
4.2- Flooded regions and inliers
Within the area surrounding the Dhorani Corona, about 269 inliers were mapped and
were mostly found within the northern half of the area. There inliers occupied about 5% of
the total study area. One large inlier, located around (-119.7, -4.5) appeared to have
similarly trending graben-fissure systems as system 3, as well as several smaller inlets,
located around (-117.5, -5.0). About 35% of the study area appeared to be deeply flooded,
whereas about 60% of the area ranged from having moderate to shallow flooding. Shallow
flooding was recognized where the prior graben-fissure systems are only obscured by lava
flooding. The majority of the deeply flooded areas appeared to be associated with system 2,
as indicated by the outlined lobate flows which face outward from the system.
2122
Figure 11. (Above) The overall mapping of flooded and non-flooded areas, and approximate

areas of deep flooding. (Below) The overall mapping of inliers.

Chapter 5: Discussion

5.1- Magmatic centres and their distributions

 Graben-fissure systems have been associated with extensional features, such as magmatic

plumes and rifts. Linear graben-fissure systems are mostly associated with rifting events,

whereas radiating systems are associated with dyke swarms that are fed by a magmatic

plume centre (Ernst et al., 2003). The magmatic origin of radiating patterns may be further

suggested by their association with other volcanic features, such as coronae, pit crater

chains and intersecting shield volcanoes.

                                                                                             23
According to Studd et al. (2011), radiating graben-fissure systems are often found to
converge in the interior coronae. System 2 had such a relationship with the Dhorani Corona.
As another example, system 11 trends toward a corona, suggesting that its magmatic
centre was also located in the corona interior. In the overall study area, many of the
graben-fissure systems were found to be obscured by partial or complete flooding. Although
this was the case, many of the incomplete systems (systems 3, 7, 8, 11) had signs that
suggested they were part of a radiating system. The presence of shield volcanoes that were
mostly found around systems 3 and 7 suggests that these systems were also related to some
volcanic activity. Furthermore, incomplete graben-fissure systems such as systems 7 and 11
showed a slightly converging pattern toward one end, which also suggested they were part
of a radiating system. Having a radiating pattern suggests that these systems originate
from a magmatic centre.
Due to the partial flooding, the majority of systems have hidden magmatic centres, known
as “cryptic” centres. Using the fanning patterns of the systems, the end that appeared to be
converging was used to infer the location of their cryptic magmatic centres. With this
method, system 3 is thought to have a cryptic magmatic centre that was located southwest
from the majority of the mapped graben segments. System 7 may have had a cryptic centre
located approximately 82 km south from the southernmost portions of the system.
5.2- Cross-cutting relationships and their relative ages of associated magmatic
centres
Based on the intersections made between systems 2, 3, 4, 5, 6 and 7 (summarized in Table
2), the relative ages of the systems were suggested to be (from oldest to youngest systems):
system 4 or 6, followed by system 7, system 3, system 5, and system 2 as the youngest
24system. Although graben from system 6 did not cross-cut graben from system 4, system 6 is
thought to be older than system 4 due to its more limited extent, and lack of radar
brightness in comparison.
Inliers also have helped with the interpretation of the relative ages of graben-fissure
systems. In this case, system 3 was found to be related to the graben within the inliers in
the northwest portion of the study area, and suggested a cross-cutting relationship with
systems 4 and 7. These two systems were not found within the inlier units, but were mostly
found within the partially flooded areas as faded features. This relationship may be due to
a shallow flooding event, with its source associated with system 3. This was further
suggested by the flow pattern surrounding the inliers, which had lobe-like shapes that
similarly trended in the NE-SW direction. An alternate interpretation may be that the
partial flooding came from system 2, but the flooding became restricted to flowing in a
similar pattern as the pre-existing grabens of system 3. In Figure 12, the flooded areas
partly follow the graben-fissure systems 2 and 3 into the topographic high areas (inliers).
Although these mapped graben fissures features were, in most cases, distinct from one
another there are often areas where the trends between two separate systems are locally
the same and in such cases assigning an individual to one swarm or the other is speculative.
This is especially true for adjacent radiating systems; dykes trending between the two
radiating system would have the same trend and deciding which radiating system they
belong to can be difficult. There was local overlap between graben-fissure systems of
systems 2 and 11, 2 and 7, as well as of 4 and 3.
2526
Figure 12. Partially flooded area, showing topographic high areas (Inliers). Location shown

in Figure 1.

                                                                                         27
5.3- Systems associated with a corona Annulus
Circumferential systems are almost exclusively associated with coronae, and may in some
cases be of tectonic origin, although there have been some suggestions that some
circumferential systems could also be underlain by dykes (Ernst et al., 2003; Studd et al.,
2011). System 1 (Fig. 8) is concentrated in the topographically elevated inlier corresponding
to the rim of the corona, and initially was thought to represent a circumferential system.
Both it and system 2 which radiates from the centre of this corona, were suggested to be
relatively similar in age to each other, as system 1 showed a transition from strongly cross-
cutting system 2 to gradually being flooded by the lobate flows from system 2. In addition to
this pattern, about 30 km east from the radar-bright features of system 1, there were a few
faint graben segments that trended in a NNW-SSE direction. These features appeared to be
associated with system 1, and may also suggest that system 1 is not actually a radiating
system, but part of a regional linear system best preserved in the inlier associated with the
rim of the corona.
Furthermore, it is possible that, when taking a more regional view, systems 1, 10, and 12
may belong together as one radiating system.
5.4- Flooding and its association with resurfacing events
It has been suggested that about 70- 80% of the surface of Venus was covered during a
global resurfacing event, while about 10-19% of the surface would be covered by younger
flooding events (Nimmo and McKenzie, 1998; Ivanov and Head, 2011). Two mechanisms
have been proposed to explain major resurfacing events, with one model based on plate
tectonics and the other based on mantle plumes (Nimmo and McKenzie, 1998). The plate
tectonics model suggested that the majority of the resurfacing was attributed to the
28extrusion of lava at divergent plate boundaries, whereas the mantle plume model suggested
the resurfacing may be due to a high production rate from plumes originating within the
mantle.
With the mantle plume model, in order for a global resurfacing event to occur in less than
100 Ma with only 100 mantle plumes available, the production rate would needed to have
been 25% higher than the more recent production rate that was found on Venus (Nimmo,
1998). In the study area alone, at least 4 new radiating dyke swarms were revealed,
suggesting that regional mapping at a higher resolution may continue to increase the
number of global dyke swarms and corresponding mantle plumes. Although this is an
extremely small portion of the surface (covering about 0.001% of the entire planetary
surface) these findings suggest that high-resolution mapping can reveal far more detail
than reconnaissance mapping, as suggested by Ernst et al. (2003). With an increasing
detection of graben-fissure systems linked to underlying radiating dyke swarms, and
associated mantle plumes, it has been suggested that there will eventually be up to a
thousand plumes identified on Venus that could potentially further support the plume
model for global resurfacing.
5.5- Comparisons to previous mapping
Previous mapping efforts were made in my study area at the 1:5M scale by Chapman
(1999) and at the 1:12 M scale by Ivanov and Head (2011). These maps both identified
system 2, with Chapman’s map naming the feature as part of the “Dhorani Corona”. In
Chapman’s map, the majority of the southern area was identified under corona material
unit k (COk), and the northern area identified as unit f2. F2 was considered to be the older
unit (described as being frequently overlain by corona material), while the younger unit
29COk was associated with radial fracturing (graben-fissure systems according to my
mapping).
In the map produced by Ivanov and Head (2011), most areas that appeared to be radar-
bright were grouped together as the Grove Belt (gb) unit, whereas the very radar-dark
areas were grouped as the Lobate plains material (pl), and the radar-dark areas that
showed no lobate flow patterns were grouped as the shield plains material (psh) unit.
Groove belts were described as having prominent swarms of graben and fractures, lobate
plains material was associated with relatively young volcanism from coronae, and shield
plains were associated with abundant global volcanic activity with initially small-scale
eruptions occurring across the planet. The relative ages between each unit were described
from oldest to youngest as unit gb, followed by unit psh, and unit pl.
In comparison to my mapping of the high resolution SAR images, Chapman 1999, and
Ivanov and Head 2011) identified significantly fewer graben-fissure systems. At high
resolution, many of the graben-fissure systems mapped herein were found to be partially
flooded. This suggested that the flooding from the Dhorani Corona could have further
extended to the northwest, although it cannot be confirmed due to the lack of lobate flows
around the area. When compared with the inliers highlighted, the patterns suggested two
different flow directions trending NE-SW and NW-SE; however, this may just be due to the
shape of the topographic-high areas.
30Chapter 6: Conclusion
It was determined that about 13 graben-fissure systems were identified, with 6 systems
identified as radiating systems, 3 identified as linear, and 1 system identified as associated
with the corona annulus that may be part of a broader, mostly flooded linear or radiating
system. The abundance of different radiating systems that were found northwest from
Dhorani Corona suggested that the thickness of the lava flow accumulation was small,
resulting in only partial flooding of the graben-fissure systems. Based on cross-cutting
relationships between the systems it was suggested that system 2 was the youngest; the
partial flooding observed in the area to the northeast from the centre may have also come
from this system. The discovery of new radiating dyke swarms also suggested that there
were more than the original global count of 100 magmatic plumes, which may also support
the mantle plume theory related to the global resurfacing event.
6.1- Future Research
Many of the features that surround this area may offer more insight to the evolution of
the planet Venus. Just north of the studied area, there are several more coronae associated
with graben-fissure systems, which may significantly contribute to the global plume count.
To the west of the study area, there is an area that appears to be as complex as the study
area. This area appears to have several different graben-fissure systems, and show an
intense contrast between a flooded area and several other graben-fissure systems.
31References
Basilevsky, A.T. and J.W Head. 1998. The Geologic History of Venus: a Stratigraphic View.
Journal of Geophysical Research 103 (E4): 8531- 8544.
Basilevsky, A.T. and J. W. Head. 2003. The surface of Venus. Reports on Progress in Physics
66(2003):1699-1734.
Bryan, S. and Ernst, R.E. 2008. Revised definition of Large Igneous Provinces (LIPs).
Earth-Science Reviews 86: 175-202.
Chapman, M.G. 1999. Geologic/Geomorphic Map of the Galindo Quadrangle(V–40), Venus
[map]. 1: 5 198 991, 1mm= 5.199km. Denver: National Aeronautics and Space
Administration. Aug. 1997.
Coffin, M.F., and Eldholm, O. 1994. Large igneous provinces: crustal structure, dimensions,
and external consequences: Review of Geophysics 32: 1-36.
Davey, S., Ernst, R., Samson, C., and Grosfils, E.B. 2013. Hierarchical clustering of pit
crater chains on Venus. Canadian Journal of Earth Sciences 50: 109-126; doi:
10.1139/cjes-2012-0054.
Davey, S. 2012. Mapping graben-fissure systems and the distribution of pit crater chains on
Venus. M.Sc. thesis, Department of Earth Sciences, Carleton University. (co-
supervisor: R. Ernst)
Davis, P. 2012. Solar System Exploration: Venus. NASA
http://solarsystem.nasa.gov/planets/profile.cfm?Object=Venus&Display=Facts&Syste
m=Metric
32Ernst, R.E., and Desnoyers, D.W. 2004. Lessons from Venus for understanding mantle
plumes on Earth. Special Issue of Physics of the Earth and Planetary Interiors, 146:
195-229. [Corrigendum, 2005, 149: 371].
Ernst, R.E., D.W. Desnoyers, J.W. Head, and E.B. Grosfils. 2003. Graben–fissure systems
in Guinevere Planitia and Beta Regio(264◦–312◦E, 24◦–60◦N), Venus, and
implications for regional stratigraphy and mantle plumes. Icarus 164 (2003): 282-
316.
Ernst, R.E., Grosfils, E.B., Head, J.W., Samson, C., Ivanov, M.A., Studd, D., Harris, B.A.
2009. Towards a dyke swarm map of Venus. [Invited Abstract] 2009 Joint Assembly
Meeting CGU, GAC, IAH-CNC, MAC, SEG, MSA, GS, AGU (24-27 May 2009,
Toronto Canada). Abstract in EOS Trans. AGU, Jt. Assem. Suppl., 90(22), GA13A-06
Gupta, V. 2007. Venusian canali : geological and topographic relationships. B.Sc. thesis,
Department of Earth Sciences, Carleton University. (co-supervisor: R. Ernst)
Herrick, R. 1999. Geophysics Research Letters, v. 26, 803- 806.
NSSDC. 2012. Magellan Spacecraft. NASA.
http://nssdc.gsfc.nasa.gov/nmc/spacecraftDisplay.do?id=1989-033B
Nimmo, F., and D. McKenzie.1998. Volcanism and tectonics on Venus. Annual Review of
Earth and Planetary Sciences 26 (1): 23-51.
Ford, J. p. 2004. Chapter 1. Magellan: The Mission and the System.
http://history.nasa.gov/JPL-93-24/ch1.htm
Ivanov, M.A. and J.W. Head. 2011. Global geological map of Venus. Planetary and Space
33Sciences 59(2011): 1559-1600.
Studd, D. 2006. Mapping of the canali of the Nsomeka Planitia and eastern Aino Planitia
on Venus. B.Sc. thesis, Department of Earth Sciences, Carleton University. (co-
supervisor: R. Ernst)
Studd, D., R.E. Ernst, and C. Samson. 2011. Radiating graben–fissure systems in the
Ulfrun Regio area, Venus. Icarus 215(2011): 279-291.
Studd, D. 2010. Radiating graben-fissure systems in Ulfrun Regio, Venus. M.Sc. thesis,
Department of Earth Sciences, Carleton University. (co-supervisor: R. Ernst)
Tanaka, K.L. 1994. The Venus geologic mappers’ handbook, second edition. USGS open
file report 94-438.
Williams, D. 2005. Magellan Mission to Venus. NASA.http://nssdc.gsfc.nasa.gov/planetary/
magellan.html
Williams, D. 2010.Venus Fact Sheet. NASA. http://nssdc.gsfc.nasa.gov/planetary/factsheet/
venusfact.html
Young, C (ed). 1990. The Magellan Venus Explorer’s Guide. NASA-JPL.
http://www2.jpl.nasa.gov/magellan/guide.html
34You can also read