9th MEETING OF THE SCIENTIFIC COMMITTEE - SPRFMO
←
→
Page content transcription
If your browser does not render page correctly, please read the page content below

9th MEETING OF THE SCIENTIFIC COMMITTEE
 Held virtually, 27 September to 2 October 2021

 SC9-DW10

Updated Candidate Encounter Thresholds for VME Indicator Taxa in the
 SPRFMO Area
 New Zealand

 PO Box 3797, Wellington 6140, New Zealand
 P: +64 4 499 9889 – F: +64 4 473 9579 – E: secretariat@sprfmo.int
 www.sprfmo.int
SC9-DW10

 South Pacific Regional Fisheries Management Organisation

 9th Meeting of the Scientific Committee

 Held virtually, 27 September to 2 October 2021

 Updated candidate encounter thresholds for VME indicator taxa in the
 SPRFMO Area

 Marco Milardi1, Shane Geange2, Ashley Rowden3

 28 August 2021

1 – Fisheries New Zealand - Tini a Tangaroa, Ministry for Primary Industries - Manatū Ahu Matua, Wellington, New Zealand

2 – Department of Conservation – Te Papa Atawhai, Wellington, New Zealand

3 – National Institute of Water & Atmospheric Research (NIWA) – Taihoro Nukurangi, Wellington, New Zealand
SC9-DW10

Contents
1. Purpose ........................................................................................................................................... 2
2. Background ..................................................................................................................................... 2
3. Methods .......................................................................................................................................... 5
4. Results ........................................................................................................................................... 10
5. Discussion...................................................................................................................................... 12
6. Recommendations ........................................................................................................................ 13
7. References .................................................................................................................................... 13
 Appendix 1 - Assignment of benthic taxonomic codes used by New Zealand scientific observers to
 VME indicator taxa ............................................................................................................................ 15
 Appendix 2 - Zero Weight Adjustments ............................................................................................ 17
 Appendix 3 - Comparisons of thresholds calculated with and without interpolation ...................... 18
 Appendix 4 Encounter thresholds calculated using inverse cumulative distribution curves ........... 20

 1

SC9-DW10

1. Purpose
 The purpose of this paper is to update candidate encounter thresholds for the 13 VME indicator taxa
 included in Annex 5 of CMM03-2021, with the intention of developing an authoritative set of
 candidate encounter thresholds for all VME indicator taxa. These thresholds would be used to inform
 any future refinement of VME encounter thresholds to adjust the level of precaution included in
 CMM03 (if required).

2. Background
 The Conservation and Management Measure for the Management of Bottom Fishing in the SPRFMO
 Convention Area (CMM03-2021) includes a bottom fishing Vulnerable Marine Ecosystem (VME)
 encounter protocol for trawl vessels, whereby if VME indicator taxa are encountered in any one tow
 at or above the threshold weight limits in Annex 6A of CMM03-2021, or three or more different VME
 indicator taxa at or above the weight limits in Annex 6B of CMM03-2021, bottom fishing vessels are
 required to cease fishing immediately within an area of one nautical mile either side of the
 encounter trawl track extended by one nautical mile at each end. The encounter is then required to
 be immediately reported to the SPRFMO Secretariat, in accordance with the Guidelines for the
 preparation and submission of notifications of encounters with potential VMEs, contained in Annex
 7 of CMM03-2021. The encounter area then remains closed to bottom fishing until the Commission,
 taking into account the Scientific Committee’s review of the encounter and its advice, determines
 management actions for the encounter area.

 The encounter thresholds included in CMM03-2021 were developed and subsequently refined
 following the presentation of SC5-DW08 by New Zealand to the 5th SPRFMO Scientific Committee,
 which outlined the utility of move-on rules as part of a bottom fishing Conservation Management
 Measure. Following discussion of SC5-DW08, in its report the Scientific Committee:
 • Agreed that move-on rules should be viewed only as “back-stop” measures (if required) to
 complement spatial closures developed using decision-support software and designed to
 prevent significant adverse impacts on VMEs;
 • Agreed that, should a move-on rule be implemented as part of the revised CMM for bottom
 fisheries, the threshold for triggering such a rule should be high. Ideally a move-on response
 should follow more than one encounter involving weights of bycatch of benthic fauna that
 would indicate the models used to predict the distribution of VME taxa are misleading

 Consistent with SC5 direction that thresholds should be set high, in 2018, New Zealand presented
 SC6-DW09 to the 6th Scientific Committee which outlined a method for deriving thresholds for VME
 indicator taxa. The method was based on developing VME indicator taxon-specific cumulative
 distribution curves of historic bycatch weights and then calculating a range of percentiles from the
 ordered bycatch weights, with the percentiles serving as candidate encounter threshold values.
 Naturally occurring or ecologically relevant reference points were also calculated and used to
 identify ‘high’ candidate threshold weights for triggering move-on rules and ‘low’ candidate
 biodiversity weights indicating increasing numbers of taxa in a single tow. Following discussion of
 SC6-DW09, in its report the SC6:

 2
SC9-DW10

 • Noted that a data-informed approach has been used to identify a range of candidate
 thresholds, but the selection of a final VME [indicator] taxa threshold for bottom trawls is a
 somewhat arbitrary process;
 • Noted that insufficient data on VME distribution and density and on trawl catchability exist
 to apply more sophisticated methods;
 • Agreed that two VME indicator taxa thresholds for bottom trawl have been estimated (a
 weight threshold and a biodiversity threshold):
 o a catch of any one of the six most commonly caught VME [indicator] taxa over a
 taxon-specific threshold weight (based on the 99th percentile of the distribution of
 historical positive catch weights); OR
 o a catch of three or more VME [indicator] taxa over a taxon-specific qualifying
 biodiversity weight (based on the 80th percentile of the distribution of historical
 positive catch weights).

Subsequently, at the 7th SPRFMO Commission in 2019, thresholds based on the SC6
recommendations were incorporated into CMM03-2019.

In 2019, New Zealand presented SC7-DW13 to the 7th Scientific Committee, a review of VME
indicator taxa for the SPRFMO Convention Area. In developing the paper, New Zealand recalculated
the 80th, 90th, 95th, 97th, 98th, 99th and 99.5th percentiles as candidate VME indicator taxa thresholds
using the most up-to-date bycatch data available, but only included the 80th and 99th percentiles
upon which the thresholds in CMM03-2019 were based in SC7-DW13. The result was that SC6-DW09
presented a full range of candidate thresholds for the 10 VME indicator taxa that had been identified
at the time, whereas SC7-DW13 used more recent data for all taxa, but only presented a subset of
candidate thresholds (based on the 80th and 99th percentiles) for a broader range of VME indicator
taxa (13 taxa) to the Scientific Committee. SC7-DW13 also used a different separation of Alcyonacea
and Gorgonian Alcyonacea than that used in CMM03-2019 that better recognized differences in
structure-forming characteristics within the suborders Holaxonia, Calcaxonia and Scleraxonia. In its
report, SC7:

 • Recommended that, when the Commission reviews CMM 03-2019 in 2021, the list of VME
 indicator taxa should be revised to include the following additional taxa, noting that specific
 threshold weights may need to be revised once additional work is done to establish whether
 current thresholds are consistent with the objectives of CMM 03-2019:
 o Gorgonian Alcyonacea
 o Zoantharia
 • Recommended to the Commission that, when it reviews CMM 03-2019 in 2021, the list of
 VME indicator taxa should be revised to remove the following taxon and associated weight
 thresholds:
 o Alcyonacea
 • Recommended to the Commission that, when it reviews CMM 03-2019 in 2021, the list of
 VME indicator taxa used for the biodiversity component of the encounter protocol should be
 revised to include the following additional taxa:
 o Zoantharia
 o Hydrozoa (Hydroids)
 o Bryozoa

 3
SC9-DW10

At the 8th SPRFMO Commission meeting in 2019, the European Union introduced a proposal
(COMM8-Prop07) to make CMM03-2019 more precautionary for the avoidance of Significant
Adverse Impacts on VMEs. In particular, the proposal suggested lowering the weight thresholds for
all taxa triggering the VME encounter protocol. Following discussion, the European Union introduced
an amended proposal lowering the thresholds for stony corals from 250 kg to 80 kg based on the
98th percentile from the calculations that were done for SC7-DW13 (noting that the 98th percentile
was not presented in that paper). That proposal was adopted and the thresholds lowered in
CMM03-2020 (Table 1).

In 2020, New Zealand presented a cumulative bottom fishing impact assessment (BFIA) for
Australian and New Zealand bottom fisheries in the SPRFMO Convention Area (SC8-DW07_rev1) to
the 8th Scientific Committee, which included a risk assessment for benthic habitat, biodiversity and
VMEs. The risk assessment included an estimation of the performance of spatial management
measures included in CMM03-2020. Following discussion of the risk assessment, in its report the SC8
recommended that additional precautionary measures could be put in place to address uncertainty
in the performance of spatial management measures included in CMM03-2020. Following this
recommendation, members submitted several competing proposals to 9th SPRFMO Commission
meeting in 2020 (COMM9-Prop02, COMM9-Prop03, COMM9-Prop04). These proposals and
following negotiations mainly focussed on lowering VME encounter thresholds, with lower
thresholds variously informed by the full range of thresholds explicitly presented in SC6-DW09, the
full range of thresholds calculated for SC7-DW13 but not explicitly presented in that paper, and new
thresholds calculated for subsets of taxa that were identified in SC8-DW07 rev1 as having less
favourable levels of protection (i.e., splitting the Porifera into Demospongiae and Hexactinellidae).
Although all the proposed thresholds were based on the methodology outlined in SC6-DW09 and
reviewed by SC6, the application of the methodology to identify thresholds included in some of the
proposals had not been reviewed by the Scientific Committee. Consequently, there was considerable
debate about the transparency of using percentiles that hadn’t been explicitly reviewed by the
Scientific Committee to inform threshold selection. Following discussion, and negotiation between
members, a consensus was reached to lower thresholds for three VME indicator taxa (Table 1) and
this was incorporated into CMM03-2021.

There is a possibility that the management measures included in CMM03 may need to be continually
refined to adjust the level of precaution as a better understanding is developed of their effectiveness
in preventing significant adverse impacts on VMEs. An important tool in adjusting the level of
precaution to date has been the refinement of VME indicator taxa encounter thresholds; however,
this has been complicated due to the absence of an authoritative set of candidate thresholds that
has been reviewed by the Scientific Committee.

Here, a range of candidate encounter thresholds for all 13 VME indicator taxa included in CMM03-
2021 are recalculated using the most up-to-date trawl bycatch data (for the period 2008-2020) from
within the “Evaluated Area” of the SPRFMO Convention Area 1. Recognizing that New Zealand

1
 “Evaluated Area” means those parts of the Convention Area that are within the area starting at a point of
24°S latitude and 146°W, extending southward to latitude 57° 30S, then eastward to 150°E longitude,
northward to 55°S, eastward to 143°E, northward to 24°S and eastward back to point of origin (see Annex 1 of
CMM 03-2021)

 4
SC9-DW10

 presented a proposal to COMM9 to split Porifera into Demospongiae and Hexactinellidae, thresholds
 for those component taxa are also calculated.

 Table 1 | A history of VME indicator taxa thresholds included in Annex 6A of SPRFMO CMM03-2021. Red
 cells indicate thresholds lowered from previous year. - indicates indicator taxa not included within Annex 6,
 noting that Alcyonacea was removed in 2021 due to a reclassification of fisheries species codes contributing
 to Alcyonacea and Gorgonian Alcyonacea.

 VME indicator taxon CMM03-2019 CMM03-2020 CMM03-2021
 Porifera 50 kg 50 kg 25 kg
 Scleractinia 250 kg 80 kg 60 kg
 Antipatharia 5 kg 5 kg 5 kg
 Alcyonacea 60 kg 60 kg -
 Gorgonian Alcyonacea 15 kg 15 kg 15 kg
 Actiniaria 40 kg 40 kg 35 kg
 Zoantharia - - 10 kg

3. Methods
 Data used in the analysis were extracted from the Fisheries New Zealand Centralized Observer
 Database (cod) (accessed 28 May 2021). Data were collected by scientific observers (the New
 Zealand bottom trawl fleet has 100% observer coverage in the SPRFMO Convention Area) and
 included 10,388 New Zealand trawl tows (including both bottom and mid-water trawls) targeting
 black oreo (Allocyttus niger), alfonsinos (Beryx splendens and B. decadacylus), cardinal fish (Epigonus
 telescopus), orange roughy (Hoplostethus atlanticus) and spiky oreo (Neocyttus rhomboidalis). All
 tows were conducted within the Evaluated Area within the western part of the SPRFMO Convention
 Area (west of 143˚E longitude; Figure 1) over the period 2008–2020 2. These data consisted of tow-
 by-tow observer data with one record per benthic taxon encountered on each tow, and included trip
 number, tow number, fishing method, trawl type, benthic species code, common name, bycatch
 weight, method of weight analysis, information on whether the benthic material was encrusting
 anything or encrusted by something else, and observer comments.

 2
 These data include bycatch from areas that are now closed to fishing under SPRFMO CMM03-2021.

 5
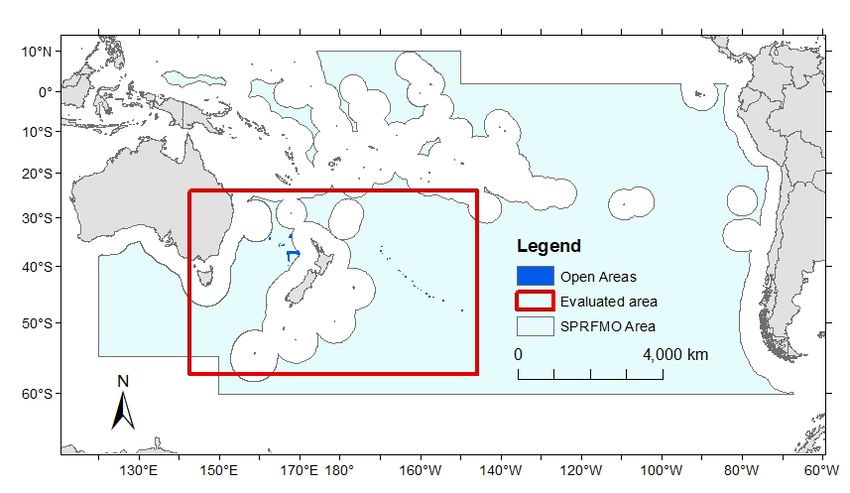
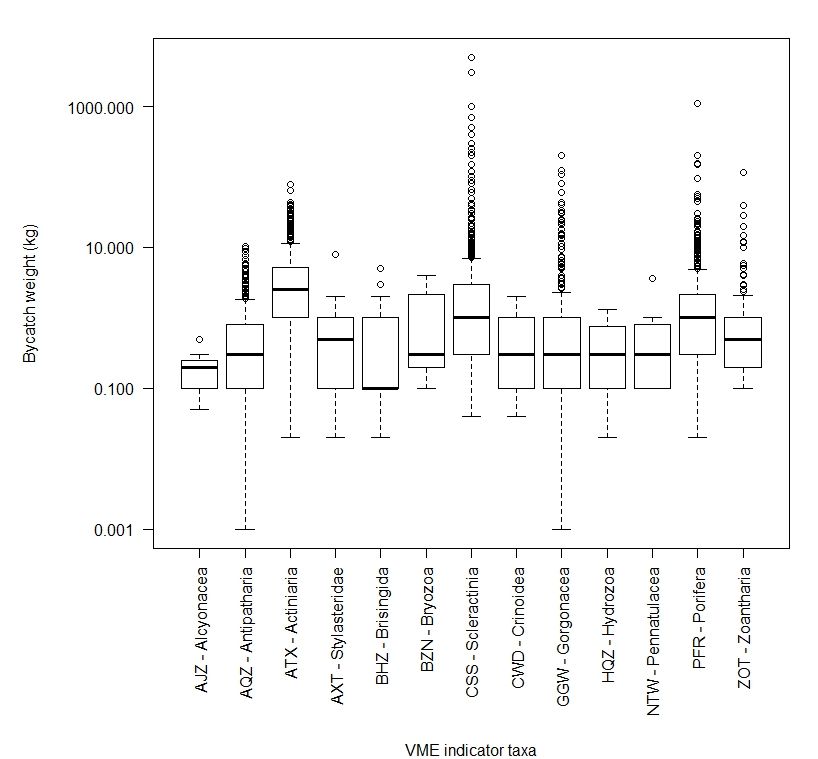
SC9-DW10

 Figure 1 | The SPRFMO Convention Area with the location of the Evaluated Area from within which data
 collected by scientific observers from 9,771 New Zealand bottom trawl tows over the period 2008–2018 was
 used in this analysis. Also shown as dark blue polygons are the locations of areas open to bottom trawling
 under SPRFMO CMM03-2021.

VME indicator taxa were defined as in Annex 5 of SPRFMO CMM03-2021 (Table 2). Only those tows
that included VME indicator taxa as bycatch (33.9% of bottom trawl tows retained VME indicator
taxa as bycatch) were selected. For tows containing VME indicator taxa as bycatch, individual VME
indicator species were aggregated into higher-order VME indicator taxa using taxonomic
designations from the World Register of Marine Species (Horton et al. 2019) (RRID:SCR_013312),
resulting in a final dataset consisting of 3,362 bottom trawl tows and 5,385 aggregated VME
indicator taxa records (Figure 2, see Appendix 1 for the allocation of New Zealand fisheries codes to
VME indicator taxa).

 Table 2 | Designation of VME indicator taxa included in Annex 5 of SPRFMO CMM03-2021.

 VME indicator taxon Common Name Qualifying Taxa
 Porifera Sponges All taxa of the classes Demospongiae and Hexactinellidae
 Scleractinia Stony corals
 Antipatharia Black corals All taxa
 Alcyonacea True soft corals All taxa excluding Gorgonian Alcyonacea
 Gorgonian Alcyonacea Sea fans octocorals All taxa within the following suborders: Holaxonia;
 Calaxonia; Scleraxonia
 Pennatulacea Sea pens All taxa
 Actiniaria Anemones All taxa
 Zoantharia Hexacorals All taxa
 Hydrozoa Hydrozoans All taxa within the orders Anthoathecata and Leptothecata,
 excluding Stylasteridae
 Stylasteridae Hydrocorals All taxa

 6
SC9-DW10

 Bryozoa Bryozoans All taxa within the orders Cheilostomatida and
 Ctenostomatida
 Brisingida Armless stars All taxa
 Crinoidea Sea lillies All taxa

Prior to analysis, data were checked for spurious bycatch weights. Of the 5,385 VME indicator taxa
records, 42 had no or zero specified weight due to either small samples (< 0.1 kg) not being
accurately weighed at sea, rounding error, or presence only being recorded. Because zero weights
are indicative of the presence of VME indicator taxa, all zero weights were retained in the analysis,
but were assigned a taxon-specific minimum weight corresponding to the minimum non-zero weight
that had been recorded for that taxon (see Appendix 2).

 Figure 2 | Bycatch weight (kg) of VME indicator taxa in New Zealand bottom trawls within the SPRFMO
 Convention Area as reported by observers for the 2008-2020 period. Within each boxplot the line indicates
 the 50th percentile (median), the box encompasses 50% of the data, from the 25th to the 75th percentile
 and the dashed vertical lines extend to 1.5 times the interquartile range, with circles indicating “outliers”.
 Note that the y-axis is plotted on a log-scale.

For each VME indicator taxon a range of percentiles (70th, 80th, 85th, 90th, 95th, 96th, 97th, 98th, 99th)
were calculated using type 7 linear interpolation included in quantile function as part of the
statistical software R (R Core Team 2019), with the percentiles serving as candidate encounter
threshold values. This approach differs from that previously presented in SPRFMO SC6-DW09, which

 7
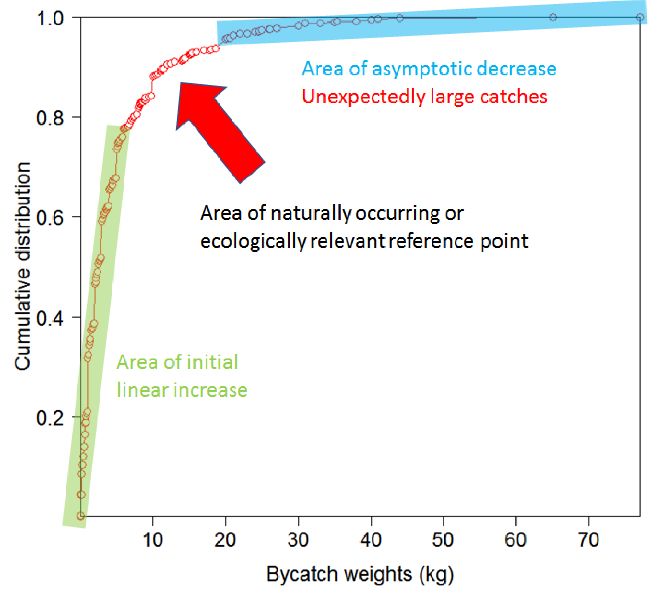
SC9-DW10

calculated candidate thresholds from ordered values without interpolation. The use of interpolation
overcomes issues related to the lower limit of the sample size required for the estimation of the
100α and 100(1-α) percentile from ordered values, which is equal to 1/α (e.g., the estimation of the
99th percentile requires 1/0.01 = 100 values). In SPRFMO SC6-DW09 the use of ordered values
resulted in some taxa having insufficient bycatch samples to calculate the full range of percentiles (a
comparison of percentiles calculated within and without linear interpolation is presented in
Appendix 3).

A proposal was tabled at SPRFMO COMM-9 to split Porifera into its component Demospongiae and
Hexactinellidae taxa and adjust the thresholds for Demospongiae in Fishery Management Areas
(FMAs) where this type of sponge was at higher risk from bottom trawl fisheries. Recognizing this,
candidate encounter thresholds were calculated for Demospongiae and Hexactinellidae separately
and in addition to calculating an overall threshold for Porifera.

To help inform the systematic selection of weight and biodiversity thresholds for individual taxa
from the candidate values, taxon-specific cumulative catch curves were examined to distinguish
between the initial part of the curve associated with linear increase, and the final part of the curve
associated with asymptotic decrease in slope. Assuming a strong relationship between the weight of
VME indicator taxa landed on deck as bycatch and the functional role of VMEs, the transition
between these two parts of the curve, especially if sharp, could potentially indicate a naturally
occurring or ecologically relevant reference point (Figure 3, left-hand panel); e.g., the biomass of the
indicator taxon has reached a point where it is sufficient to constitute a distinct VME, such as coral
reef or sponge garden where densities of the indicator taxa would be expected to be high. Weight
thresholds indicating unexpectedly large catches should ideally fall to the right of such points,
whereas biodiversity thresholds indicating increasing numbers of taxa in a single tow at weights
below the threshold trigger should occur to the left.

 8
SC9-DW10
Figure 3 | Cumulative distribution curve for the weight of Actiniaria bycatch from the 2008-20 New Zealand
bottom trawl fishery in the SPRFMO Convention Area. Left-hand panel distinguishes between the initial part
of the curve associated with linear increase is and the final part of the curve associated with asymptotic
decrease. The area distinguishing between these two parts of the curve potentially indicates a naturally
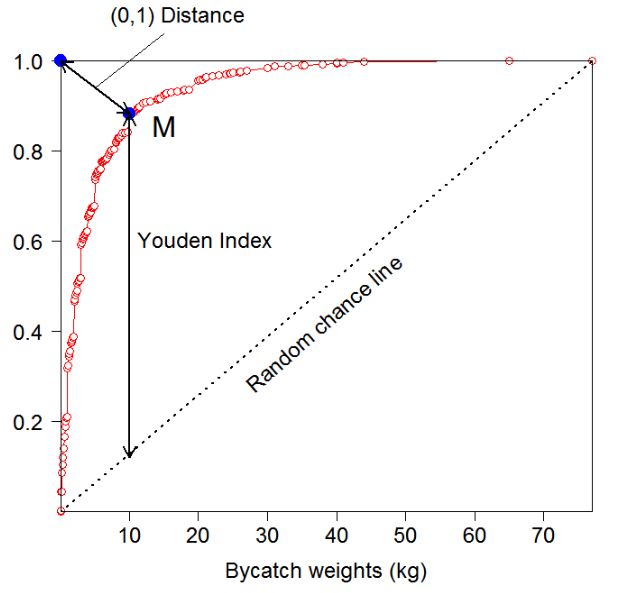
occurring or ecologically relevant reference point. Right-hand panel show two approaches used to
distinguish between the two parts of the curve: (1) the point on the curve that is closest to the top-left
corner ((0,1) Distance); and (2) the point on the curve that maximizes the distance between the curve and a
random chance line drawn between the extreme points on the curve (Youden Index).
Two different methods were used to calculate ecologically relevant reference points for taxa (Figure
3 right-hand panel): (1) the point on the cumulative distribution curve that is closest to the top-left
corner (0,1), calculated as q1 = min{�(1 − )2 + (1 − )2 } for each point belonging to the
cumulative distribution M(1-y,x) (Tilbury et al. 2000); and (2) the point on the cumulative
distribution curve that maximizes the distance between the curve and a line drawn between the
extreme points on the curve (Youden Index), calculated as q2 = max{y + x -1} for each point belonging
to the cumulative distribution M(1-y,x) (Ruopp et al. 2008). Points on a curve closest to (0,1) or
which maximize the Youden Index are commonly used in medical research to identify thresholds and
facilitate treatment decisions (e.g., Tilbury et al. 2000, Youden 1950) and can provide identical
estimates for smooth curves without large steps.
Recognizing that there may be regional differences in the structure of VMEs and the associated
density or biomass of VME indicator taxa or that bottom fishing practices may differ regionally, the
validity (from the perspective of our current understanding of VMEs) and feasibility (from the
perspective of data availability) of calculating area-specific thresholds was explored. While there is
good evidence that stony corals on seamounts can differ in form among regions (compare Rowden
et al. 2017 with Williams et al. 2020) there is no direct evidence that these regional differences
would be reflected in differences in the weight of the corals caught by a tow that has encountered a
stony coral VME, and that thresholds should therefore vary regionally. For other VME indicator taxa
there is little to no evidence that regional variation occurs in the VMEs that they form. An
assessment of the feasibility of calculating area-specific thresholds at the scale of individual FMAs
identified there were insufficient bycatch records to calculate FMA-specific thresholds (of the 177
9SC9-DW10 FMA x VME combinations 80 had less than 20 bycatch records per VME indicator taxon and 36 had no bycatch records). At the regional scale (Tasman Sea vs. Louisville Seamount Chain), only 5 of the 13 VME indicator taxa had more than 30 bycatch records within each region, and there was a disproportionately greater number of bycatch records from the Tasman Sea than the Louisville Seamount Chain, which introduces a risk that the difference in the amount of data available between the regions could have a greater influence on thresholds than regional differences in the density or biomass of the VME indicator taxa. Therefore, overall it was considered not defensible at this time to calculate area-specific encounter thresholds, and instead taxon-specific candidate thresholds for the entire Evaluated Area combined were calculated. An alternative approach to calculating candidate encounter thresholds for VME indicator taxa that is more commensurate with encounter protocols being the primary means for preventing significant adverse impacts on VMEs, rather than acting as a “backstop” to spatial management measures was also explored. For this approach, taxon-specific inverse cumulative catch curves were plotted and candidate encounter thresholds required to avoid catching 70%, 80%, 90% and 95% of historic bycatch were calculated, which prioritizes the avoidance of the largest bycatch events. Results from this alternative approach are presented separately in Appendix 4. 4. Results Proposed candidate encounter thresholds for VME indicator taxa and reference points are presented in Table 3. For some taxa (Alcyonacea, Hydrozoa and Bryozoa), reference points could not be accurately determined due to a lack of data. Both reference points and candidate encounter thresholds varied by taxa. For example, based on the 95th percentile, thresholds ranged between 5 kg for Antipatharia and 250 kg for Scleractinia (Table 4). 10
Table 3 | Percentiles calculated from interpolation. The number of bottom trawl tows recorded as bycatch (n), range in bycatch weight (kg), reference points ((0,1)
 distance and Youden distance) and percentiles in bycatch weight per VME indicator taxon recorded in all New Zealand bottom trawls within the Evaluated Area of the
 SPRFMO Convention Area between 2008 and 2020. Cell shading indicates percentiles above (blue) and below (green) both reference points. Grey cells indicate reference
 points could not be calculated due to insufficient sample sizes. Note, candidate encounter thresholds are presented for Porifera as a Phylum, and also disaggregated into
 the Classes Demospongiae and Hexactinellidae.

 Reference Points Percentiles (candidate encounter thresholds in kg)

VME indicator taxon n range (kg) (0,1) Youden 0.7 0.8 0.85 0.9 0.95 0.96 0.97 0.98 0.99

Porifera 907 0.02 - 1091.2 26.00 26.00 2.00 3.00 5.00 7.04 12.58 15.00 20.00 22.99 49.70

 Demospongiae 164 0.10 - 155 13.90 13.90 2.20 5.00 6.00 10.00 11.99 13.34 13.72 18.41 48.38

 Hexactinellidae 430 0.02 - 200 10.00 10.00 1.10 2.00 3.00 4.20 7.15 10.00 14.13 20.00 41.38

Scleractinia 1395 0.04 - 5000 60.00 60.00 2.38 5.00 5.20 10.00 20.00 30.00 40.00 67.94 221.99

Antipatharia 739 0.001 - 10.4 1.10 1.10 0.60 1.00 1.00 1.82 2.63 3.00 3.89 4.65 5.50

Alcyonacea 7 0.05 - 0.5 - - 0.22 0.28 0.32 0.38 0.44 0.45 0.46 0.48 0.49

Gorgonacea 681 0.01 - 200 5.70 5.70 1.00 1.00 1.30 2.00 5.20 7.44 15.07 24.10 34.50

Pennatulacea 99 0.1 - 3.6 1.00 1.00 0.50 1.00 1.00 1.00 1.00 1.00 1.00 1.00 1.05

Actiniaria 977 0.02 - 77 10.00 10.00 5.00 7.00 9.52 11.20 20.00 20.19 23.72 30.00 35.07

Zoantharia 544 0.1 - 114 5.00 5.00 1.00 1.00 1.00 2.00 3.00 4.42 5.00 6.56 11.99

Hydrozoa 12 0.02 - 1.3 - - 0.47 0.90 1.00 1.00 1.14 1.17 1.20 1.23 1.27

Stylasteridae 33 0.02 - 8 1.00 1.00 0.84 1.00 1.00 1.00 1.82 1.92 2.24 4.16 6.08

Bryozoa 3 0.1 - 4 - - 1.78 2.52 2.89 3.26 3.63 3.70 3.78 3.85 3.93

Brisingida 29 0.02 - 5 1.00 1.00 0.80 1.00 1.00 1.20 2.60 2.88 3.32 3.88 4.44

Crinoidea 59 0.04 - 2 1.00 1.00 1.00 1.00 1.00 1.00 1.00 1.00 1.00 1.00 1.42
5. Discussion
 Analysis of data for benthic invertebrate bycatch in deep-sea trawl fisheries suffers from poorly
 known catchability in bottom trawls, limited historical identification of bycatch taxa, and limited
 spatial extent of samples. With these constraints in mind, candidate encounter threshold weights
 were developed for the Evaluated Area of the SPRFMO Convention Area based on taxon-specific
 cumulative distributions of bycatch weights. These distributions show that most historic bycatch
 encounter events were of small amounts, with fewer large catches. The candidate encounter
 thresholds for VME indicator taxa calculated in this paper are the same as or similar to those
 calculated in SC6-DW09 and SC7-DW13, indicating that recent bycatch events have not changed the
 shape of the cumulative distribution curves.

 It is difficult to fully assess the ecological relevance of candidate encounter thresholds determined
 here without incorporating estimates of the trawl catchability of the VME indicator taxa to
 understand how catches relate to the presence of habitats that constitute VMEs. Although studies
 linking the density or biomass of VME indicator taxa on the seafloor to bycatch (i.e., catchability) are
 limited, those that have been attempted indicate that bycatch of individual trawl events may be a
 poor indicator of the density of VME indicator taxa on the seabed. For example, studies in shelf
 waters elsewhere (Freese et al. 1999, Wassenberg et al. 2002) and those from deeper waters in the
 SW Pacific presented at SC7 and in the BFIA 2020 (SC7-DW14, SC7-DW21_rev1, SC8-DW07_rev1),
 that opportunistically used data from seabed imagery and trawl bycatch estimated catchability of
 VME indicator taxa to often be less than 1%, but could be up to 15%. Consequently, encounter
 weight thresholds likely correspond to high densities and high biomasses of VME indicator taxa on
 the seabed, and the potential for substantial amounts of VME indicator taxa, and possible VMEs, to
 be contacted and impacted by trawl gear. Although the recent catchability analyses represent the
 best available estimates of catchability for VME indicator taxa within the SPRFMO Convention Area,
 the estimates should be interpreted with caution for a number of reasons, including differences
 between the types of fishing gear incorporated in these analyses and bottom trawling gear used
 within the SPRFMO Commission Area, spatial mismatches between data from benthic surveys and
 bycatch from benthic trawls, and high uncertainty in the estimates of seafloor biomass.
 Consequently, inferences from those analyses are limited as gear-specific, taxon-specific and ideally
 location-specific estimates of catchability are required if catchability is to be incorporated into the
 development of encounter thresholds.

 In its report SC7 “noted that estimates of catchability may, in the future, be useful in converting
 reported bycatch of VME indicator taxa into estimates of the extent of the impact of individual events
 on VME indicator taxa on the seafloor which could help inform the review of VME indicator
 thresholds in SPRFMO CMM 03-2019”. However, as already noted, to implement this approach we
 require more robust area- and taxon-specific estimates of catchability. To achieve estimates of
 catchability with less uncertainty we need to compare VME indicator taxa bycatch weights from
 bottom trawls to those determined from seafloor imagery from exactly the same area swept by the
 trawls, and at the same time. To achieve this goal several key pieces of work should be undertaken:

 • Deploying headline and net cameras on commercial trawls to estimate taxon-specific
 abundance of VME indicator taxa on the seafloor;
SC9-DW10

 • Developing metrics to convert taxon-specific estimates of abundance into biomass
 estimates;
 • Determining catchability estimates directly by comparing tow-specific biomass of VME
 indicator taxa landed on deck with tow-specific estimates of seabed biomass from headline
 and net cameras.

6. Recommendations
 It is recommended that the Scientific Committee:
 • Notes that the candidate encounter thresholds for VME indicator taxa have been updated
 using the most up-to-date New Zealand bycatch data.
 • Recommends to the Commission that the updated candidate encounter thresholds for VME
 indicator taxa are used to inform any future refinement of the VME indicator taxa thresholds
 included in Annex 6A and 6B of SPRFMO CMM03-2021.
 • Recommends to the Commission that it adds to the VME Encounters and Benthic Bycatch task
 in the Scientific Committee Multi-Annual Work Plan a 2023+ subtask to implement a data
 collection programme within the SPRFMO Convention Area to allow the determination of
 taxon-specific estimates of catchability for VME indicator taxa.
 • Recommends that in the interim, the best available catchability estimates are used to improve
 the Commissions understanding of the implications of the current encounter thresholds with
 regard to preventing significant adverse impacts on VMEs.

7. References
 Freese, L., Auster, P.J., Heifetz, J. and Wing, B.L., (1999). Effects of trawling on seafloor habitat and
 associated invertebrate taxa in the Gulf of Alaska. Marine Ecology Progress Series, 182, pp.119-126.
 doi:10.3354/meps182119

 R Core Team (2019). R: A language and environment for statistical computing. R Foundation for
 Statistical Computing, Vienna, Austria. URL https://www.R-project.org/

 Rowden, A.A., Anderson, O.F., Georgian, S.E., Bowden, D.A., Clark, M.R., Pallentin, A. and Miller, A.,
 (2017). High-resolution habitat suitability models for the conservation and management of
 vulnerable marine ecosystems on the Louisville Seamount Chain, South Pacific Ocean. Frontiers in
 Marine Science, 4, p.335. doi:10.3389/fmars.2017.00335

 Rowden, A.A., Pearman, T.R., Bowden, D.A., Anderson, O.F. and Clark, M.R., (2020). Determining
 Coral Density Thresholds for Identifying Structurally Complex Vulnerable Marine Ecosystems in the
 Deep Sea. Frontiers in Marine Science, 7, p.95. doi:10.3389/fmars.2020.00095

 Ruopp, M.D., Perkins, N.J., Whitcomb, B.W. and Schisterman, E.F. (2008). Youden Index and optimal
 cut‐point estimated from observations affected by a lower limit of detection. Biometrical J. 50, 419-
 430. doi: 10.1002/bimj.200710415

 Tilbury, J.B., Van Eetvelt, W.J., Garibaldi, J.M., Curnsw, J.S.H., Ifeachor, E.C. (2000). Receiver
 operating characteristic analysis for intelligent medical systems-a new approach for finding
 confidence intervals. IEEE T. Bio-Med. Eng. 47, 952-963. doi: 10.1109/10.846690

 13
SC9-DW10

Wassenberg, T.J., Dews, G. and Cook, S.D., (2002). The impact of fish trawls on megabenthos
(sponges) on the north-west shelf of Australia. Fisheries Research, 58(2), pp.141-151.
doi:10.1016/S0165-7836(01)00382-4

Williams, A., Althaus, F., Green, M., Maguire, K., Untiedt, C., Mortimer, N., Jackett, C.J., Clark, M.,
Bax, N., Pitcher, R. and Schlacher, T., (2020). True size matters for conservation: a robust method to
determine the size of deep-sea coral reefs shows they are typically small on seamounts in the
southwest Pacific Ocean. Frontiers in Marine Science, 7, p.187. doi:10.3389/fmars.2020.00187

Youden, W.J. (1950). Index for rating diagnostic tests. Cancer. 3, 32-35. doi: 10.1002/1097-
0142(1950)3:13.0.CO;2-3

 14
SC9-DW10

Appendix 1 - Assignment of benthic taxonomic codes used by New Zealand scientific
observers to VME indicator taxa

 Table A1.1 | Assignment of benthic bycatch taxa to higher order VME indicator taxa groups, where NZ Code
 is the benthic taxonomic code used by scientific observers to report benthic bycatch in the SPRFMO
 Convention Area.
 VME indicator taxon NZ Code Taxa Common Name
 Porifera ONG Porifera Sponges
 Porifera (Demospongiae) ANZ Ecionemia novaezelandiae Knobbly sandpaper sponge
 Porifera (Demospongiae) APU Aciculites pulchra Maroon pimpled ear sponge
 Porifera (Demospongiae) CFU Corallistes fulvodesmus Smooth white cup sponge
 Porifera (Demospongiae) CRM Callyspongia sp. Airy finger sponge
 Porifera (Demospongiae) DSO Demospongiae Demosponges
 Porifera (Demospongiae) GRE Geodia regina Curling stone sponge
 Porifera (Demospongiae) GVE Geodia vestigifera Ostrich egg sponge
 Porifera (Demospongiae) LBI Lissodendoryx bifacialis -
 Porifera (Demospongiae) PAZ Pachymatisma sp. Rocky dumpling sponge
 Porifera (Demospongiae) PHB Phorbas sp. Grey fibrous massive sponge
 Porifera (Demospongiae) PHW Psammocinia cf hawere -
 Porifera (Demospongiae) PLN Poecillastra laminaris Chipped fibreglass matt sponge
 Porifera (Demospongiae) RHA Rhabdastrella sp. Pink ice egg sponge
 Porifera (Demospongiae) SLT Stelletta sp. Orange fat finger sponge
 Porifera (Demospongiae) THN Thenea novaezelandiae Yoyo sponge
 Porifera (Demospongiae) TLD Tetilla leptoderma Furry oval sponge
 Porifera (Demospongiae) TTL Tetilla australe Bristle ball sponge
 Porifera (Hexactinellida) ERE Euplectella regalis Basket-weave horn sponge
 Porifera (Hexactinellida) FAR Farrea sp. Lacey honeycomb sponge
 Porifera (Hexactinellida) GLS Hexactinellida Glass sponges
 Porifera (Hexactinellida) HYA Hyalascus sp. Floppy tubular sponge
 Scleractinia CBR Dendrophylliidae, Oculinidae, Stony branching corals
 Caryophylliidae
 Scleractinia CUP Flabellidae, Fungiacyathidae, Stony cup corals
 Caryophyllidae
 Scleractinia DDI Desmophyllum dianthus -
 Scleractinia ERO Enallopsammia rostrata Deepwater branching coral
 Scleractinia GDU Goniocorella dumosa Bushy hard coral
 Scleractinia MOC Madrepora oculata
 Scleractinia OVI Oculina virgosa -
 Scleractinia SIA Scleractinia Stony corals
 Scleractinia SVA Solenosmilia variabilis -
 Antipatharia ATP Antipathes spp. -
 Antipatharia BTP Bathypathes spp. -
 Antipatharia COB Antipatharia Black coral
 Antipatharia DDP Dendropathes spp. -
 Antipatharia DEN Dendrobathypathes spp. -
 Antipatharia LEI Leiopathes spp. -
 Antipatharia LIL Lillipathes spp. -
 Antipatharia LSE Leiopathes secunda -
 Antipatharia PTP Parantipathes spp. -
 Antipatharia SLP Stylopathes spp. -
 Antipatharia STI Stichopathes spp. -
 Antipatharia TDP Triadopathes spp. -
 Antipatharia TPT Trissopathes spp. -

 15
SC9-DW10

Alcyonacea ARO Anthomastus (Bathyalcyon) -
 robustus
Alcyonacea SOC Alcyonacea Soft coral
Gorgonacea ACN Acanella sp. Bushy bamboo coral
Gorgonacea BOO Keratoisis sp. Bamboo coral
Gorgonacea CHR Chrysogorgia sp. Golden coral
Gorgonacea CLG Callogorgia spp. -
Gorgonacea CLL Corallium sp. Precious coral
Gorgonacea CTP Calyptrophora spp. -
Gorgonacea GOC Gongonacea Gorgonian coral
Gorgonacea IRI Iridogorgia sp. Iridescent coral
Gorgonacea ISI Isididae Bamboo corals
Gorgonacea LLE Lepidsis sp. Bamboo coral
Gorgonacea MTL Metallogorgia sp. Metallic coral
Gorgonacea NAR Narella sp. Rasta coral
Gorgonacea PAB Paragorgia arborea Bubblegum coral
Gorgonacea PLE Plexauridae Sea fans
Gorgonacea PMN Primnoa spp. -
Gorgonacea PPI Primnoidae -
Gorgonacea PRI Primnoidae -
Gorgonacea THO Thouarella sp. Bottlebrush coral
Pennatulacea AGF Anthoptilum grandiflorum Flower sea pen
Pennatulacea ALF Acanthoptilum longifolium Long-leaf sea pen
Pennatulacea DGR Distichoptilum gracile Two-lined sea pen
Pennatulacea FQU Funiculina quadrangularis Rope-like sea pen
Pennatulacea GYS Gyrophyllum sibogae Siboga sea pen
Pennatulacea PNN Pennatula sp. Feathery sea pens
Pennatulacea PTU Pennatulacea Sea pens
Pennatulacea SPN Pennatulacea Sea pen
Actiniaria ACS Actinostolidae Smooth deepsea anemones
Actiniaria ATR Actiniaria Sea anemones
Actiniaria BOC Bolocera sp. Deepsea anemone
Actiniaria HMT Hormathiidae Deepsea anemone
Actiniaria LIP Liponema sp. Deepsea anemone
Zoantharia EPZ Epizoanthus spp. -
Zoantharia ZAH Zoantharia Zoanthids
Hydrozoa HDF Leptomeduseae, Feathery hydroids
 Anthoathecatae (excluding
 family Stylasteridae)
Stylasteridae COR Stylasteridae Hydrocorals
Stylasteridae CRE Calyptopora reticulata White hydrocoral
Stylasteridae CRY Cryptelia spp. -
Stylasteridae ERR Errina sp. Red coral
Stylasteridae LPT Lipidotheca sp. Spiny lace coral
Bryozoa COZ Bryozoa Bryozoan
Brisingida BRG Brisingida -
Crinoidea CMT Comatulida Feather star
Crinoidea CRI Crinoidea Sea lilies
Crinoidea CRN Isocrinida, Millericrinida, Sea lily, stalked crinoid
 Cyrtocrinida
Crinoidea GIN Glyptometra inaequalis -

 16
SC9-DW10

Appendix 2 - Zero Weight Adjustments
Table A2.1 | Number of trawl events, bycatch range (kg), trawl events with zero weights recorded and the
zero weight adjustment used in the analysis.

 No. trawl N (%) trawl events with
VME indicator taxon Bycatch range (kg) Adjusted weight (kg)
 events zero weight records
PFR - Porifera 907 0 - 1091.2 2 (0.22%) 0.02
CSS - Scleractinia 1395 0 - 5000 3 (0.21%) 0.04
AQZ - Antipatharia 739 0 - 10.4 17 (2.3%) 0.001
AJZ - Alcyonacea 7 0.05 - 0.5 0 (-) -
GGW - Gorgonacea 681 0 - 200 16 (2.3%) 0.001
NTW - Pentulacea 99 0 - 3.6 1 (1.01%) 0.1
ATX - Actiniaria 877 0.02 - 77 0 (-) -
ZOT - Zoantharia 544 0.1 - 114 0 (-) -
HQZ - Hydrozoa 12 0 - 1.3 1 (8.33%) 0.02
AXT - Stylasteridae 33 0-8 1 (3.03%) 0.02
BZN - Bryozoa 3 0.1 - 4 0 (-) -
BHZ - Brisingida 29 0.02 - 5 0 (-) -
CWD - Crinoidea 59 0-2 1 (1.69%) 0.04

 17
Appendix 3 - Comparisons of thresholds calculated with and without interpolation
Table A3.1 | Percentiles calculated from ordered values. The number of bottom trawl tows recorded as bycatch (n), range in bycatch weight (kg), reference points ((0,1)
distance and Youden distance) and percentiles in bycatch weight per VME indicator taxon recorded in all New Zealand bottom trawls within the Evaluated Area of the
SPRFMO Convention Area between 2008 and 2020. Cell shading indicates percentiles above (blue) and below (green) both reference points. Grey cells indicate reference
points could not be calculated due to insufficient sample sizes. Note, candidate encounter thresholds are presented for Porifera as a Phylum, and also disaggregated into
the Classes Demospongiae and Hexactinellidae.
 Reference Points Percentiles (candidate encounter thresholds in kg)

VME indicator taxon n range (kg) (0,1) Youden 0.7 0.8 0.85 0.9 0.95 0.96 0.97 0.98 0.99

Porifera 907 0.02 - 1091.2 26.00 26.00 2.00 3.00 5.00 7.10 12.70 15.00 20.00 23.10 50.00

 Demospongiae 164 0.10 - 155 13.90 13.90 2.20 5.00 6.00 10.00 12.00 13.50 13.90 20.00 95.00

 Hexactinellidae 430 0.02 - 200 10.00 10.00 1.10 2.00 3.00 4.20 7.28 10.00 15.00 20.00 45.00

Scleractinia 1395 0.04 - 5000 60.00 60.00 2.40 5.00 5.20 10.00 20.00 30.00 40.00 80.00 250.00

Antipatharia 739 0.001 - 10.4 1.10 1.10 0.60 1.00 1.00 1.90 2.90 3.00 3.90 4.80 5.50

Alcyonacea 7 0.05 - 0.5 - - 0.20 0.30 0.30 0.50 0.50 0.50 0.50 0.50 0.50

Gorgonacea 681 0.01 - 200 5.70 5.70 1.00 1.00 1.30 2.00 5.20 7.50 15.11 24.10 40.50

Pennatulacea 99 0.1 - 3.6 1.00 1.00 0.50 1.00 1.00 1.00 1.00 1.00 1.00 1.00 3.60

Actiniaria 977 0.02 - 77 10.00 10.00 5.00 7.00 9.60 11.20 20.00 20.20 24.00 30.00 35.30

Zoantharia 544 0.1 - 114 5.00 5.00 1.00 1.00 1.00 2.00 3.00 5.00 5.00 10.00 12.20

Hydrozoa 12 0.02 - 1.3 - - 0.50 1.00 1.00 1.00 1.30 1.30 1.30 1.30 1.30

Stylasteridae 33 0.02 - 8 1.00 1.00 0.90 1.00 1.00 1.00 2.00 2.00 8.00 8.00 8.00

Bryozoa 3 0.1 - 4 - - 4.00 4.00 4.00 4.00 4.00 4.00 4.00 4.00 4.00

Brisingida 29 0.02 - 5 1.00 1.00 1.00 1.00 1.00 2.00 3.00 3.00 5.00 5.00 5.00

Crinoidea 59 0.04 - 2 1.00 1.00 1.00 1.00 1.00 1.00 1.00 1.00 1.00 1.00 2.00
SC9-DW10

Table A3.2 | Proportional differences in percentiles calculated from ordered values (presented in Table A3.1) and using linear interpolation (presented in Table 3),
expressed as 1-interpolated/ordered. Cell shading indicates proportional differences < 0.01 (green), 0.01-0.05 (light green), 0.05-0.10 (yellow), 0.10-0.20 (orange and >
0.20 (red).
 Percentiles

VME indicator taxon 0.7 0.8 0.85 0.9 0.95 0.96 0.97 0.98 0.99

Porifera 0.00 0.00 0.00 0.01 0.01 0.00 0.00 0.00 0.01
 Demospongiae 0.00 0.00 0.00 0.00 0.00 0.01 0.01 0.08 0.49
 Hexactinellidae 0.00 0.00 0.00 0.00 0.02 0.00 0.06 0.00 0.08
Scleractinia 0.01 0.00 0.00 0.00 0.00 0.00 0.00 0.15 0.11
Antipatharia 0.00 0.00 0.00 0.04 0.09 0.00 0.00 0.03 0.00
Alcyonacea -0.10 0.07 -0.07 0.24 0.12 0.10 0.08 0.04 0.02
Gorgonacea 0.00 0.00 0.00 0.00 0.00 0.01 0.00 0.00 0.15
Pennatulacea 0.00 0.00 0.00 0.00 0.00 0.00 0.00 0.00 0.71
Actiniaria 0.00 0.00 0.01 0.00 0.00 0.00 0.01 0.00 0.01
Zoantharia 0.00 0.00 0.00 0.00 0.00 0.12 0.00 0.34 0.02
Hydrozoa 0.06 0.10 0.00 0.00 0.12 0.10 0.08 0.05 0.02
Stylasteridae 0.07 0.00 0.00 0.00 0.09 0.04 0.72 0.48 0.24
Bryozoa 0.56 0.37 0.28 0.19 0.09 0.08 0.06 0.04 0.02
Brisingida 0.20 0.00 0.00 0.40 0.13 0.04 0.34 0.22 0.11
Crinoidea 0.00 0.00 0.00 0.00 0.00 0.00 0.00 0.00 0.29

 19
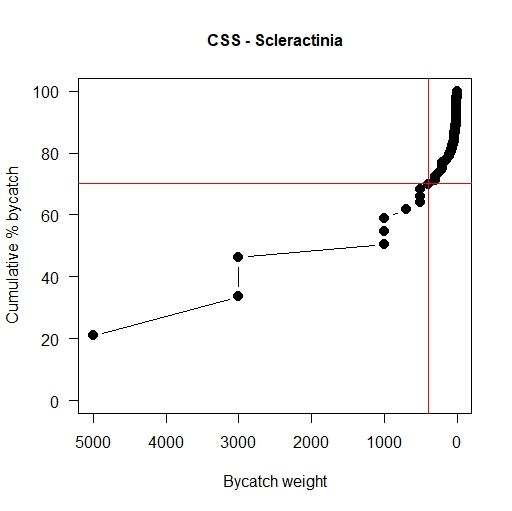
Appendix 4 Encounter thresholds calculated using inverse cumulative distribution
curves

An alternative approach to calculating candidate encounter thresholds for VME indicator taxa was
based on plotted taxon-specific inverse cumulative catch curves (Figure A4.1) and calculating
candidate thresholds required to avoid 70%, 80%, 90% and 95% of historic bycatch, where the use of
inverse cumulative distribution curves prioritizes the avoidance of the largest bycatch events first.
However, large bycatch weights are often visually estimated, often to the nearest tonne (see first 6
points in Figure A4.1).

As a consequence of inverse cumulative distribution curves prioritizing the avoidance of the largest
bycatch events first, the cumulative percent bycatch (y-axis) is sensitive to errors in the estimation of
the weight of large bycatch events, which can be less precise than the estimation of weights in small
bycatch events.

The use of inverse cumulative distribution curves is more commensurate with encounter protocols
being the primary means for preventing significant adverse impacts on VMEs, rather than acting as a
“backstop” to spatial management measures.

 Figure 4.1 | Inverse cumulative distribution curve
 for the weight of Scleractinia bycatch from the
 2008-20 New Zealand bottom trawl fishery in the
 SPRFMO Convention Area. The intersection of the
 horizontal red line with the inverse cumulative
 distribution curve represents the encounter
 threshold required to avoid 70% of historic bycatch
 of Scleractinia, which corresponds to 400 kg.
SC9-DW10

Table 4.1 | Candidate encounter thresholds for VME indicator taxa calculated from inverse cumulative
distribution curves. The number of bottom trawl tows recorded as bycatch (n), range in bycatch weight (kg),
and weight thresholds required to avoid 70, 80, 90 and 95% percent of historical bottom trawl bycatch. Note,
encounter thresholds are presented for Porifera as a Phylum, and also disaggregated into the Classes
Demospongiae and Hexactinellidae.

 Weight (kg)

VME indicator taxon n range (kg) 70% 80% 90% 95%

Porifera 907 0.02 - 1091.2 10.00 5.00 2.00 1.00

 Demospongiae 164 0.10 - 155 7.30 5.00 2.00 1.00

 Hexactinellidae 430 0.02 - 200 4.70 2.83 1.00 1.00

Scleractinia 1395 0.04 - 5000 400.00 90.00 11.50 5.00

Antipatharia 739 0.001 - 10.4 1.00 0.60 0.30 0.20

Alcyonacea 7 0.05 - 0.5 0.20 0.20 0.10 0.10

Gorgonacea 681 0.01 - 200 11.40 2.30 1.00 0.50

Pennatulacea 99 0.1 - 3.6 0.50 0.30 0.20 0.10

Actiniaria 977 0.02 - 77 5.30 4.00 2.40 1.50

Zoantharia 544 0.1 - 114 1.00 1.00 0.60 0.40

Hydrozoa 12 0.02 - 1.3 0.50 0.40 0.20 0.20

Stylasteridae 33 0.02 - 8 1.00 0.80 0.50 0.30

Bryozoa 3 0.1 - 4 4.00 4.00 4.00 0.30

Brisingida 29 0.02 - 5 1.00 1.00 0.30 0.10

Crinoidea 59 0.04 - 2 1.00 1.00 0.30 0.10

 21
You can also read