Europe feels the heat - the power sector and extreme weather
←
→
Page content transcription
If your browser does not render page correctly, please read the page content below
Europe feels the heat
   the power sector and extreme weather

The worst offender
              the power sector
                                                       It’s been another scorching
The biggest source of man-made carbon dioxide
(CO2 ) pollution is electric power generation – in
                                                              summer in much of Europe.
particular coal-fi red production. Coal is the most
carbon-rich of the fossil fuels, and burning it
generates 70 per cent more CO 2 per unit of            Across the continent, heatwaves have brought death, droughts, forest fires
energy produced than natural gas. Globally the         and ruined crops.
power industry contributes 37 per cent of
man-made CO2 , and in Europe 39 per cent.              The precise causes of individual heatwaves are complex, but most climate scientists agree
    Increased power production meant that in           that global warming has probably made them more frequent and intense. The global
2003 CO2 emissions by the EU’s 25 member               average temperature increased by 0.6ºC during the 20th century. In Europe, the average
states increased by 1.5 per cent, after having         temperature rise was 0.95ºC.
fallen in 2002. Under the Kyoto protocol, the EU
pledged to reduce overall CO 2 emissions by 8          The summer of 2003 is believed to be the hottest in Europe for the past 500 years,
per cent over the period 2008 to 2012, compared        and, if global warming continues as predicted, this could become the norm.
to 1990 levels. Although the ‘old’ 15 member
states reduced their overall greenhouse gas            The main cause of global warming is the build-up of atmospheric greenhouse gases, and
emissions by 1.7 per cent between 1990 and             in particular carbon dioxide (CO2). The power sector is responsible for the biggest share of
2003, their CO2 emissions increased by 3.4 per         man-made CO2 emissions due to its heavy reliance on fossil fuels – especially coal.
cent over the same period.
    The next 20 years will offer a historic window     Europe now has a historic opportunity to tackle this problem, but must act immediately
of opportunity for Europe to dramatically reduce       to replace dirty, antiquated power stations with cleaner alternatives. This report tells you
the rate of power sector emissions. Over that          why we must take action and explains what you can do to help.
period, most of Europe’s worst polluting coal-
fi red power stations will be decommissioned.
If they’re replaced with new coal plants, the con-
tinent will be locked into high levels of CO2 pollu-
tion for decades to come – and will be unable to
achieve even the modest Kyoto protocol target.
However, if current coal-fi red plants are re-
placed by clean alternatives, Europe will lead
the world towards a low-carbon economy and
the Earth could avoid the dangerous effects
of abrupt climate change.
WWF’s PowerSwitch! campaign urges power
companies to make the vital switch to less
polluting fuels, such as natural gas – or, ideally
– clean renewable technologies, such as wind,
biomass, water and solar power.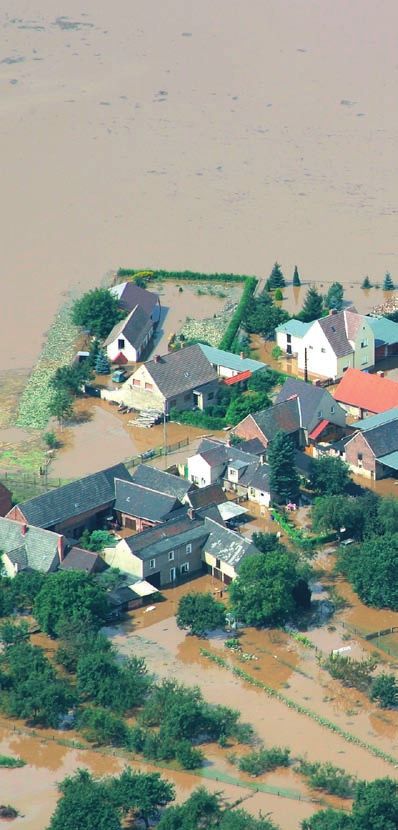
Eur
Germany

                                                         Heatwaves and extreme weather
Extreme summer weather has wreaked havoc in
Germany in recent years. 2003’s heatwave left the
                                                                             – the facts
river
Eur levels at an all-time low. One estimate from the
Cologne area suggested the death rate increased
by 16.5 per cent during August 2003. Agricultural        If you’re not convinced there’s a problem, consider the following facts
losses were around €1billion, with the wheat harvest
in some areas down by 80 per cent.                       ➜ Figures compiled for the UN World Meteorological Organisation show that, globally,
    By contrast, in August 2002, intense rainstorms      the ten warmest years since 1856 have now occurred since 1990. In descending order, they
created the worst floods in more than a century,          are: 1998, 2002 and 2003 (joint), 2004, 2001, 1997, 1995, 1990 and 1999 (joint), 1991
with the Eastern states of Saxony and Saxony-            and 2000 (joint).
Anhalt badly hit. The River Elbe in Dresden rose
from its normal summer level of about two metres         ➜ In Europe, the average number of climate-related disasters doubled during the 1990s,
to a record 9.4 metres. This summer has brought          as compared to the previous decade.
more weather extremes. In June, there was 30 per
cent more sunshine than average and very high tem-       ➜ Weather stations across Europe have recorded a rise in the occurrence of extremely hot
peratures recorded in the South of the country.          summer days in recent years – in some places, up to 36 per cent more over the past
    In early July, days of heavy rain caused floods in    three decades, and in a few areas even more than that. Most significantly, out of over
the South. As global warming continues, it is predic-    250 stations, none recorded a decrease in the number of extremely hot days.
ted that central, North and East Germany can expect
drier summers, but also an increased risk of heavy       ➜ Heatwaves kill – especially the old and vulnerable. The record-breaking summer of
rainstorms. Summer droughts are expected to hit          2003 claimed around 40,000 lives. Common causes of death include respiratory and
agriculture, especially in the state of Brandenburg.     cardiovascular disease, as well as heatstroke and dehydration.
    Summer weather in the South of Germany is
projected to be more like Southern Europe, with the      ➜ Like other extreme weather, heatwaves are now – at least partly – caused by humans.
average number of hot days (over 30°C) in Bavaria        A study by British scientists, published last year in the leading scientific journal Nature,
likely to double between 2021 and 2050.                  estimated that man-made greenhouse gas emissions have at least doubled the risk of
    Germany’s CO2 emissions fell by 18.2 per cent        record-breaking heatwaves (such as the one in 2003) occurring throughout Europe. The
between 1990 and 2003. The most important                power sector is the biggest polluter, responsible for 37 per cent of global man-made CO2.
reasons are the industrial downturn and the replace-
ment of old coal-fired power plants in former East
Germany by more energy efficient coal plants.
    As Europe’s leading industrial nation, with the
largest population, Germany still tops the continent’s
greenhouse gas emissions. The country aims to
generate 50 per cent of its energy needs from
renewable energy sources by 2050, but, so far, its
power industry remains heavily reliant on coal and
oil-fired stations.
Average temperature ºC 1970 - 74
Average temperature ºC 2000 - 04 * 14.8 °C
Eur temperature increase
Average
WF analy
16.3 °C Helsinki
➜
1.5 °C
Revealed – EU capitals
➜
significant warming trend
➜ no significant warming trend Stockholm
* 15.2 °C
16.0 °C feel the heat
➜
0.8 °C
Eur * 16.3 °C
16.5 °C
* 14.0 °C
➜ 0.2 °C WWF analysis of climate data for the ’old-EU’ 15 capital
14.7 °C cities, and the Polish capital, Warsaw, reveals another start-
Copenhagen
➜ 0.7 °C * 15.6 °C ling temperature statistic. During the first five years
16.6 °C of this decade, average – or mean – temperatures in 13 of
Dublin ➜ 1.0 °C the 16 cities were at least 1ºC higher than during the first
five years of the 1970s.
Berlin Warsaw
Amsterdam
London Europe’s average temperature rose by 0.95ºC during the
20th century and the global average by 0.6ºC. The much
* 16.5 °C ** 21.7 °C ** 19.6 °C greater temperature increases in our analysis, calculated
17.7 °C 22.9 °C 20.9 °C
** 20.5 °C
➜
➜
➜
Brussels 1.3 °C by different but broadly comparable methods, took place
22.5 °C 1.2 °C 1.2 °C
➜
over just three decades.
2.0 °C
Luxembourg
Paris City We looked first at average summer maximum temperatures.
Vienna The greatest increase between 1970-’74 and 2000-’04
* 18.2 °C * 15.4 °C * 18.5 °C was in London at 2ºC, followed by Athens and Lisbon, tied
19.2 °C 17.4 °C at 1.9ºC, Warsaw (1.3ºC), and Berlin (1.2ºC). Other cities
➜
19.7 °C
➜
➜
1.0 °C 2.0 °C did not record a rise using summer maximum temperature
1.2 °C
and in some cases such data was difficult to obtain.
However, when we analysed summer mean temperatures
for those cities, they showed a similar pattern of tempera-
* 21.5 °C
ture increase. The greatest rise was in Madrid, at 2.2ºC,
23.7 °C
** 25.9 °C
➜
followed by Luxembourg, at 2.0ºC, Stockholm (1.5ºC),
27.8 °C 2.2 °C Rome Brussels (1.2ºC), Rome (1.2ºC), Vienna (1.2ºC), Paris
➜
1.9 °C (1.0ºC), Amsterdam (1.0 C), Helsinki (0.8ºC), Dublin
22.6 °C
** 29.9 °C (0.7ºC), and Copenhagen (0.2ºC).
Lisbon Madrid * ➜ 31.8 °C
23.8 °C
➜
1.9 °C As well as comparing the two five year periods, WWF also
1.2 °C calculated overall temperature trends for the 16 cities
Athens between 1970 and 2004. Plotted on a graph, the trend
lines rose significantly in 14 of the cities analyzed, which
The average temperature measures used were as follows: is further compelling evidence of their rapid warming.
* Daily summer mean temperature. This is the average – or mean – ** Daily summer maximum temperature. This is the mean of the maximum Only Dublin and Copenhagen did not show a significant
of the daily temperature for the period June 1st to September 30th. daily temperatures for the period June 1st to September 30th.
trend.
Mean daily temperature is the average temperature over the course
of a 24-hour day. The temperature data used for Madrid does not
cover the year 1970.
UK

                                                            Where does global
Since the start of the 1990s, the UK has experienced
nearly three times as many extremely warm months
                                                                           warming fit in?
as in previous decades. Data indicates that the
1990s were the warmest decade of the last century
– with 1998 the hottest year. During just nine days in      Global warming is a reality.
August 2003, more than 2,000 people in the UK died          During the 20th century the global average temperature increased by 0.6ºC, and the European
as a result of the heatwave.                                average by around 0.95ºC. Around two thirds of the global rise has occurred since 1975.
    The UK has an international reputation for wet          Most climate scientists agree that the warming is due, in a large part, to human activity.
weather – but it seems to be becoming increasingly          We are exacerbating the greenhouse effect, a natural phenomenon, which traps the sun’s
chaotic and unpredictable. Last August, flash floods          radiation, creating a ‘blanket’ that warms the Earth and makes it habitable.
devastated the village of Boscastle in Cornwall and
in June 2005, similar conditions caused roads and           The impact on the world’s weather
bridges in North Yorkshire to be washed away. Yet,          0.6ºC may not sound like very much. But, just like in people, a small, relatively rapid
much of the South East of the country is currently          temperature rise can have serious consequences. Most climate scientists believe the
suffering a serious water shortage.                         increase is enough to upset a delicate natural balance, resulting in more extreme weather
    As global warming continues, heatwaves are              events, such as heatwaves, droughts, and rainstorms.
likely to become more common. By 2080, average
annual temperatures in the UK could rise by 2 to            It’s not a straightforward process. Warmer temperatures increase the amount of water
3.5°C degrees, and by up to 5°C in some areas.              vapour in the atmosphere, which in turn brings more rain and makes some regions wetter.
The UK Department of Health predicts a 250 per              However, wind and ocean circulation patterns are likely to make other regions significantly
cent increase in heat-related summer deaths by              drier. Yet, these drier places will probably experience more intense rainstorms.
2050.
    Sea levels in the South of the UK are expected to       ➜ Unfortunately, the worst is yet to come.
continue rising by as much as 50cm by 2050 and
86cm during the 2080s. Combined with the predic-
ted increase in heavy rainstorms, this will double
the number of people at high risk of flooding to
nearly 3.5 million.
    The UK is the second biggest CO2 polluter in the
EU after Germany. Between 1990 and 2003, its over-
all greenhouse gas emissions fell by 13.3 per cent
– largely as a result of a shift from coal to gas-fired
power production. However, CO2 emissions rose
by 2.2 per cent between 2002 and 2003, and more
than half of the country’s electricity is still generated
by fossil fuel-fired power stations. Provisional fig-
ures indicate that the UK’s CO2 emissions rose again
in 2004 by about 1.5 per cent.
Italy

The human cost of the 2003 heatwave was higher
in Italy than in any other EU country. According to
revised government figures released in June, 20,000
people died. This is twice the original estimate and
even higher than in France, previously thought to be
Europe’s worst hit country. Almost 2,000 forest fires
were reported during that summer and drought-
related agricultural damage cost around €5 billion.
    This summer the country has experienced
another heatwave, as well as severe droughts.
Temperatures have nudged 40ºC in parts of the
country, with the Government warning that around
a million people are at risk. In June a number of
large cities – including Rome, Milan and Turin – went
on health alert, with tens of thousands of (mostly
elderly) people being monitored.
    Italy has generally become drier, with the num-
ber of rainy days falling by about 14 per cent since
1996. But the drop in the quantity of rainy days was
accompanied by a rise in intensity, meaning more
heavy rainstorms.
    It is predicted that Italy will be one of the EU
countries worst affected by future global warming,          The people factor: the greenhouse gas build-up
with overall rainfall levels shrinking still further, and   The global temperature rise has been mirrored by a rise in man-made greenhouse gases.
many more prolonged and intense heatwaves.                  CO2 accounts for over 80 per cent of these gases. Around 24,400,000,000 tonnes are
    It seems that the Mediterranean Sea is also             churned out every year – around 12 times the level in 1900. The single greatest contributor
heating up rapidly: a recent study found that sea           is the power sector, which is responsible for 37 per cent of global man-made CO2 emissions
temperatures around Italy rose by almost 4ºC bet-           and 39 per cent of Europe’s.
ween 1985 and 2003. Sea levels are expected to rise
by between 20 and 30cm by 2100, which threatens             The concentration of CO2 in the atmosphere has increased by 36 per cent since the start
around 4,500 square kilometers of costal plains.            of the Industrial Revolution in the mid-1700s, and is higher than at any time in the past
    Italy is the EU’s third biggest greenhouse gas          420,000 years.
polluter and has one of the EU’s worst records on
controlling emissions. They rose by 11.6 per cent           Like global warming, most of this increase has occurred in the past few decades. Between
between 1990 and 2003, and by 2.7 per cent                  the mid-1700s and the late 1950s, average CO2 levels rose from 280 to 315 parts per million
between 2002 and 2003 alone. The country’s power            (ppm). By 2004, they had reached an all-time-high of 378 ppm.
sector is heavily reliant on oil, which, after coal,
is the worst CO2 polluter.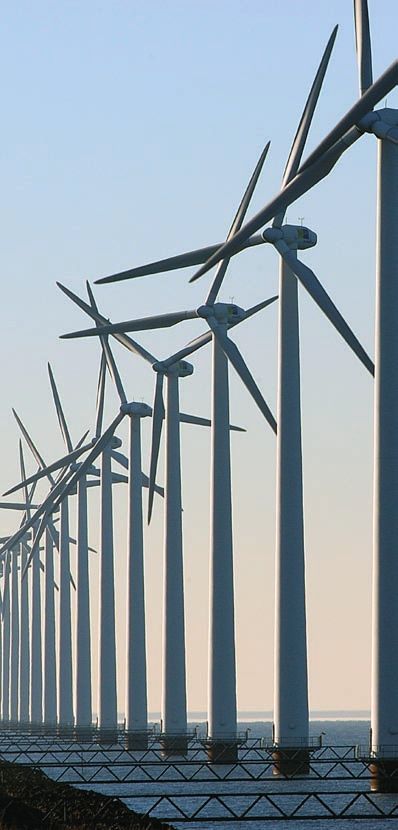
What needs to be done
It’s vital that we keep the global temperature rise below 2ºC, compared to pre-industrial
times.

To prevent this increase from happening, CO2 emissions, especially by the power industry,
must be cut rapidly – even more rapidly than the EU’s target under the UN agreement
known as the Kyoto Protocol. The Kyoto target for the EU is an 8 per cent reduction of
greenhouse gas emissions over the period 2008 to 2012, compared to 1990 levels.

➜ If we don’t act now, the future could be grim.

The Future
  more extremes, more suffering
The climate
Precise predictions of future climate are impossible, but there is now a scientific consensus
that global warming is likely to cause many more extreme weather events.

The world’s leading expert body, the UN’s Intergovernmental Panel on Climate Change
(IPPC), projects average global temperature to rise between 1.4 and 5.8°C by the end
of the century. A recent study suggests the rise could be anything up to 11°C.

A climate modelling study by the US National Center for Atmospheric Research (NCAR),
based on the 2003 Paris heatwave, suggests that such events could become more common-
place and severe. The study projected that the number of heatwaves in Paris could increase
by 31 per cent during this century, and that they would also last longer – up from the
current length of 8.3 -12.7 days, to 11.4 - 17 days.

Poland

Dry summers have left Poland with a serious water
problem, with current water resources estimated
to be only about a third of the European average.
However, like Germany, Poland suffered severe
flooding in the summers of 1997 and 2002.
    In July this year, Dr. Halina Lorenc, a clima-
tologist at the country’s Meteorology and Water
Economy Institute, predicted that the month-long
drought and high temperatures were likely to reduce
the grain harvest to two-thirds of its 2004 level.
    Future temperature rises will likely mean bad
news for farmers, by extending the length of the dry
summer period and exacerbating water shortages.
    According to Polish government scientists, rising   High greenhouse gas emission scenarios project that by the end of the century one in two
sea levels – predicted to be around 50cm over           summers are likely to be as warm as 2003’s record-breaker, and in Southern Europe
this century – are likely to threaten the country’s     this is projected to happen even earlier.
entire 790-km Baltic Sea coastline with erosion
and flooding.                                            The IPCC suggests that a doubling of CO2 levels compared to pre-industrial times could
    Poland’s greenhouse gas emissions fell by 32.1      cause a 2ºC increase in the global average temperature. At the current rate of increase,
per cent between 1988 and 2003, which was largely       this could happen by the middle of the century, bringing significant and abrupt climate
due to a reduction in coal-fired electricity pro-        change to Europe. In Southern Europe, this could mean an additional six weeks of
duction. Nevertheless, around 95 per cent of the        extremely hot days per year, coupled with severe droughts.
country’s power stations remain fossil-fuel powered
(mainly hard coal and lignite) and it has one of the    While many people in Northern Europe may enjoy the warmer summers, they will also
EU’s largest coal industries. Polish production         have to endure a rise in droughts and severe rainstorms – a combination likely to bring
exceeds the combined total of the 15 old EU member      about dangerous flash floods.
states.
                                                        Health impacts
                                                        Longer and more intense heatwaves pose a major health risk. According to a US study,
                                                        heat-related deaths caused by climate change are likely to increase several-fold by 2050.
                                                        Tick-borne diseases, which were once a local problem in some Northern and Central
                                                        European countries, could also spread. Tick-borne encephalitis (TBE), which has already
                                                        reached epidemic proportions in large parts of Europe, can result in meningitis and
                                                        other serious neurological problems.

                                                        More floods will also have serious consequences for public health. As well as death by
                                                        drowning, the populations they displace suffer from increased psychological and
                                                        behavioural disorders, and are more prone to suicide.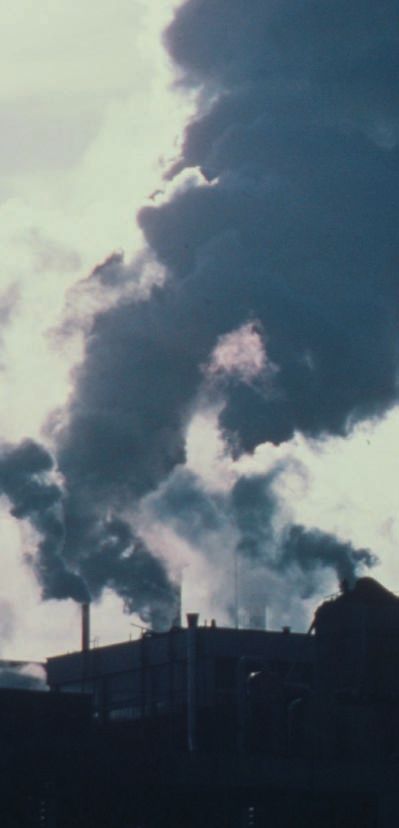
Economic impacts
If the average global temperature increases by 2ºC from its pre-industrial level, water
shortages and increased forest fires are likely to hit Southern Europe’s tourist industry.

Already this summer, Spain and Portugal have applied for EU food assistance. With
agricultural yields in the region predicted to fall by 40 per cent, this is a trend that could
be repeated frequently throughout countries in Southern Europe.

Warmer and longer summers generally mean an increased growing season in Central and
Northern Europe, but droughts and a rise in agricultural pests and weeds could prevent
farmers from reaping the benefits.

According to the European Environment Agency, some regions may also become crowded
by ‘climate change refugees.’ Most will be escaping from the heatwaves and droughts
of Southern Europe, but melting ice and permafrost could also drive people down from the
far North.

The leading insurance company Allianz estimates that climate change is increasing the
potential of property damage by two to four per cent a year. Major storms are especialy
costly. According to the Association of British Insurers, even small increases in the
number of storms could increase their worldwide costs by as much as two thirds – to £15
billion a year – by the end of the century. Business and domestic insurance premiums
are expected to rise steadily.

Spain

Currently suffering what is probably the worst
drought in the past 60 years, Spain’s rainfall this
year is over 50 per cent below average. Water
rationing has been implemented in large parts of
the North East and South East and many crop yields       Environmental impacts
are down by 50 per cent.                                 A 2004 study published in Nature predicted that climate change could wipe out up to a
    Climate modelling suggests that, if global green-    million terrestrial species around the world over the next 50 years.
house gas emissions continue at the current rate,
by 2020, one in two summers in Spain are likely to       It’s thought that many species will be unable to cope with the rapid changes in climate,
be as hot as 2003.                                       and are likely to reduce in number, or even disappear. Mediterranean species will be
    Spain is warming faster than other parts of the      especially hard hit by drought, forest fires and soil erosion.
world. If global average temperatures rise by 2ºC
above pre-industrial levels, Spanish summer inland       Rivers and glaciers will also be severely affected. By 2070, river discharges are likely
temperatures are likely to rise by an average of 4       to decrease by up to 50 per cent in Southern Europe due to the hotter, drier weather. In
to 5ºC. The centre of Spain will potentially exper-      Northern Europe they are expected to increase by the same amount, due to higher rainfall
ience an extra six weeks of days with temperatures       and melting glaciers.
over 35ºC. Spain’s coastal areas could experience
an average of two extra weeks above 35ºC.                Alpine glaciers shrunk by an average of 50 per cent between 1850 and 1980, and have
    In June, the Spanish government suggested that       reduced a further 20 to 30 per cent since then. By 2050, Swiss glaciers are likely to have
a third of the country could become desert-like as       shrunk to 75 per cent of their current size. It’s predicted that a 4ºC global temperature rise
climate change exacerbates the loss of topsoil           would eliminate nearly all the world’s mountain glaciers.
caused by overgrazing and irrigation.
    Spain’s recent record on greenhouse emissions
is the second worst in the EU after Cyprus. Between
                                                         Aletsch Glacier, Switzerland, 1979             Aletsch Glacier, Switzerland, 2002
1990 and 2003, they rose by 40.6 per cent, which
reflects the fact that over the same period fossil
fuel consumption in electricity and heat production
increased by 53 per cent. Between 1990 and 2002,
coal and oil-fired energy production rose by 11.3
and 44.7 per cent respectively.
    The hot weather has pushed Spain into a vicious
cycle of CO2 pollution, as many people have inves-
ted in energy-intensive air-conditioning units to cope
with the heat. Around 1.3 million units were bought
in 2004, of which most are energy inefficient.
Action!
the PowerSwitch! campaign
The only solution to the global warming problem is to drastically reduce greenhouse gas
emissions, especially CO2. The most effective way to do this is by radical changes to
electricity production, in particular the replacement of coal-burning power stations with
clean and renewable alternatives, such as solar, wind, water and biomass.
The two-pronged goal of the PowerSwitch! campaign is to ask governments to cut CO2
pollution produced by coal power stations and force a switch to clean, more efficient power.
European governments have a vital role to play by enforcing strict pollution limits under
the European Emissions Trading Scheme. From January 2005, the scheme – known as
the ETS – has placed CO2 limits on the chimney stacks of big companies. Companies that
exceed their limits have to pay the penalty by being forced to buy unused pollution
allowances from cleaner companies.
Tough pollution limits combined with a powerful financial incentive to invest in cleaner,
more efficient technologies would transform the power sector and automatically reduce
its CO2 emissions. Unfortunately, EU governments agreed to weak limits and weak
financial incentives. Now the ETS is being reviewed, opening up a big opportunity to
get it right next time.
➜ Get involved!
Join the PowerSwitch! campaign
by signing the power pledge
‘I will demand the PowerSwitch! I will urge companies and governments to stop polluting
our atmosphere. I will make the PowerSwitch! to clean and efficient energy. I will ask my
family and friends to join me and take action. For our climate, our planet and our health
– I will act NOW!’
You can sign the pledge and get more details on the PowerSwitch! campaign at
www.panda.org/powerswitchHow to survive the heat
➜ Increase fluid intake – don’t wait until you‘re
thirsty to drink. Try to avoid drinks containing
caffeine, alcohol, or large amounts of sugar, as
these cause the body to actually lose fluid.
➜ Replace salt and minerals. Perspiration
removes vital salt and minerals from the body, WWF International, CH-1196 Gland, Switzerland.
which must be replaced. However, if you are on a Written by John Ashton
low-salt diet, you should consult your doctor. Design by katja grubitzsch, corporate design, www.grubitzsch.de
➜ Avoid hot foods and heavy meals – these add Published in August 2005 by WWF-World Wide Fund For Nature
to your overall body heat. (Formerly World Wildlife Fund), Gland, Switzerland.
Any reproduction in full or in part must mention the title and credit
the above-mentioned publisher as the copyright owner.
➜ Be sure to cover yourself properly in the
sun. Wear pale-coloured, lightweight, loose-fitting © 2005, WWF. All rights reserved.
clothes, a wide-brimmed hat and sunglasses. Use ® WWF Registered Trademark Owner
sunscreen (at least factor 15) on any exposed skin. © 1986, WWF-World Wide Fund For Nature
(Formerly World Wildlife Fund), Gland, Switzerland.
➜ Stay in the shade. Seek a cool indoor space,
© WWF-Canon / Emma DUNCAN, John E. NEWBY,
or, if you’re outdoors, stay out of the sun as much
Mauri RAUTKARI, Michel GUNTHER, Isaac VEGA,
as possible. André BÄRTSCHI, Rob WEBSTER, Donald MILLER,
Peter PROKOSCH, Roger LeGUEN, Bernd LAMMEL,
➜ Pace yourself. Try to limit physical activity, Adam OSWELL
especially if you’re outside in the sun. © Pro Natura Zentrum Aletsch/Laudo Albrecht
WWF’s mission is to stop the degradation of the planet’s natural
environment and to build a future in which humans live in
harmony with nature, by:
- conserving the world’s biological diversity
- ensuring that the use of renewable natural resources is
sustainable
- promoting the reduction of pollution and wasteful consumption.You can also read