THE FRAME LATENCY OF PERSONALIZED LIVESTREAMING CAN BE SIGNIFICANTLY SLOWED DOWN BY WIFI
←
→
Page content transcription
If your browser does not render page correctly, please read the page content below
The Frame Latency of Personalized Livestreaming
    Can Be Significantly Slowed Down by WiFi
Guoshun Nan‡ , Xiuquan Qiao‡ , Jiting Wang⇤k , Zeyan Li⇤k , Jiahao Bu⇤k , Changhua Pei¶ , Mengyu Zhou† , Dan Pei⇤k§
  ‡ Beijing University of Posts and Telecommunications ⇤ Tsinghua University † Microsoft Research ¶ Alibaba Group
                k Beijing National Research Center for Information Science and Technology(BNRist)

           nanguoshun@gmail.com, qiaoxq@bupt.edu.cn, {wangjt15,zy-li14,bjh16}@mails.tsinghua.edu.cn,
                  changhua.pch@alibaba-inc.com, mezho@microsoft.com, peidan@tsinghua.edu.cn

   Abstract—The popular personalized livestreaming (PL) in           with PL applications [3] in US. On the other hand, WiFi is
China, arguably the largest PL market in the world, is more          the primary Internet access method and delivers 43% of total
monetized than PL in US and hence demands much lower                 Internet traffic [4], while WiFi can be the major contributor
interactive latencies to ensure a good quality of user experience.
However, our pilot experiment shows that the video frame             of the end-to-end packet latency in densely populated areas
latency, dominant component of PL’s interactive latency, can be      where WiFi congestion and interference are high [5], [6]. In
significantly slowed down by WiFi, the primary Internet access       summary, compared to Periscope in US, much lower latency
method for PL. Understanding and further improving the frame         is demanded in China to ensure a good QoE, yet the wireless
latency over WiFi, however, have difficulties in 1) measuring        network connectivities are potentially much worse.
end-to-end latency; 2) parsing encrypted PL’s traffic and 3)
modeling complex relationships between WiFi radio factors and           For above reasons, this paper aims to characterize and
the latency. To tackle these challenges, we design and prototype     further reduce the latency of the personalized livestreaming
Latency Doctor (LTDr), a practical system which aims to model        over WiFi (PLoW for short) in China. To this end, we need
and optimize PL’s video frame latency over WiFi. We deploy           to measure the end-to-end interactive latency of PLoW, more
LTDr in our campus and obtain several key observations based         specifically, video frame latency. We also measure the WiFi
on 13.9M video frames extracted from 12K individual views
on three leading PLs in China. We observe that 40% frame             radio factors such as channel utilization, queue length, etc.
latencies over WiFi hop are more than 30ms, and channel              Then we study the impact of radio factors on PLoW’s latency
utilization should be less than 64% for low latency. Then we         and build a predictive model. Such an understanding and a
build a predictive model based on the dataset using the machine      model can help WiFi protocol designers, WiFi network owners
learning methodologies. Two real cases show that the median          and designers, and PL applications to make the right deci-
frame latencies are decreased by LTDr from 130ms to 22ms,
and 50ms to 12ms respectively over WiFi networks.                    sions to mitigate, alleviate, or get around of WiFi’s negative
                                                                     impacts on PL’s latency. For example, suppose a PL App is
                         I. I NTRODUCTION                            experiencing long frame latency and it observes the current
                                                                     WiFi channel is congested, it can then switch to an alternative
   In the past few years, personalized livestreaming (PL)            wireless access point (AP) with a less congested channel (see
has become very popular around the world. Compared with              our implementation of this approach later in Section VI-B).
traditional video services, it requires low latency to support          There exist three major challenges for achieving above
high interactions between a PL’s broadcaster and thousands of        goals. First, it is infeasible to measure the end-to-end frame
audiences. This interactive latency becomes one of the most          latency for PLs in China for third parties like us. The times-
important metrics for quality of user experience (QoE) of PL         tamp for frame delivery can be measured on the client side on
applications [1], [2] in addition to the well-known metrics          smart phones, while there is no timestamp for frame creation at
such as playback buffering. Previous studies [1], [2] have           the broadcaster side in any major PLs in China (different from
helped us understand the characteristics and the performance         Periscope [1]). To tackle this challenge, we opt to measure the
of Periscope [3] in US. However, the landscape of PLs in             “frame latency on the WiFi hop” instead, and use Open-Wrt
China is totally different. PLs in China are more monetized          based wireless AP as instruments to measure the timestamps
in that broadcasting becomes a profession: broadcasters can          when the frame is delivered to an AP. In fact, as will be shown
make a living by actively interacting with viewers (e.g., react      in our testbed experiments in Section III, frame latency on
to viewers’ requests) and then receiving cash gifts from the         the WiFi hop contributes to more than 50% of the end-to-
viewers (see details in Section II). Hence, much lower inter-        end frame latency, for 25% of the video frames, thus it is
active latency is required to meet viewer’s demand compared          worthwhile to single it out anyway. On the other hand, the
     Dan Pei§ is the corresponding author.
                                                                     AP instruments can naturally measure the WiFi radio factors
                                                                     on AP as done in [5]. It should be noted that the PL’s frame
                                                                     latency at the WiFi hop is quite different from WiFi’s per-
978-1-5386-6808-5/18/$31.00 c 2018 IEEE                              packet latency, which can be simply measured by the ping
command at a mobile client (illustrated in Fig. 2 and Fig. 4). • To the best of our knowledge, LTDr is the first systematic
Second, to measure the frame latency at the WiFi hop, the work that can help a wireless AP owner or operator to
video traffic captured on an AP should be parsed to obtain monitor the PL latency and prioritize the WiFi factors
the arrival time of the first packet of a frame. However, to improve the PL QoE. We build and deploy a predic-
the PL traffic on AP and commercial PL Apps are both tive model based on our dataset using machine learning
encrypted, making it hard to measure the frame latency over methodologies. Two real applications deployed in our
WiFi. To tackle this second challenge, we take advantage campus show that median frame latencies are decreased
of the unencrypted video API with RTMP [7] URLs, and from 130ms to 22ms, and 50ms to 12ms over residential
modify a video player (ijkPlayer [8]) to directly request the and EWLAN WiFi networks, respectively.
RTMP URLs of PL broadcasts to mimic a real viewer, so that
the packet receiving time can be recorded by the modified II. P ERSONALIZED L IVESTREAMING IN C HINA
ijkPlayer and unencrypted RTMP streaming can be captured A. Application characteristics
on an AP. Thus we can pinpoint the time points of the TCP We have crawled a dataset that consists of 0.91 million
packets that are formed into a video frame to calculate each broadcasts from two leading PL platforms, i.e., Meipai and Yi
frame latency at the WiFi hop offline based on the video traces. from 20th December 2016 to 10th February 2017. We focus on
Third, it is challenging to build simple yet accurate models the interesting findings that show a difference from Periscope
to understand the impact of WiFi factors on PL latency and [1], [2]. The datails are described as follows.
even build predictive models, given the potentially complex 1) PLs in China are more popular: As depicted in Fig.
relationships among factors and between factors and PL per- 1(a), the medians of viewer number per broadcast of Yi and
formance. We use Random Forests/Decision Trees to tackle Meipai are 2000 and 400, which are 200 and 40 times larger
this challenge based on a large dataset collected on our testbed. than Periscope’s viewing figures[1], i.e., 10 viewers.
We then verify their effectiveness on both residential and
EWLAN 802.11 wireless networks.
Overall, we propose and implement Latency Doctor (LTDr),
a system framework to measure and reduce the latency of
PLoW. LTDr has been deployed on our university campus
network in China for three months. The resulting dataset
consists of 12 thousand RTMP broadcast views with 13.9 Powered by TCPDF (www.tcpdf.org)
million video frames from Inke [9], Meipai [10] and Yi [11],
Powered by TCPDF (www.tcpdf.org)
Powered by TCPDF (www.tcpdf.org)
(a) (b)
which are three leading commercial PL platforms in China. Fig. 1. Application characteristics. (a) Amount of viewers per broadcast, (b)
Powered by TCPDF (www.tcpdf.org)
Length of broadcasts for Meipai.
We then characterize and quantify the complex relationships
between WiFi radio factors and the WiFi hop frame latency. 2) The lengths of broadcasts in China are much longer:
Finally, two practical applications are deployed to reduce the As shown in Fig. 1(b), the 25th, 50th and 75th percentile
PL’s frame latency over WiFi by model-based optimization. values are 4min, 17min and 47min for Meipai, respectively,
This paper’s major contributions are summarized as follows: while they are 1min, 4min and 10min for Periscope [1]. It
• We present the first study on PL in China, and find that PL shows that 10% of broadcasts last more than 137 minutes.
characteristics in China are quite different from Periscope, 3) PLs in China are more monetized: We observe that
e.g., it is more monetized, and the amount of online a broadcaster in China can make money from online users
broadcasters, viewers and views are much larger (Section through talent shows, such as singing and telling jokes. Hence,
II-A). much lower interactive latency is required for PL applications
• To the best of our knowledge, we provide the first large- in China compared with those in the United States.
scale dataset consisting of video frame latency of PL
over WiFi, which we plan to release to the public. The B. Interactive latency (ITL)
dataset is re-constructed from RTMP-based video traces Fig. 2 breaks down the interactive latency (IT L) for a
that are collected by a modified media player rather than RTMP-based PL broadcast during which there is an interaction
simulations or scripts. Furthermore, our WiFi testbed can between the viewer (over WiFi) and broadcaster (who is doing
be scaled by a carefully designed traffic generator to a talent show).
enrich the parameter space (Section IV). Message latency (MSL): The text-based messages gener-
• We present the first study on WiFi hop frame latencies ated by the viewer are delivered via HTTP. We assume that
for PL. The results show that 40% of the frame latencies the viewer gives a gift to the broadcaster to pay for a live song
are larger than 30ms, leading to a poor user experience at the time t1 . The WiFi AP, message server and broadcaster
for interactive streaming [12] (Section IV). receive the message at t2 , t3 and t4 , respectively. Hence, MSL
• We characterize the complex relationships between WiFi can be denoted by t4 t1 . We assume that the broadcaster
factors and the WiFi hop frame latency, and also quantify begins to sing at t4 , just the moment of receiving the gift.
the significant impact of channel utilization and queue Video frame latency (VFL) and video frame latency over
length on the quality performance (Section V). WiFi (VFLW): The video frames created by the broadcasterA viewer gives a gift
and inputs: pls sing HTTP connection HTTP
The broadcaster starts singing
t1
t2
MSL
t3
t4
t5
ITL
t6
VFL
Receiving a response
VFLW t7
(a) (b)
Fig. 3. (a) A pilot testbed to measure interactive latency (i.e., IT L) and video
frame latency over WiFi (i.e., V FLW ). (b) The distribution of VIT FLW
L , which
BD
RTMP connection RTMP indicates that V FLW can be the major contributor of IT L.
Viewer PL App Access Point Server App Broadcaster
mobile phone, whose camera points to a running stopwatch.
Fig. 2. The breakdown of PL’s interactive latency. A viewer joins this broadcast with the RTMP URI of the
broadcast using VLC media player on each of the two laptops,
are delivered via RTMP [7]. The video contents have been
and the time displayed both at the broadcaster and viewer
encoded into H.264 format RTMP frames on the broadcaster’s
side are recorded manually. These experiments are repeated 40
PL App and they are then sent to a RTMP server, which
times over WiFi and wired networks every 5 minutes between
receives the first video frame at t5 . The frame is then sent to
9:00 a.m to 10:00 a.m, 13:00 to 14:00, and 20:00 to 22:00. We
the client over another RTMP connection established between
set the playback buffer of VLC as zero and. Hence, BD equals
viewer’s PL App and the RTMP server. The WiFi AP along the
0 throughout the measurement. This allows us to measure V FL
path receives the first packet of the frame at t6 . After a while,
of the two access networks, which can be roughly derived
all of the packets of the frame are delivered to the viewer’s
by the difference between viewer time and broadcaster time.
PL App at t7 . V FL and V FLW can be represented by t7 t4
Thus, V FLW can be further derived by the difference of V FL
and t7 t6 , respectively.
over WiFi and wired network. To obtain the MSL, we create
Buffer delay (BD): Finally the viewer watches the broad- a broadcast using Meipai App on a mobile phone and join the
caster’s show after another BD milliseconds, where BD is the broadcast by Meipai App running in the Android simulator,
size of playback buffer of the PL’s media player. both on WiFi and wired networks. We type a message at
We focus on V FLW denoted by t7 t6 , since the last hop the viewer side, and we then record a video of both the
frame latency dominates of the IT L (see details in Section viewer’s and the broadcast’s screen. MSL can be derived by
III). Due to the space limitations, we omit some details, such the timestamp difference of sending frame and receiving frame
as video transcoding on a RTMP server, data copy from TCP in a recorded video. Finally, we get IT L = V FL + MSL and
buffer to a media player’s decoder, initialization of a TCP V FLW of Meipai respectively over WiFi networks.
connection and DNS lookup, etc. Fig. 3 (b) plots the distribution of the ratio of V FLW to
IT L based on our pilot measurement. It shows that the 75th
III. M OTIVATING E XAMPLE
percentile is 50%, which means that, for about 25% of video
As shown in Section II, in China, PL is more monetized in frames, the latency at the WiFi hop (i.e., V FLW ) contributes
that broadcasting has become a profession. Many broadcasters to more than 50% of the frames interactive latency (i.e., IT L).
make a living by actively interacting with viewers (e.g., react Furthermore, as will be shown in Fig. 6 (c), 80% of the V FLW
to viewers request) and then receiving cash gifts from their is the WiFi overhead. These observations motivate us to model
viewers. Hence, much lower interactive latency is required to and improve the V FLW of PLoW for a good QoE. Although
support these activities compared with PL in the United States. the upstreaming message latency over WiFi (i.e., t2 t1 in Fig.
However, PL latency in China is little understood because 2) can also be impacted by WiFi, the small size of the message
it is infeasible for third parties like us to measure this key makes WiFi’s impact much less significant. Therefore, we
metric. The timestamps of frame delivery can be measured focus on PL’s V FLW in this paper, which can be the major
at client side in US, because Periscope puts timestamps at the contributor of PL’s end to end interactive latency.
frame creation at the broadcaster’s side, while there is no such
WiFi AP The header of a RTMP frame
timestamp for PL in China. Previous studies show that WiFi T1
is the weakest link for end-to-end packet latency [5], [6]. To A RTMP frame
… …
… …
this end, we setup a testbed as shown in Fig. 3 (a) to quantify PL Client T2
the contribution of V FLW to IT L using two pairs of laptops
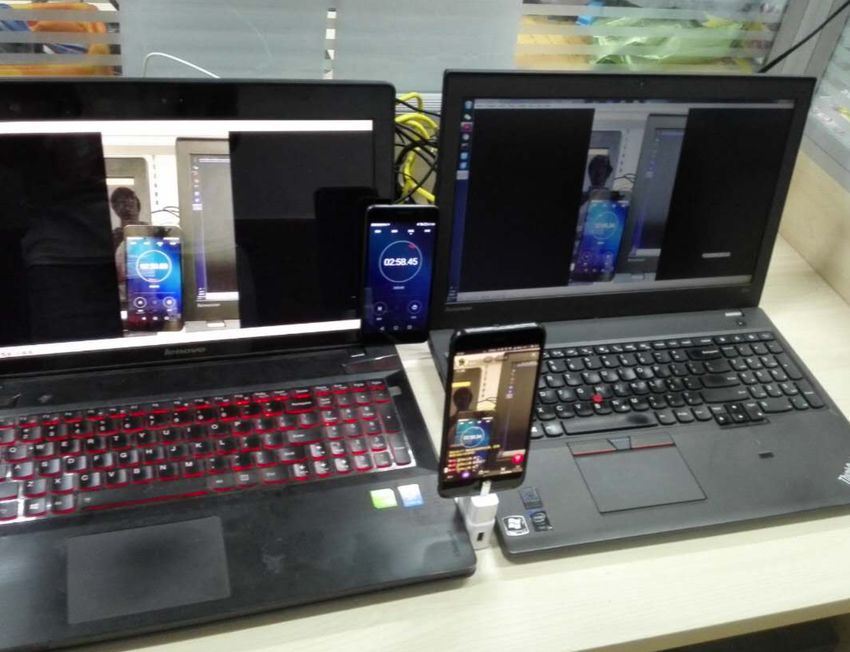
and mobile phones, VLC media player [13] and an Android Fig. 4. T2 T1 denotes the video frame latency over WiFi, where T1 and T2
represents the time when the first packet of a video frame is received by an
simulator. AP’s wired NIC and the last packet of the frame received by the video player,
To evaluate the impact of last hop WiFi on IT L and to respectively.
isolate other factors, such as operation system and hardware IV. DATA C OLLECTION
platform, we connect one laptop to an Open-Wrt AP via WiFi In this section, we present and deploy Latency Doctor
(802.11n, 2.4GHz) and another laptop to an Ethernet network (LTDr), a system framework which collects, measures, and
which shares the same backhaul connection. We created a reduces the PL’s V FLW . A large dataset is collected by LTDr
broadcast on one of commercial PLs (i.e., Meipai) using a from three leading PLs in China.RTMP Construct RTMP links
④ Get an RTMP link from the local server
Links on the local server ③
⑤ Respond the RTMP link ① Crawl broadcast lists Commercial Personalized
⑨ Livestreaming platform
⑧ Dump video traces and WiFi Upload dumped files
IjkPlayer ② Respond broadcast lists
factors on the AP Meipai
Dumped Local Server
Mobile files NTP Sync ❿ NTP server
Device
⑩ NTP Sync with a drift
⑥ Join a broadcast and interact with the broadcaster using the RTMP link Yi Inke
⑦ Push video streaming
A video frame A video frame
Fig. 5. LTDr’s detailed process for measuring PL’s frame latency over WiFi (i.e., V FLW ).
A. Measuring video frame latency over WiFi B. Deployment and dataset
As shown in Fig. 4, V FLW can be denoted by T2 T1 . It We deploy LTDr in the Tsinghua campus network, con-
equals the time elapsed between the first packet of a video sisting of 12 mobile phones and 12 Open-Wrt based NET-
frame arrives at an AP’s wired NIC at T1 , and the complete GEAR4300 APs (802.11n, 2.4GHz) located in four labs to
frame is received by a media player at T2 . However, most capture video traces and WiFi factors, two servers to crawl
commercial PL traffic is encrypted in China, making it difficult RTMP URIs and computing V FLW . We focus on 2.4GHz
to obtain T1 and T2 . To tackle this challenge, we modified the WiFi in this paper because it is more crowded than 5GHz
ijkPlayer ⇤ [8] to mimic a real viewer who can join and leave band, and it is still much more popular than 5GHz in our
a PL broadcast periodically, using the RTMP URLs that are campus. However, the methodologies and predictive models
crawled from the unencrypted video APIs of PL platforms. verified under 2.4GHz band could also be easily extended
However, identifying the first TCP packet of a RTMP frame to a crowded 5GHz WiFi network. The WiFi factors (See
from a video trace is challenging because a RTMP header details in [5]), including Channel Utilization (CU), Inter-
and video data are always encapsulated in the same packet. ference Utilization (IU), Queue Length (QL), Retry Ratio
To tackle this challenge, our proposed LTDr compares and (RR), Transmitting Throughput (Ttx ), Receiving Throughput
searches the binary data in a video trace according to RTMP (Trx ), RSSI, Receiving Physical Rate (RPR) and Transmitting
specification [7] to pinpoint this frame boundary. Physical Rate (TPR), are captured using the Linux commands
Measuring T1 : To obtain real video traces on our testbed, on each AP every 100ms. In total, 12 thousand broadcasts have
we continuously crawl unencrypted broadcast list pages of been viewed by the customized ijkPlayer from 12th December
Meipai, Inke and Yi (Step ¨ and ≠ in Fig. 5), and we then 2016 to 10th February 2017 and the corresponding video traces
construct the RTMP links based on the crawled URLs (Step are reconstructed into millions of video frames with V FLW .
Æ in Fig. 5). We customized the ijkPlayer [8] and made it Details of the Dataset I1 are shown in Table I.
run on a mobile phone to periodically access RTMP links to
C. Distributions
mimic the user’s viewing actions, such as joining and leaving
every 5 minutes (Step Ø to ≤ in Fig. 5). The video traces Fig. 6 (a) plots the distribution of V FLW . It shows that 40%
are captured by tcpdump on the connected AP’s wired NIC of V FLW is larger than 30ms. A previous study has shown that
and then they are uploaded to a server periodically (Step ≥ [12] the end-to-end latency of interactive online gaming should
and ¥ in Fig. 5). During offline analysis, the server parses be less than 60ms to ensure a good user experience, which,
video traces and identifies the first TCP packet of each RTMP although from a different domain, helps calibrate how large a
to obtain a frame number and its receiving time T1 on AP’s 30ms V FLW is. Fig. 6 (b) depicts the distribution of packet
wired NIC, referring to the RTMP specifications. The system count in video frames of PL. It shows that about 40% of the
time of an AP is synchronized with an NTP server (Step ø frames consist of more than three packets. Fig. 6 (c) presents
in Fig. 5). the distribution of WiFi overhead of a frame (including channel
TABLE I backing off time, delay caused by re-transmission, etc). It
DATASET COLLECTED FROM M EIPAI , I NKE AND Y I
shows that WiFi overhead can contribute to more than 80%
Dataset WiFi Environment Viewed broadcasts Video frame of V FLW .
I1 Real environment 10000 9.6M In summary, the findings in Fig. 6 highlight the importance
I2 Injected interference 2000 4.3M
of understanding WiFi’s radio impact on PL’s V FLW . We can
Measuring T2 : The customized ijkPlayer logs each RTMP also conclude that the PL’s V FLW , as shown in Fig. 2 and Fig.
frame’s number and its receiving time T2 when a completed 4, is quite different from WiFi’s per-packet latency, which can
video frame is constructed in the media player from the TCP be simply measured by the ping command on a mobile client.
buffer. Although the NTP client on an Android phone can
V. M ODELING
record the phone’s clock drift, there is no Android interface
to actually adjust the phone’s clock conveniently. Instead, we A. Enriching the parameter space
send the recorded drift to the data collection server which Our dataset collected from the campus testbed can hardly
adjusts T2 timestamps accordingly (Step µ in Fig. 5). cover all of WiFi parameter space. To mitigate this limitation,
⇤ The ijkPlayer is an open sourced media player that is designed for PL, we deploy a traffic generator and introduce background traffic
and is used by bilibili, a very famous video streaming platform in China. and wireless interference for a broad range of parameter(a) (b) (c)
Fig. 6. (a) Distribution of the video frame latency over the WiFi hop; (b) Distribution of packet count per frame; (c) Distribution of WiFi overhead in V FLW .
(a) (b) (c) (d)
Fig. 7. Relationship between WiFi factors (x-axis) and PL’s V FLW (y-axis).
settings. As will be discussed in Section V-D, this work TABLE II
can also help to build a more accurate and robust machine K ENDALL C ORRELATION S CORE (KCS) AND R ELATIVE I NFORMATION
G AIN (RIG).
learning model because a training set is expected to cover most
of the parameter settings [14]. To this end, we additionally
deploy a WiFi traffic generator and introduce background WiFi QL CU RPR IU RR RSSI Trx TPR Ttx
traffic and wireless interference. The generator contains 30 KCS 0.44 0.39 -0.37 0.37 0.15 0.14 0.14 0.01 0.05
RIG 0.06 0.06 0.05 0.04 0.003 0.02 00 -0.06 0.02
NETGEAR4300 WiFi routers, which are divided into three
groups, each containing 10 routers. We set wireless channel To quantify the relationship between WiFi factors and
number as 1, 6 and 11 for each group, respectively. In each V FLW , we consider the Kendall Score (KCS) and Relative
group, five routers are set as wireless clients and other five are Information Gain (RIG) that are used in [15]. Table II shows
configured as servers. Each client associates with an individual the results of these measurements, which are listed in a
server. Then, a client sends UDP requests to the corresponding descending order of KCS, with outstanding values highlighted
server using the iper f tool, with rates ranging from 1Mbps, in blue.
2Mbps,...,16Mbps. We then run LTDr and deploy the traffic In summary, we have studied the complex correlations
generators from 10th February to 10th March 2017. Table I between each WiFi factor and V FLW based on a dataset
depicts Dataset I2 collected by the modified ijkPlayer. collected from three leading PL platforms in China. However,
such single-dimension analysis is not enough and, hence,
B. Single-dimension analysis the quantifications on multiple-dimensions are expected to
build a simple yet accurate predictive model. Therefore, in
Fig. 7 depicts the relationships between WiFi factors and the following parts, we use machine learning methodologies
PL’s V FLW based on Dataset I1. We summarize the main to quantify on multiple-dimensions and build a simple yet
take-aways as follows. accurate predictive model
1. Heavy workloads lead to higher VFLW: As shown in Fig.
7 (a), increasing Channel Utilization (CU) will significantly C. Modeling overview
increase the V FLW . These results suggest that CU should be As previously discussed, accurately predicting V FLW is
under a threshold to reduce V FLW at a certain level. We will challenging due to the complex relationships between highly
discuss these values in Section V-E. dynamic WiFi factors and V FLW , and these relationships are
2. Queue length and retry ratio correlate well with VFLW: non-linear or even non-monotonic. Furthermore, there exist in-
As shown in Fig. 7 (b) and Fig. 7 (c), longer queue length terdependencies between various wireless network parameters
causes higher V FLW since increasing the length will introduce [5]. To tackle these challenges, we use different supervised
more waiting time on an AP. Higher retry ratio results in higher learning algorithms to evaluate the prediction performance in
VFLW, which can be caused by the interference, fading and terms of recall and precision, including Random Forest, Linear
noise problems. Supporting Vector Machine (L-SVM), Decision Tree and
3. RSSI does not correlate well with VFLW: As shown Logistic Regression. We detail the modeling in the following
in Fig. 7 (d), V FLW fluctuates when RSSI increases. Surpris- parts of this section.
ingly, there is a latency peak at -38dB RSSI. Our investigation
shows that the CU is higher at this part of the dataset. Such D. Selecting machine learning algorithm
result shows the ineffectiveness of single-dimension analysis Labeling: Previous study has shown [12] that a user perceptive
in a complex wireless environment. experience of interactive gaming is good within 60ms latency,and is bad larger than 100ms, and 150ms or more will 2) QL larger than 3.5 may lead to slow VFLW (branch
significantly degrade user engagement by 75%. Due to the b6): We observe that a larger QL (i.e., > 3.5) with a higher
lack of such a reference for PL, we borrow these numbers for CU (i.e., > 64%) leads to SLOW results. This is reasonable
the labeling of PL’s data. Consequently, as shown in Fig. 6(a), because the input traffic from media servers to an AP is always
we label the V FLW of the dataset into binary categories for kept constant while the output speed is significantly impacted
practical usage, including FAST and SLOW with a threshold by the workload of the wireless channel. Hence, a higher CU
configured as 30ms, which is half of the expected latency for leads to a larger QL and introduces additional delay.
a good interactive experience. 3) Smaller RPR with a smaller CU may also result
64% in slow VFLW: The Decision Tree model suggests a SLOW
RPR QL
result when CU < 64%, RPR < 12Mbps and QL > 6.5 (branch
≤12
>12 >3.5 12Mbps) will lead to Fast
QL TX >45 SLOW RR results. We explain this as follows. RPR represents the physical
sending rate of a mobile station and it is controlled by the
b6 23.5%
51% 92%
networks. The algorithms estimate the channel quality and
64%, QL 23.5%.(a) (b) (c)
Fig. 10. (a) V FLW ’s distribution before and after optimization; (b)V FLW ’s distribution of three APs; (c) V FLW ’s distribution before and after re-association.
TABLE III decision to achieve low V FLW by re-associating to the AP
P ERCENTAGE OF PACKETS THAT FALL INTO EACH BRANCH with the best performance.
To this end, we design and implement RLive, a practical
Branch b1 b2 b3 b4 b5 b6 b7 b8 b9
Before 03 03 0 01 19 02 61 12 0
system which leverages the proposed machine learning model
After 09 0 0 01 19 02 00 69 0 to mitigate the negative impact of WiFi factors on V FLW .
RLive consists of two main parts: the RLive application on a
Diagnosis: Based on the classification results, we are able user device and RLive controller on a server. The working
to infer the root cause of SLOW V FLW on the targeting process of Rlive is shown in Fig. 11 and the details are
AP. In the branch b7, CU > 64% at the root node indicates described as follows. Here, we assume the APs in EWLAN can
heavy workload of the channel, hence, this factor should be collect WiFi factors (using SNMP from commercial vendors
firstly considered as a potential cause of SLOW V FLW . QL or using methods listed in [5] on Open-Wrt-based APs).
represents the length of packets queued in an AP’s sending
buffer and a large value may increase the latency. However,
we ignore this feature because it is smaller than 3.5 (i.e., User Device Server
64% and RR > 23.5% ① factors
and guess that a larger RR may be caused by a heavy load or AP2
Read AP list
②
AP List Run machine
...
local contention problem, which increases collision probability ③ 2
1
learning model
④
and the backoff waiting time of a wireless channel by a large Re-associate
Get and update
AP List AP List
number of concurrent senders, and which also decreases the
achievable channel utilization. Hence, we try to switch the
channel of the AP in Room 614 from number 1 to 11 and Fig. 11. Working process of Rlive.
try to find if the playback of PL becomes more smooth. To RLive controller: This controller aims to guide a mobile
get the ground truth of the latency, we parse the video traffic client to select an AP with the lowest V FLW . Hence, it peri-
and get the classifications as shown in the second row of odically predicts the V FLW for each AP, using the Decision
Table III. Now most (i.e., 69%) of the V FLW falls into the Tree model and WiFi factors collected from APs (via SNMP
branch b8, which means 64% < CU < 92%, RRon which we have installed a modified ijkPlayer and RLive model the relationships between fine-grained WiFi factors and
application, three Open-Wrt APs (i.e., AP1, AP2 and AP3) PL’s V FLW using the dataset collected by a media player, in
that are configured to channel 1, 6 and 11, respectively, contrast to script-based packet level measures.
and a remote server that acts as RLive controller. Mobile
VIII. C ONCLUSION
clients MP1, MP2 and MP3 connect to AP1, AP2 and AP3,
respectively. During the experiment, the three clients join We present LTDr, a system framework which collects,
broadcasts of Inke using the modified ijkPlayer. We found that measures, and further reduces the PL’s V FLW to improve the
MP1 suffers many playout bufferings during a viewing. It is PL’s QoE. Our work is motivated by a controlled experiment
noteworthy that playback buffering has a positive correlation which shows that V FLW is the major contributor of the PL’s
with V FLW and can be detected by a media player. interactive latency. To this end, we build a predictive model
Improvement: To improve the V FLW , the RLive applica- based on a real dataset, and verify its effectiveness by two
tion on MP1 sends an alert button to connect AP3. To validate real cases. Such a model can help WiFi protocol designers,
our predictive model, we capture the video traces on each AP WiFi network owners and designers, and PL applications to
to get V FLW as ground truth (see details in Section IV) before monitor or improve PL’s latency. LTDr is general enough and
a re-association. The distributions of V FLW over three APs can be extended for modeling and improving the latency of
are shown in Fig. 10 (b), and we can observe that the median other interactive video streaming services over WiFi, such as
value of V FLW over AP1 is the largest, while the value over video conferencing and mobile cloud gaming. In the future,
AP3 is the smallest. We found that overall IT L over MP1 is we plan to work with AP manufacturers and commercial PL
reduced after clicking the YES button and re-associating to platforms to develop a scaled solution with further generalized
AP3. Fig. 10 (c) depicts the performance comparison before models that can reduce interactive latency.
and after MP1’s re-association, and it shows that the median IX. ACKNOWLEDGEMENT
V FLW is significantly decreased from 50ms to 12ms. The work was supported by National Natural Science
In summary, our simple yet accurate Decision Tree model, Foundation of China (NSFC) under grant No. 61472214, No.
which we built in Section V, can significantly improve the 61472210, and No. 61671081, and the Beijing Natural Science
PL’s V FLW in the wild and, hence, reduces overall end- Foundation under Grant No. 4172042.
to-end interactive latency IT L. We highlight that the AP’s
re-association management in the second case is based on R EFERENCES
the predictive model running on a server, without making [1] B. Wang et al., “Anatomy of a personalized livestreaming system,” in
any changes in operating system kernel or drivers in mobile IMC ’16. New York, NY, USA: ACM, 2016, pp. 485–498.
[2] M. Siekkinen, E. Masala, and T. Kämäräinen, “A first look at quality of
devices. Furthermore, RLive works in an online mode on mobile live streaming experience: The case of periscope,” in IMC ’16.
the mobile client side and, hence, differs from commodity New York, NY, USA: ACM, 2016, pp. 477–483.
WiFi routers, such as Cisco Prime and Aruba, which always [3] “Periscope,” https://www.periscope.tv/, [Online].
[4] “Cisco VNI Global Mobile Data Traffic Forecast, 2016-
dynamically select a spare channel for an AP during startup 2021,” http://www.cisco.com/c/en/us/solutions/collateral/service-
via a centralized network controller. provider/visual-networking-index-vni/mobile-white-paper-c11-
520862.html, [Online].
VII. R ELATED WORK [5] C. Pei, D. Pei et al., “Wifi can be the weakest link of round trip network
latency in the wild,” in INFOCOM 2016, April 2016, pp. 1–9.
Measurement and optimization of PL: Previous studies [1], [6] K. Sui, D. Pei et al., “Characterizing and improving wifi latency in
[2] have conducted detailed analysis of mobile PL based on large-scale operational networks,” in MobiSys ’16. New York, NY,
USA: ACM, 2016, pp. 347–360.
two leading applications: Periscope and Meerkat. We differ [7] “Real-time messaging protocol (rtmp) specification,”
from these works in the video frame latency measures and http://www.adobe.com/devnet/rtmp.html, [Online].
modeling over last hop WiFi (i.e., V FLW ). Furthermore, [8] “ijkplayer,” https://github.com/Bilibili/ijkplayer, [Online].
[9] “Inke,” http://www.inke.cn/, [Online].
our dataset is collected from three leading PL platforms in [10] “Meipai,” http://www.meipai.com/, [Online].
China, whose characteristics are quite different from those of [11] “Yi,” http://www.yizhibo.com/, [Online].
Periscope and Meerkat in [1], [2]. [12] K. Lee, Chu et al., “Outatime: Using speculation to enable low-latency
continuous interaction for mobile cloud gaming,” in MobiSys ’15. New
Studies of other interactive applications: A previous [18] York, NY, USA: ACM, 2015, pp. 151–165.
study has used multiple wireless links to improve VoIP stream- [13] “Vlc media player,” http://www.videolan.org/vlc/, [Online].
ing quality over WiFi. Outatime is proposed in [12] to reduce [14] X. S. Wang et al., “How speedy is spdy?” in NSDI ’14. Seattle, WA:
USENIX Association, 2014, pp. 387–399.
online gaming latency over mobile network. The authors of [15] F. Dobrian, V. Sekar et al., “Understanding the impact of video quality
[19] measured mobile video call applications over WiFi and on user engagement,” pp. 362–373, 2011.
cellular networks. However, we improve the PL’s V FLW with [16] “Spark mllib,” http://spark.apache.org/mllib/, [Online].
[17] S. H. Y. Wong, H. Yang, S. Lu, and V. Bharghavan, “Robust rate
encrypted video traffic by model-based optimization, without adaptation for 802.11 wireless networks,” in MobiCom ’06. New York,
requiring any changes on a WiFi AP. NY, USA: ACM, 2006, pp. 146–157.
Characterizing WiFi networks: Past works have extensively [18] R. Kateja et al., “Diversifi: Robust multi-link interactive streaming,” in
CoNEXT ’15. New York, NY, USA: ACM, 2015, pp. 35:1–35:13.
studied WiFi performance, such as last hop latency measured [19] C. Yu, Y. Xu, B. Liu, and Y. Liu, “can you see me now? a measurement
by TCP three-ways handshakes over a campus WiFi [5] and study of mobile video calls,” in INFOCOM, 2014 Proceedings IEEE.
ping based instrument over an EWLAN [6]. In this paper, we IEEE, 2014, pp. 1456–1464.You can also read