Hamilton International Airport - MASTER PLAN 2030 12 March 2009 - FYI
←
→
Page content transcription
If your browser does not render page correctly, please read the page content below
MASTER PLAN 2030
Hamilton        12 March 2009
International
Airport
Contents                   1
                                   2
                                   3
                                       INTRODUCTION
                                       AIRPORT DESCRIPTION
                                       DISTRICT PLANS
                                                                         1
                                                                         3
                                                                         8
                                   4   AVIATION ACTIVITY AND FORECASTS   13
                                   5   PLANNING PARAMETERS               22
                                   6   AVIATION FACILITY REQUIREMENTS    25
                                   7   FREIGHT                           34

HAMILTON INTERNATIONAL AIRPORT
MASTER PLAN
HAMILTON MP REPORT KL 12/03/2009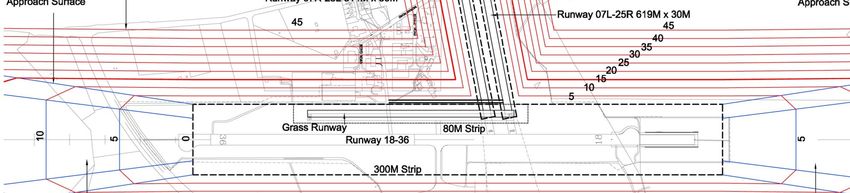
1.1. Background

1 Introduction                         Hamilton International Airport (HIA) has engaged Airbiz to assist in the
                                       preparation of an airfield master plan. The objective is to prepare a 20 year
                                       master plan to 2030 for the airfield areas of the airport (runways, taxiways,
                                       aprons, safety areas, and bulk location for terminal areas), for three
                S                      principal purposes:
                                       •   To provide greater detail and clearer guidance about long-term
                                           aeronautical requirements to avoid encroachment and ensure
                                           compatibility of near-future commercial developments on the airport,
                                       •   To identify potential airfield capacity constraints (e.g. peak period
                                           runway congestion),
                                       •   To identify long-term aeronautical land requirements and safety areas
                                           for HIA and regional planning; and
                                       •   To identify staging for infrastructure developments (e.g. taxiway
                                           construction) that would alleviate future capacity constraints, for the
                                           purposes of high level capital works programming.
                                       Concurrently, HIA engaged Airbiz to prepare a scoping study on the
                                       Airport’s opportunities in relation to attracting new airlines in both the trans-
                                       Tasman and long haul markets.
                                       Clearly, the two studies are closely inter-related as success in one (the
                                       business development strategy) informs the demand scenarios for the
                                       master plan and guides the requirements for near-future infrastructure
                                       including runway length and terminal area facilities.
                                   1.2. Approach and Consultation
                                       An initial workshop was held in Hamilton on 5 September 2007 with HIA
                                       management. The workshop session provided an opportunity for
                                       consideration of most aspects of the master planning process, including:
                                       •   Demand projections
                                       •   Planning parameters
                                       •   Constraints and issues
                                       •   Ultimate development of airfield
                                       •   Staging.
                                       In late 2007 and early 2008, master planning focussed on identifying the
                                       core land required for aviation purposes so that the balance of peripheral
                                       land could be allocated for non-aviation commercial purposes. Also

HAMILTON INTERNATIONAL AIRPORT                           1
MASTER PLAN
HAMILTON MP REPORT KL 12/03/2009
analysed were the OLS constraints on the surrounding land,
        recommendations for land use under the flight tracks, and
        recommendations on sizes for parcels of land which opened on to
        aeronautical land. The bulk of commercial areas have been incorporated
        into HIA’s Titanium Park Joint Venture development with the remaining
        area allocated for commercial uses under direct HIA control.
        Airbiz canvassed freight opportunities with the HIA executive management
        team in early 2008.
        During 2008, HIA concentrated on developing its airline marketing
        initiatives and considering the implications for runway length that might be
        associated with various new route scenarios.
        In later 2008, the Master Plan process involved a review of the earlier
        traffic forecasts, for both master planning and noise contour preparation. In
        particular, the airport had been experiencing strong growth in flying training
        activities and HIA wanted to be sure that the Master Plan and noise
        contour forecasts were accounting for this satisfactorily.
        With these further planning tasks now complete, the overall Master Plan
        has been finalised.

HAMILTON INTERNATIONAL AIRPORT                                                           2
MASTER PLAN
HAMILTON MP REPORT KL 12/03/2009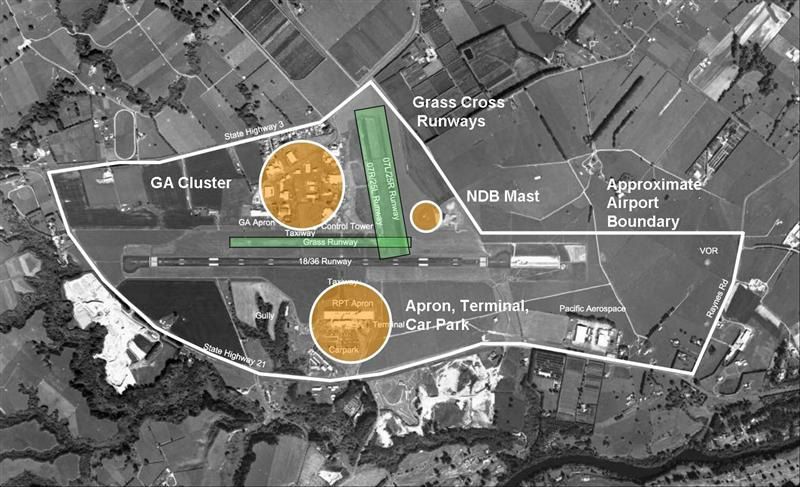
2.1. Ownership

2 Airport                               HIA is owned and operated by the Waikato Regional Airport Limited
                                        (WRAL). The following five local councils share the ownership of WRAL as
                                        follows:

  description
                                        Hamilton District Council        50.000%
                                        Waipa District Council           15.625%
                                        Piako District Council           15.625%
                                        Waikato District Council         15.625%
                                        Otorohonga District Council       3.125%.
                                   2.2. Airport Location
                                        HIA is located on a 277 hectare site (of which 215 hectares is retained by
                                        WRAL and 63.4 hectares by Titanium Park) approximately 14 kms south of
                                        Hamilton City and is sited strategically between State Highways 1, 3 and
                                        21. Refer to Figure 2-1 which depicts the location.

                                                                                     N

                                        FIGURE 2-1   HAMILTON AIRPORT LOCATION

HAMILTON INTERNATIONAL AIRPORT                           3
MASTER PLAN
HAMILTON MP REPORT KL 12/03/2009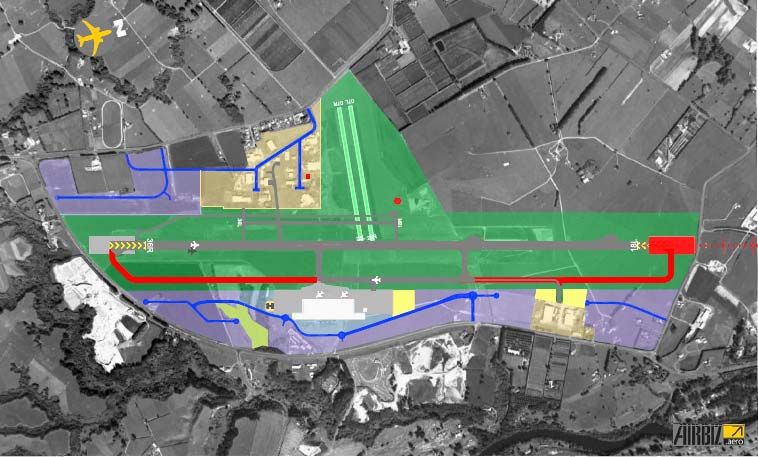
Auckland International Airport (AIA), New Zealand’s largest international     A substantial General Aviation (GA) and aircraft maintenance precinct has
        airport is approximately 90 minutes drive north from HIA.                     developed to the west of the main runway, with landside access from State
                                                                                      Highway 3.
2.3. Current Airport Infrastructure
        Four runways provide a platform for aviation operations. The main sealed      The major GA operator situated at the Airport is CTC Aviation Training
        runway 18L/36R was extended to its current length of 2195m in 2006.           (NZ) Limited. The 1800m2 Crew Training Centre provides training facilities
        There is a parallel grass runway 18R/36L of 875m length. There are also       on the airport site for up to 190 trainee pilots annually. This purpose-built
        two parallel grass cross runways, 07L/25R and 07R/25L. The declared           training centre is based on a 2.8 hectare site adjacent to the airport’s main
        operational lengths of each runway are shown in Table 2-1.                    runway and has an on-site aircraft maintenance area which supports the
                                                                                      centre’s fleet of 30 aircraft comprising a mix of single and twin engine
                                                  Runway declared lengths (m)         types.
                                                                                      CTC’s contribution to the numbers of aircraft movements is predicted to
             Runway                Surface    ASDA           TODA               LDA   increase even further as the training centre has recently expanded its
                 18L                           2135          2165(1)        1782      facilities to include:
                                     B
                 36R                           2195           2255          2059      •   Additional flight simulators
                 18R                                                                  •   More ramp space for aircraft parking
                                     Gr        750            750(2)            750
                 36L                                                                  •   Additional numbers of trainees
                 07L                                                                  •   Student accommodation – a purpose-built trainee accommodation
                                     Gr        720            720(3)            720       complex on nearby land.
                 25R
                                                                                      Other GA operators include:
                 07R
                                     Gr        715            715(3)            715   •   Pacific Aerospace Corporation Ltd which manufactures and distributes
                 25L                                                                      three aircraft types from their hangars adjacent to State Highway 21
        TABLE 2-1        CURRENT RUNWAY DATA                                          •   Alpha Aviation Ltd which manufactures training aircraft from their site
                                                                                          west of the GA cluster
        Notes:         (1)     TODA at 1:50
                                                                                      •   The Waikato Aero Club, which is also involved in flying training
                       (2)     TODA at 1:20
                                                                                      •   Superair Ltd, which is a large top-dressing company that maintains
                       (3)     TODA at 1:30
                                                                                          their head office and maintenance facilities on the west side of the
                                                                                          main runway, and
        Two stub taxiways link the main runway to the aprons as follows:
                                                                                      •   Various GA engineering organisations operating in and around the GA
        •    A Code C stub taxiway provides access to the passenger terminal
                                                                                          cluster.
             apron on the eastern side,
                                                                                      Eagle Airways Ltd is a regional carrier Beech1900D operating aircraft on
        •    A Code B stub taxiway provides access to the GA area on the western
                                                                                      regional routes. It is a wholly owned subsidiary of Air New Zealand and
             side.
                                                                                      maintains its head office and engineering facility at HIA on the west side of
        The terminal building has a gross floor area of approximately 6,600m2 and     the main runway.
        caters for a range of domestic and international services.
                                                                                      HIA has the fourth longest commercial runway in New Zealand (2,195m)
                                                                                      after Auckland, Christchurch and Invercargill and is preparing a business

HAMILTON INTERNATIONAL AIRPORT                                                                         4
MASTER PLAN
HAMILTON MP REPORT KL 12/03/2009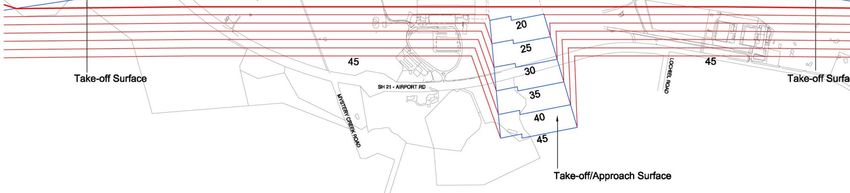
case to further extend the runway to position itself to target additional
international passenger and freight carriers from beyond the Tasman
market.
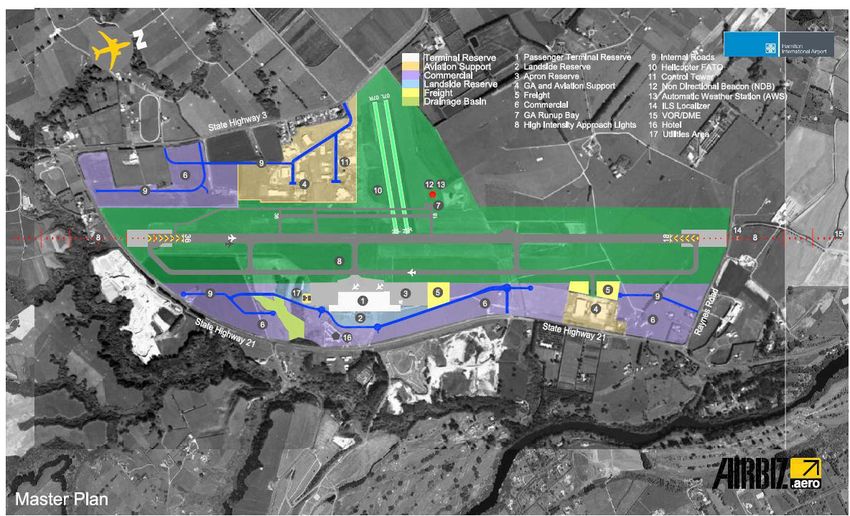
The existing airport layout, including key facilities, is illustrated on Figure 2-
2.
HAMILTON INTERNATIONAL AIRPORT 5
MASTER PLAN
HAMILTON MP REPORT KL 12/03/2009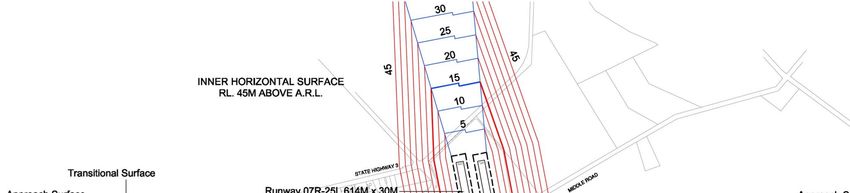
N

        FIGURE 2-2     CURRENT AIRPORT LAYOUT

HAMILTON INTERNATIONAL AIRPORT                  6
MASTER PLAN
HAMILTON MP REPORT KL 12/03/2009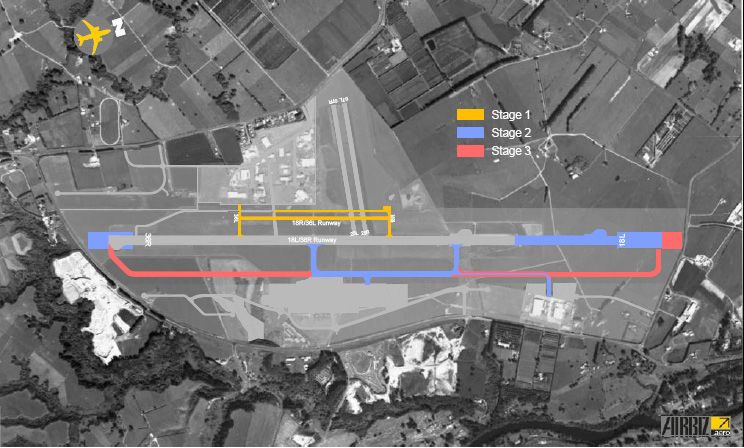
2.4. Role of the Airport
        HIA is the third busiest airport in New Zealand in terms of aircraft
        movements.
        The airport has moderate levels of scheduled domestic activity, limited to a
        degree by its proximity to Auckland Airport. The international component of
        HIA’s business is 100% Tasman which is viewed as a highly competitive
        and volatile market with a risk of negative growth. From April 2009, all
        International services will have been suspended by Air New Zealand from
        Hamilton to Australian East Coast ports; Sydney, Gold Coast and
        Brisbane. Services have previously operated to Melbourne and Fiji as well.
        HIA is the international airport closest to the North Island’s most popular
        attractions and HIA is encouraged by the success of secondary airports in
        Australia (Gold Coast, Avalon) in attracting Low Cost Carriers (LCC) to
        their ports.
        The following are the strategic intents of the airport as outlined in the 2008
        Annual Report:
        •    Deliver sustainable airport operations for the North Island
        •    Become a leading freight and distribution hub in the central North
             Island
        •    Grow national and international connectivity to the region
        •    Promote economic development in the region
        •    Develop capability according to customer and connectivity
             requirements
        •    Position and promote HIA as the preferred North Island regional airport
        •    Deliver value to customers
        •    Enable the Airport’s people to deliver
        •    Airport to be a significant, strategic infrastructure asset
        •    The Airport’s role to provide affordable, reliable and safe access to the
             air transport system; and to enhance economic development.
        In the course of the September 2007 workshop, HIA management
        summarised their goals for the airport as being to:
        •    Provide a successful and profitable commercial entity, and
        •    Become the second major airport for the Auckland/Waikato region.

HAMILTON INTERNATIONAL AIRPORT                                                           7
MASTER PLAN
HAMILTON MP REPORT KL 12/03/2009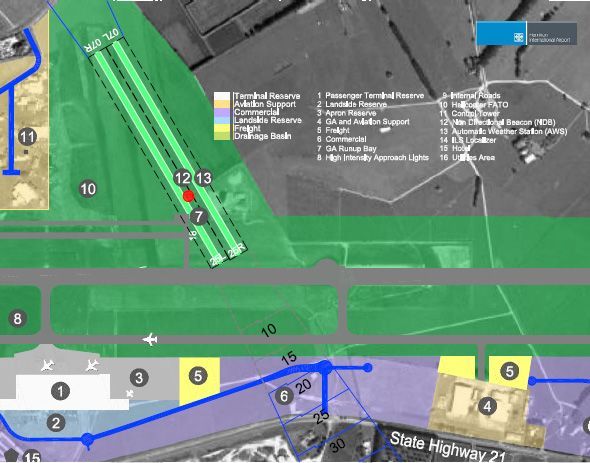
3.1. General

3 District Plans                         HIA is located solely within the Waipa District but its activities affect, and
                                         are affected by, the two adjacent neighbouring municipalities – Hamilton
                                         City and the Waikato District. Also, the airport’s Obstacle Limitation
                                         Surfaces (OLS) and Outer Control Boundary (OCB), based on the current
                                         runway system, extend over Hamilton City and Waikato District.
                                         Airport noise is a growing issue for areas adjacent to the airport as air
                                         traffic grows. To protect residential areas and other noise sensitive
                                         activities within the OCB from excessive airport noise, and to protect the
                                         airport’s future operations from reverse sensitivity complaints from
                                         surrounding areas, the rules of the various councils require that an
                                         acceptable internal noise environment is provided.
                                         The approach and departure surfaces as well as circling areas surrounding
                                         an airport are defined by OLS. OLS are conceptual (imaginary) surfaces
                                         associated with a runway system which identify the lower limits of the
                                         airspace surrounding an aerodrome above which objects become
                                         obstacles to aircraft operations. Figure 3-1 depicts the current OLS
                                         surrounding the airport.
                                         The District Plans of the three affected municipalities have all incorporated
                                         the height profile requirement for aerodromes as specified in New
                                         Zealand’s Civil Aviation Authority (CAA) Advisory Circulars (AC) 139-6.
                                         The District Plan provisions for the airport in Hamilton City and Waipa
                                         District are dated as they are based on information from the year 1992.
                                         The Waikato District Plan is more up to date as it was reviewed and
                                         amended in 2004.
                                   3.2. Waipa District Plan
                                   3.2.1. Noise
                                          The Waipa District Plan recognises that the airport is a major transport
                                          facility which has an important role in the economic and social well being of
                                          the District and Region. Its continuing operation could be jeopardised, or at
                                          least seriously affected, by further subdivision development in its environs
                                          if the effects of noise from aircraft operations become a nuisance to
                                          residents in the area.
                                         The Waipa District Plan restricts further residential development in the
                                         environs of the airport and discourages the erection of further dwellings
                                         and residential institutions whose occupants could be adversely affected
                                         by aircraft noise, along with other noise sensitive land uses. The Plan, at

HAMILTON INTERNATIONAL AIRPORT                            8
MASTER PLAN
HAMILTON MP REPORT KL 12/03/2009
the same time, also protects areas for airport use from development which In addition, the District Plan requires that new lots created within the OCB
could adversely affect the expansion and/or operation of the airport. An include a Consent Notice referring to airport noise and noise insulation
extract from the Waipa District Plan for areas surrounding the airport is requirements.
provided on Figure 3-2. The Horizontal, Conical, Main Runway Approach Surface at the northern
Future residential and noise sensitive development near the airport is end of the main runway and the Subsidiary Strip Approach Surface at the
controlled by an Airnoise Boundary and OCB prepared in accordance with eastern end extend into Waikato District. In order to ensure safe and
New Zealand Standard 6805:1992. unrestricted operation of aircraft using the airport, no building, object,
The District Plan also includes rules requiring the Airport to operate so as structure or tree is to extend through or above these surfaces. Refer to
to comply with the predicted noise levels. Figure 3-3.
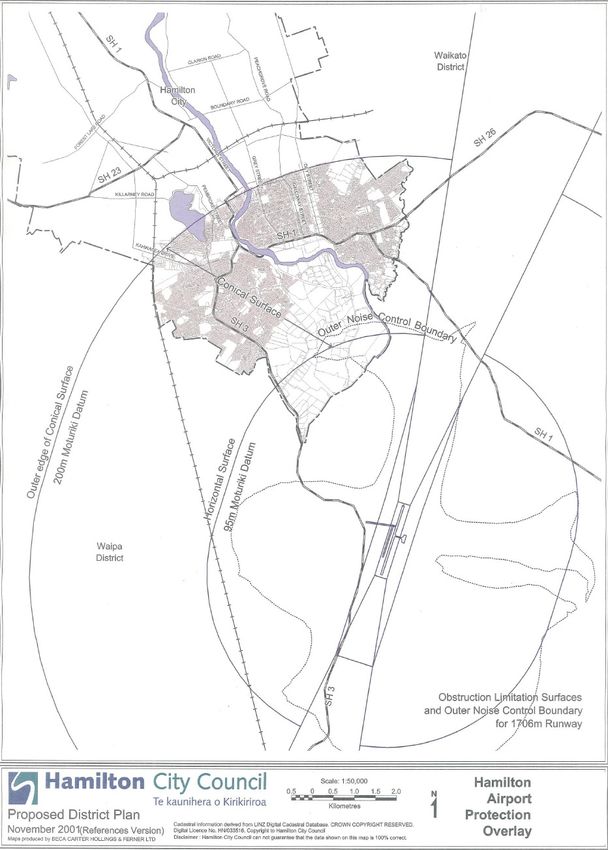
3.3. Waikato District Plan 3.4. Hamilton City District Plan
The Proposed Waikato District Plan (Appeals version 31 January 2007), According to Rule 2.6 of the ‘Hamilton Airport Protection Overlay’ in
states that the noise generated by aircraft movements associated with the Hamilton City’s Proposed District Plan, land which lies directly under the
airport is predicted to eventually reach levels between 55dBA (Ldn) and surfaces shown in Figure 3-4 and/or are adjacent to the airport have a
65dBA (Ldn). Those noise levels, which are identified in the Waikato building height restriction imposed along with controls on development are
District Plan, may be higher than the present levels of aircraft noise imposed within defined areas subject to aircraft noise.
affecting the land, as allowance has been made for predicted expansion of The desired output is to have uninterrupted air traffic approach paths
airport activities. across the City and exposure of residential activities to airport noise
The requirements for acoustic insulation of dwellings set out in the Waikato created by the airport limited to levels that protect amenity values
District Plan are intended to manage the effects that airport noise may
have on residential activity and reduce the potential for constraints on
airport development and activities.
Any dwelling house, or building listed below, which is erected on land
within the Airport Noise OCB shall be designed to be constructed to
incorporate appropriate acoustic insulation measures to ensure an internal
Ldn of 45dBA.
Following is the list of buildings not permitted within the Airport Noise OCB:
• Papakainga housing
• Homestays
• Multi unit development
• Comprehensive residential development
• Travellers accommodation
• Residential activity
• Hospitals .
• Schools.
HAMILTON INTERNATIONAL AIRPORT 9
MASTER PLAN
HAMILTON MP REPORT KL 12/03/2009FIGURE 3-1 HAMILTON AIRPORT OLS HAMILTON INTERNATIONAL AIRPORT 10 MASTER PLAN HAMILTON MP REPORT KL 12/03/2009
FIGURE 3-2           WAIPA DISTRICT PLAN - LAND DESIGNATION SURROUNDING HAMILTON AIRPORT

HAMILTON INTERNATIONAL AIRPORT                                                                     11
MASTER PLAN
HAMILTON MP REPORT KL 12/03/2009
FIGURE 3-3     WAIKATO DISTRICT PLAN – HIA OBSTACLE LIMITATION SURFACE   FIGURE 3-4   HIA OVERLAY MAP

HAMILTON INTERNATIONAL AIRPORT                                                                   12
MASTER PLAN
HAMILTON MP REPORT KL 12/03/2009
4.1. Historical Activity

4 Aviation Activity                4.1.1. Passenger Movements
                                          Historical annual passenger movements from 1998 to 2008 are shown on
                                          Figure 4-1. The total number of passenger movements has been

  and Forecasts
                                          increasing at an Average Annual Growth Rate (AAGR) of 4.7% over this
                                          period, with average annual growth in international and domestic
                                          passenger movements being 6.3% and 3.8%, respectively.

                                                                            500           International
                                                                                          Domestic
                                                                            450

                                                                            400

                                        Passenger Movements (000's)
                                                                            350

                                                                            300

                                                                            250

                                                                            200

                                                                            150

                                                                            100

                                                                              50

                                                                             -
                                                                                       1998    1999       2000      2001    2002    2003    2004    2005    2006    2007     2008

                                                                      International   59,727   64,529     93,801   106,958 116,350 113,816 110,910 107,842 122,514 103,016   86,694
                                                                      Domestic        206,384 210,468 213,164 225,382 224,070 254,506 285,706 304,520 311,444 321,694 336,320

                                                                                                                                    Year

                                                     FIGURE 4-1                         HISTORICAL PASSENGER MOVEMENTS
                                                     Source: HIA Annual Reports

                                                     While domestic passenger movements have been on a steady increase
                                                     since 1998, international passenger movements have dropped significantly
                                                     in 2007 and 2008 primarily due to Air New Zealand pulling out its Freedom
                                                     Air services completely from March 2008 and operating just as Air New
                                                     Zealand, resulting in a reduced number of Tasman services.
                                                     Reduced numbers of international services have been compounded even
                                                     further as Air New Zealand declared that from April 2009 it would be
                                                     suspending all its international services from Hamilton.

HAMILTON INTERNATIONAL AIRPORT                                                                 13
MASTER PLAN
HAMILTON MP REPORT KL 12/03/2009
4.1.2. Aircraft Movements The historical international aircraft movements (for 2008) and domestic
Historical recording of actual aircraft movements has been carried out by movements (for 1998 – 2008) were then estimated by applying estimates
Airways Corporation in the control tower. These movements are of average passengers to the historical annual passenger numbers.
categorised into Visual Flight Rules (VFR) and Instrument Flight Rules The advised and estimated domestic and international movements were
(IFR). It is reasonable to assume that VFR movements represent solely finally subtracted from the Airways IFR numbers to provide an estimate of
General Aviation (GA) aircraft movements. However, IFR movements historical GA IFR movements, which were combined with the VFR
represent the following three: numbers to give total GA movements. A breakdown of GA movements into
• Scheduled international movements IFR and VFR for calendar year 2008 was not available. Instead estimates
• Scheduled domestic movements, and have been made.
• GA movements conducted under IFR. These historical estimated aircraft movements are shown in Figure 4-2.
Although HIA does not hold complete records of numbers of international
160
and domestic scheduled movements, they have been able to provide International Scheduled
numbers of international movements for the years 1998 – 2006. 140 Domestic Scheduled
GA - IFR
Aircraft Movements (000's)
120
HIA was also able to source complete operational records for calendar GA - VFR
year 2004 and for 12 months June 2006 – May 2007. These data were 100
analysed to provide estimates of domestic aircraft movements for 2004/5 80
and 2006/7, as well as average seat and passenger loads (international 60
and domestic) for the same periods.
40
Further, HIA advised estimated total aircraft movements for 2008 of
20
148,000.
-
The average seat and passenger loads showed reasonable stability being: 1998 1999 2000 2001 2002 2003 2004 2005 2006 2007 2008
International Scheduled 667 666 1,117 1,155 1,136 1,109 1,165 1,233 1,138 905 889
Domestic Scheduled 8,255 8,419 8,527 9,015 8,963 10,180 11,824 12,181 12,869 12,094 12,429
GA - IFR 7,749 8,537 7,437 6,880 6,856 6,621 7,084 7,205 7,391 13,786 15,000
2004 2006/7 GA - VFR 36,314 43,314 36,012 34,151 33,694 39,981 38,888 65,953 76,974 112,098 119,682
International Year
Average seats 136 150
Average passengers 82 98 FIGURE 4-2 HISTORICAL AIRCRAFT MOVEMENTS
Load factor 61% 65%
The significant increase in movements in 2005 through to 2007 is primarily
Domestic due to the increase in VFR movements associated with pilot training
Average seats 37 38 activities by the CTC crew training centre.
Average passengers 25 25 GA VFR movements recorded the largest average growth of 12.7% per
annum from 1998 to 2008, with growth in international and domestic
Load factor 66% 67%1 aircraft movements from 1998 – 2008 averaging 2.9% and 4.2%,
1
Note – small differences due to rounding respectively. GA IFR movements recorded a growth of 6.8% over this
TABLE 4-1 2004 AND 2007 OPERATIONAL DATA COMPARISON
HAMILTON INTERNATIONAL AIRPORT 14
MASTER PLAN
HAMILTON MP REPORT KL 12/03/2009same period. It should be noted that total aircraft movements in 2005 • Mode of transport choices (air versus surface) and relative
represented an increase of 47% over 2004. convenience and cost.
4.1.3. Growth rate trends From these, the most relevant to air traffic at Hamilton Airport are
The AAGR for both passengers and aircraft movements has been considered to be:
calculated for the period 1998 to 2008. See Table 4-2. • HIA historical domestic passenger growth rate – 5.0%
• HIA historical international passenger growth rate – 3.8%
AAGR 1998 - 2008 • New Zealand GDP growth forecasts (NZ Treasury) – long term
approximately 3.0%, despite short term recessionary effects in
Passenger movements 2009/10
International 3.8% • Tourism Research Council NZ – Waikato Region Total Visits –
Domestic 5.0% approximately 1.4% (Long Term)
Total 4.7% • Statistics NZ – Population growth forecasts for Waikato Region –
approximately 0.5% (Long Term)
Aircraft movements
Historical air traffic growth rates as well as these trends in growth drivers
International Scheduled 2.9% are compared in the following Figure 4-3.
Domestic Scheduled 4.2%
GA - VFR 12.7% 20.0%
HLZ Dom. Historical Pax AAGR (1998– 2008) = 5.0%
GA - IFR 6.8% 15.0%
10.0% HLZ Int. Historical Pax AAGR (1998 – 2008) = 3.8%
TABLE 4-2 AAGR – PASSENGER AND AIRCRAFT MOVEMENTS 5.0%
Growth %
0.0%
4.1.4. Growth drivers
1998
1999
2000
2001
2002
2003
2004
2005
2006
2007
2008
2009
2010
2019
2020
2021
2022
2023
2024
2025
2026
2027
2028
-5.0%
The underlying growth drivers of aviation activity at airports include:
-10.0% Domestic
• Population growth -15.0%
International
GDP Forecast @ 3.1%
• Tourism (regional, national, world) -20.0% NZ Tourism Forecast @ 1.4%
Year
Growth in local industry, business
Population Forecast @ 0.5%
•
• Regional and national GDP FIGURE 4-3 GROWTH RATES
• Regional tourism marketing
4.2. Forecast Growth Rates
• Local Council planning initiatives
4.2.1. Domestic Passenger Movements
• Airline marketing From Figure 4-3 it can be seen that most indicators of growth for the region
• Airline competition (GDP and population) are below 3%, while historical passenger growth
rates have been higher at between 3% and 5%. However, closer
• Airline choices of fleet, aircraft size, schedule and frequency
examination of the year to year passenger growth rates shows that the
historical trends are strongly affected (upwards) by two exceptional years
HAMILTON INTERNATIONAL AIRPORT 15
MASTER PLAN
HAMILTON MP REPORT KL 12/03/2009of growth in 2003 and 2004 which correspond to a period of heightened moderated for the second 12 year period of the master plan. For low and
competition from (now defunct) Origin Pacific and strong activity growth as high passenger movement projections, growth rates of 1.0% and 6.0%,
Air New Zealand lowered fares and introduced their simpler Domestic respectively, were also deemed suitable. Projected annual growth rates for
Express product. international passenger movements for the planning horizon are provided
It was agreed with HIA that these strong historical passenger growth rates in Table 4-4.
would be too optimistic for future master planning and therefore moderated
growth rates would be adopted, more in line with underlying population and 2009 – 2017 2018 – 2030
economic trends.
International passengers – High 7.0% 4.0%
The growth rates adopted for the Master Plan are shown in Table 4-3. High
International passengers – Median 4.0% 2.5%
and Low rates have been adopted to indicate realistic upper and lower
bound forecasts and growth rates have been further moderated in the International Passengers – Low 1.0% 1.0%
second 12 year period of the Master Plan to avoid unrealistic compounding
growth effects. TABLE 4-4 ADOPTED GROWTH RATES – INTERNATIONAL PASSENGERS
4.3. Passenger Demand Projections
2009 – 2017 2018 – 2030 The adopted growth rates for master planning have been applied to current
activity levels (2008 for domestic and 2007 for international) to generate
Domestic passengers – High 4.0% 2.5% demand projections for domestic and international passenger movements,
Domestic passengers – Median 3.0% 2.0% shown in Figures 4-4 and 4-5.
Domestic Passengers – Low 2.0% 1.5% Domestic Passengers
TABLE 4-3 ADOPTED GROWTH RATES – DOMESTIC PASSENGERS
Historical
4.2.2. International Passenger Movements 800,000 High
Despite the recent decline in international air traffic, HIA is currently 700,000 Median
pursuing an aggressive programme of new airline marketing and route 600,000 Low
Passengers
development, aimed at reversing the recent downward trend. 500,000
400,000
It is HIA’s view that the recent downturn in international traffic is not solely
300,000
due to a structural change in the market but rather a result of current airline
200,000
policies which encourage more traffic to flow through Auckland Airport. Historical Forecast
100,000
Therefore the low 2008 historical level or the near-future nil traffic level are
-
not considered to be satisfactory starting points to apply long-term growth
1998
2000
2002
2004
2006
2008
2010
2012
2014
2016
2018
2020
2022
2024
2026
2028
2030
rates. Instead, the 2007 level of international passengers has been
adopted as the base for forecasting as it is higher than the 2008 number, Year
although lower than the 2006 record peak.
Consultation with HIA concluded that based on the average growth rate
trend since 1998, an annual growth rate of 4.0% would be appropriate for
the median forecast for the first 8 years of the Master Plan and as with the FIGURE 4-4 DEMAND PROJECTIONS – DOMESTIC PASSENGERS
domestic passenger growth rates, the international rates are further
HAMILTON INTERNATIONAL AIRPORT 16
MASTER PLAN
HAMILTON MP REPORT KL 12/03/2009International Passengers Historical Forecast
2004 2006/7 2010 2015 2020 2025 2030
Historical
350,000
High Domestic
300,000 Median
Low Average seats 37 38 40 45 50 55 60
250,000
Passengers
200,000
Average passengers 24 24 28 32 35 39 42
150,000 Load factor 65% 64%1 70% 70% 70% 70% 70%
100,000 1
Historical Forecast Note – small differences due to rounding
50,000
TABLE 4-5 FORECAST – SCHEDULED AIRCRAFT
-
Applying these aircraft size/passenger forecasts to the annual passenger
1998
2000
2002
2004
2006
2008
2010
2012
2014
2016
2018
2020
2022
2024
2026
2028
2030
projections then generated future international and domestic aircraft
Year movement forecasts. These are shown in Figures 4-6 and 4-7, and Tables
4-6 and 4-7.
Domestic Aircraft Movements
FIGURE 4-5 DEMAND PROJECTIONS – INTERNATIONAL PASSENGERS
18,000 Historical
4.4. Aircraft Movement Projections High
16,000
4.4.1. Scheduled Aircraft Projections Median
International and domestic aircraft movements have been forecast by 14,000 Low
estimating the future average aircraft sizes for international and domestic 12,000
Movements
types expected to operate at Hamilton. In similar way, a view of future load 10,000
factors has been taken based on historical load factors.
8,000
The results are shown in Table 4-5. 6,000
4,000
Historical Forecast Historic Forecast
2,000
-
2004 2006/7 2010 2015 2020 2025 2030
1998
2000
2002
2004
2006
2008
2010
2012
2014
2016
2018
2020
2022
2024
2026
2028
2030
International Year
Average seats 134 132 150 164 180 180 180
Average passengers 95 108 105 115 126 126 126
FIGURE 4-6 DEMAND PROJECTIONS – DOMESTIC AIRCRAFT MOVEMENTS
Load factor 71% 82% 70% 70% 70% 70% 70%
HAMILTON INTERNATIONAL AIRPORT 17
MASTER PLAN
HAMILTON MP REPORT KL 12/03/20094.4.2. GA Aircraft Projections
2010 2015 2020 2025 2030 Growth rates for GA were discussed and agreed with HIA during the
High consultation process. GA operators were also canvassed for their views
13,400 14,500 15,200 15,600 16,200
about growth prospects. Growth rates for 2009 and 2010 have been set at
Median 13,100 13,500 13,700 13,700 13,900 a strong level to represent the current real surge in GA traffic which is
Low 12,900 12,600 12,300 12,100 11,900 primarily due to CTC Aviation’s growth.
However, while these growth rates taper off over consecutive years, they
TABLE 4-6 DEMAND PROJECTIONS – DOMESTIC AIRCRAFT MOVEMENTS are still reasonably strong growth rates when compared with normal
recreational GA growth experienced in New Zealand which is at a rate of
1-2% per annum. See Table 4-8.
International Aircraft Movements
2009 – 2010 2011 – 2020 2021 – 2030
Historical
3,000 High GA – High 10.0% 5.0% 3.0%
2,500
Median GA– Median 8.0% 4.0% 2.0%
Low
GA – Low 6.0% 3.0% 1.0%
2,000
Movements
TABLE 4-8 FORECAST – SCHEDULED AIRCRAFT
1,500
These growth rates were then applied to the 2008 base of total GA
1,000
movements to derive the GA movement projections. These are shown in
500 Figure 4-8 and Table 4-9.
Historic Forecast
-
1998
2000
2002
2004
2006
2008
2010
2012
2014
2016
2018
2020
2022
2024
2026
2028
2030
2010 2015 2020 2025 2030
Year High 163,000 208,000 265,000 307,000 355,000
Median 158,000 192,000 234,000 259,000 285,000
FIGURE 4-7 DEMAND PROJECTIONS – INTERNATIONAL AIRCRAFT MOVEMENTS Low 152,000 177,000 205,000 215,000 225,000
TABLE 4-9 DEMAND PROJECTIONS – GA AIRCRAFT MOVEMENTS
2010 2015 2020 2025 2030
High 1,150 1,470 1,730 2,100 2,560
Median 1,090 1,210 1,290 1,450 1,650
Low 1,030 980 940 980 1,020
TABLE 4-7 DEMAND PROJECTIONS - INTERNATIONAL AIRCRAFT MOVEMENTS
HAMILTON INTERNATIONAL AIRPORT 18
MASTER PLAN
HAMILTON MP REPORT KL 12/03/2009General Aviation Aircraft Movements 2010 2015 2020 2025 2030
400,000 Historical Domestic 12,900 12,600 12,300 12,100 11,900
High
350,000 GA 152,000 177,000 205,000 215,000 225,000
Median
300,000 Low Total 165,930 190,580 218,240 228,080 237,920
250,000
Movements
200,000 TABLE 4-10 TOTAL AIRCRAFT MOVEMENTS
150,000
100,000 4.4.4. Potential Long Term Restraints on Growth
50,000 Historic Forecast The forecast level of aircraft movements shown in Table 4-10 is very high
- in the mid to later stages of the master planning horizon, exceeding activity
levels at any New Zealand airport. By comparison, the busiest airport is
1998
2000
2002
2004
2006
2008
2010
2012
2014
2016
2018
2020
2022
2024
2026
2028
2030
currently Ardmore Airport with approximately 200,000 annual movements.
Year
This high level of forecast movements is driven primarily by the GA
FIGURE 4-8 DEMAND PROJECTIONS – GA AIRCRAFT MOVEMENTS
component of traffic, projected at what are essentially unconstrained
growth rates, albeit at moderate rates in the long term.
4.4.3. Total Aircraft Movements The implications of this possible level of growth require further study by
HIA in the near future to assess:
• Whether HIA wishes to eventually be operating such a major GA
2010 2015 2020 2025 2030 facility or whether its primary focus should be on passenger and freight
High operations.
International • Whether the capacity of the system of runways and taxiways is
1,150 1,470 1,730 2,100 2,560
capable of handling that level of future traffic.
Domestic 13,400 14,500 15,200 15,600 16,200
• Whether the surrounding airspace is capable of safely handling that
GA 163,000 208,000 265,000 307,000 355,000 level of future traffic, particularly considering the diverse mix of
Total 177,550 223,970 281,930 324,700 373,760 large/fast and small/slow aircraft.
Median • Whether users of the airport themselves want that level of activity and
whether the major contributors to that level (GA) would be capable of
International 1,090 1,210 1,290 1,450 1,650 meeting the costs of the necessary infrastructure.
Domestic 13,100 13,500 13,700 13,700 13,900 • Whether the surrounding community would be comfortable with the
GA 158,000 192,000 234,000 259,000 285,000 airport operatives with that level of activity.
Total 172,190 206,710 248,990 274,150 300,550 A possible outcome of such further study by HIA might be a decision to
Low progressively impose restraints on growth on some components of airport
activity, targeting an acceptable long-term threshold and mix of traffic.
International 1,030 980 940 980 1,020
HAMILTON INTERNATIONAL AIRPORT 19
MASTER PLAN
HAMILTON MP REPORT KL 12/03/2009This Master Plan does not yet include any outcomes of an assessment of 4.5.1. Busy Hour Growth Rates
desirable traffic levels or the application of possible future restraints on The growth in annual aircraft movements by 2030 has been translated into
growth. average annual growth rates over the period from 2008 as shown in Table
4.5. Busy Hour Aircraft Demand 4-11. Busy hour growth rates can be expected to be generally in line with
the overall average annual growth rates for each category of aircraft, with
HIA does not formally hold or record information on busy day and busy
some reduction to taken into account for peak spreading.
hour movements and this information is not recorded in a comprehensive
way by Airways in the Control Tower. Therefore the average busy hour growth rates adopted for the period to
2030 is as shown in Table 4-12.
However, sample information on HIA’s busy day and hour runway
movements (arrivals and departures) was provided by the manager of the
Control Tower at Hamilton who surveyed a representative busy day Adopted
(09/07/2008). The results of the survey are shown in Table 4-11. Annual Annual Average
Average Busy
Actual Forecast % Change Annual
Runway usage often depends on the aircraft types using it and why they Hour Growth
(2008) 2030 Growth Rate
are using it. Hence in terms of busy hour, because circuit training are Rate
recorded separate from arrivals and departures, two busy hours are shown
in Table 4-11 as aircraft doing circuits “occupy” the runway for less time International Jets 800 1,800 125% 3.8% 3.0%
than that required for arrivals and departures. Domestic Jets 300 1,200 300% 6.5% 3.0%
Domestic Turboprops 11,200 12,700 13% 0.6% 0.5%
Busy Hour – Busy Hour – Circuit
General Aviation 135,700 377,200 178% 4.8% 3.0%
Busy Day Arrivals and Traffic (08:30 – 09:30)
(09/07/2008) Departures Total 148,000 392,900 165% 4.5% -
(09:45 – 10:45)
TABLE 4-12 BUSY HOUR PROJECTIONS
International Jets 1 0 0
4.5.2. Busy Hour Aircraft Movement Projections
Domestic Jets 0 0 0 The adopted average busy hour growth rates from Table 4-12 have been
applied to the current busy hour activity levels from Table 4-11 to generate
Domestic Turboprops 30 4 0 projections for busy hour aircraft movements in 2020 and 2030.
GA Arrivals and It should also be noted that intensive circuit activity in future, based on
171 33 1
Departures current levels, can only occur in periods when little or no scheduled airline
GA Helicopters 10 0 1 arrivals or departures is occurring.
The projections for the busy hour in which the majority of scheduled
GA Circuits (Touch and
374 2 58 activity is occurring is shown in Table 4-13 while projections for the busy
Go)
hour in which the majority of circuit training occurs is shown in Table 4-14.
Total 586 39 60
TABLE 4-11 BUSY HOUR GA AIRCRAFT MOVEMENTS
HAMILTON INTERNATIONAL AIRPORT 20
MASTER PLAN
HAMILTON MP REPORT KL 12/03/20094.6. Busy Hour Passenger Demand
Adopted As part of the work in 2007 to identify the core land required for aviation
Current Busy
Average Projected Busy Hour purposes so that the balance of peripheral land could be allocated for non-
Hour
Busy Hour Aircraft Movements aviation commercial purposes (including the Titanium Park Joint Venture),
Movements
Growth Rate HIA requested that the core should include sufficient land for long term
terminal precinct that would provide for balanced and flexible development
2020 2030 for growth to approximately 2 million passengers per annum.
International Jets 3.0% 0 1 2 The terminal precinct provided in the land use definition phase
incorporated land for aprons, terminal building, forecourt, car parking,
Domestic Jets 3.0% 0 2 4
taxis, coaches and rental cars, circulation, as well as aviation support
Domestic Turboprops 0.5% 4 4 4 functions. The area provided in the terminal precinct comprises 15.84 ha.
GA Arrivals and Departures 3.0% 33 47 56 It is considered that this provision is satisfactory for Master Planning to
GA Helicopters 3.0% 0 1 2 2030 and that further analysis of busy hour passenger demand for the
purposes of sizing terminal area facilities is not warranted at this stage until
GA Circuits (Touch and Go) 3.0% 2 3 3 a future terminal development project might arise.
Total - 39 64 83
TABLE 4-13 BUSY HOUR PROJECTIONS – MAJORITY SCHEDULED ACTIVITY
Adopted
Current Busy
Average Projected Busy Hour
Hour
Busy Hour Aircraft Movements
Movements
Growth Rate
2020 2030
International Jets 3.0% 0 0 0
Domestic Jets 3.0% 0 0 0
Domestic Turboprops 0.5% 0 0 0
GA Arrivals and Departures 3.0% 1 1 2
GA Helicopters 3.0% 1 1 2
GA Circuits (Touch and Go) 3.0% 58 83 99
Total - 60 85 103
TABLE 4-14 BUSY HOUR PROJECTIONS – MAJORITY CIRCUIT ACTIVITY
HAMILTON INTERNATIONAL AIRPORT 21
MASTER PLAN
HAMILTON MP REPORT KL 12/03/20095.1. Design aircraft
5 Planning The largest aircraft that currently operate regularly at HIA are the Code C
A320-200 (Air New Zealand) along with occasional military operations by
Hercules C130 and P3 Orion, which are both Code D aircraft.
Parameters
HIA’s business goals clearly envisage long haul passenger and freight
operations involving wide-body Code E aircraft such as B747-400, B777
and B787 types.
The critical planning dimensions for current and future aircraft types
expected to operate at HIA are:
Aircraft Code Length (m) Wingspan (m)
A320-200 C 37.57 33.91
B737-300 C 33.40 28.88
B737-800 C 39.48 35.80
B787-9 E 62.81 60.10
A330-300 E 63.69 60.30
B777-200 E 63.73 60.95
B777-200LR E 63.73 64.80
B777-300ER E 73.86 64.80
B747-400 E 70.67 64.94
Cessna Caravan B 11.50 15.90
TABLE 5-1 DESIGN AIRCRAFT DIMENSIONS
From the above aircraft types, the design aircraft code adopted for Master
Planning is Code E.
5.2. Airfield parameters
To position taxiways relative to runways, clearances prescribed by NZCAA
must be used. Different sized aircraft, aircraft codes B, C and E – E being
the design aircraft in this instance – require different clearance dimensions.
See Table 5-2.
The intent is to protect adequate clearances for taxiways for both Code B
(on the western side) and Code E (on the eastern side) so that future
HAMILTON INTERNATIONAL AIRPORT 22
MASTER PLAN
HAMILTON MP REPORT KL 12/03/2009development choices remain unconstrained by actions or developments There are no requirements for RESAs on the parallel Code B Runway
that are currently underway. 18/36 and the two grass cross runways.
5.5. Runway Protection Zone (RPZ)
Code B Code E To protect the public from the risk of an incident of an aircraft
Runway – runway centreline1 120.0m n.a. undershooting or overshooting a runway, many national authorities define
a zone beyond the runway end which enhances the protection of people
Runway – taxiway centreline 52.0m 182.5m2 and property on the ground beyond the end of a runway.
Taxiway – obstacle 21.5m 47.5m Currently there is no regulation for RPZs in New Zealand. The Hamilton
Runway width 23.0m 45.0m Master Plan has adopted the guidelines of the United States Federal
Taxiway width 10.5m 23.0m Aviation Administration (FAA) Runway Protection Zone (RPZ)1 to enhance
the protection of people and property on the ground.
1
2
For independent dual runway operations by Code A aircraft on both runways An RPZ is proposed at each runway end. Each RPZ is trapezoidal in
For instrument runway shape, 750m long and is centred around the extended runway centreline..
TABLE 5-2 RUNWAY AND TAXIWAY CLEARANCES RPZ dimensions are a function of the type of aircraft and approach visibility
minimum associated with the end of a runway. See Figure 5-1
5.3. Runway Strip Width
The Master Plan provides for a 300m wide runway strip for Runway 18/36, Because the RPZ at each end of the runway lie substantially on land
meeting the requirements for an instrument runway. outside the boundary of the Airport, it is recommended that HIA works with
Waipa District Council to institute appropriate land use controls within the
5.4. Runway End Safety Area (RESA) RPZ at each end of the runway to achieve the following outcomes.
Runway End Safety Areas (RESA) are cleared and graded areas
extending from the end of a runway strip to reduce the risk of damage to • Land uses recommended to be permitted under the RPZ should be
an aeroplane in the event of a runway undershoot or overrun. activities that do not attract the assembly of a large number of people,
such as:
NZCAA has invoked a rule change making it mandatory for airports
operating runways for regular air transport services to provide a RESA — Golf courses (not club houses)
extending at least 240m from the end of the runway strip, if that is — Agricultural operations (other than forestry or livestock)
practicable. — Plant and machinery buildings
The requirement to provide a RESA in Hamilton’s case is 5 years from the — Low occupancy warehousing
date of the new rule, approximately 2011. The NZCAA requirements are
detailed below: — Car parking.
• A length of the greatest distance that is practicable between the • Land uses recommended to be discouraged, avoided or prohibited
minimum 90m and 240m should be activities that may attract the assembly of large number of
people or that have the potential to be highly hazardous in the event of
• A width of at least twice the width of the runway an incident involving an aircraft, such as:
• Required for instrument runways — Residences and public places of assembly (churches, schools,
• Required for any new runway extension or upgrade hospitals, office buildings, shopping malls etc.)
• Required for international airports
1
The Master Plan provides for 240m RESAs. FAA – Airport Design (AC 150/5300-13)
HAMILTON INTERNATIONAL AIRPORT 23
MASTER PLAN
HAMILTON MP REPORT KL 12/03/2009— Playgrounds, sports grounds, e) Evaluation method.
— Fuel storage facilities The Pavement Classification Number (PCN) reported shall indicate that an
aircraft with an Aircraft Classification Number (ACN) equal to or less than
the reported PCN can operate on the pavement subject to any limitation on
the tyre pressure, or aircraft all-up mass for specified aircraft types.”
The Runway 18/36 pavement strength is currently declared to be PCN 45
F/C/X/T (Flexible, low sub-grade bearing strength, tyre pressure, from
engineering study).
Indicative ACN for the different types of aircraft that could potentially serve
Hamilton Airport are as follows:
- B737-300 41
- A320-200 47
- B737-800 51
- B767-300 72
- A330 70-79
- B777-200ER 90-97
FIGURE 5-1 RUNWAY PROTECTION ZONE DIMENSIONS
5.6. Pavement Strength
The following general notes provide an overview of the Runway 18/36
pavement and its ability to accommodate new (heavier) aircraft types.
ACN-PCN System
The Aircraft Classification Number/Pavement Classification Number
(ACN/PCN) system of classification of pavements load carrying capacity is
a procedure whereby the loading characteristics of an aircraft are
compared with the supporting capacity of the pavement.
Annex 14 specifies that “the bearing strength of a pavement intended for
aircraft of mass greater than 5,700 kg shall be made available using the
ACN/PCN method by reporting all of the following information:
a) The pavement classification number (PCN)
b) Pavement type for ACN/PCN determination
c) Subgrade strength category
d) Maximum allowable tyre pressure category or maximum
allowable tyre pressure value
HAMILTON INTERNATIONAL AIRPORT 24
MASTER PLAN
HAMILTON MP REPORT KL 12/03/20096.1. Main Runway 18/36
6 Aviation facility Astral Aviation was engaged by HIA to assess options for extensions to the
main runway both as an interim step and for the maximum possible
development on the current available land to facilitate HIA’s business goals
requirements
of establishing sustainable long haul international passenger and freight
operations.
Two options were developed with runways sufficiently long for MTOW
operations by larger Code E aircraft types.
Option 1, which is the maximum possible runway development on the
current site, provides for an extension of the current 2195m pavement by
789m to achieve a total sealed pavement length of 2984m, providing a
runway of nominal 2796m length (LDA = 2608m; TORA/ASDA = 2796m).
Option 2 is an initial runway development which provides for an extension
of the current 2195m pavement by 493m to achieve total sealed pavement
length of 2688m, providing a runway of nominal 2500m length (LDA =
2500m; TORA/ASDA = 2688m).
Both options provide for 240m RESAs.
The Astral configurations are shown in Figures 6-3 and 6-4.
6.2. Code B Runway 18/36
The Master Plan provides for reconstructing this secondary runway at an
increased separation of 120.0m from its current separation of 107.5m from
the main runway to achieve, in future, independent simultaneous dual
runway operations for small aircraft. Independent operations are not
currently possible as the current separation is insufficient.
HIA may choose to seal the secondary runway when it is re-aligned if the
business case for doing so exists.
6.3. Grass Cross Runways
The two grass cross runways are presently aligned so the approach and
takeoff surfaces infringe on an area protected as future apron reserve.
See Figure 6-1. This has no immediate effect as Code E aircraft are not
yet operating, nor has the apron been expanded to facilitate parking.
However, this alignment also means the approach and take off surfaces
extend over an area to the east of the proposed Code E apron planned for
commercial development as part of Titanium Park.
HAMILTON INTERNATIONAL AIRPORT 25
MASTER PLAN
HAMILTON MP REPORT KL 12/03/2009There exists at Hamilton sufficient land resource to realign the grass cross
runways such that 07L/25R runs parallel to the fence line on the northwest
perimeter. This re-alignment would direct the eastern approach and take
off surfaces over land currently identified for the main Titanium Park
access road and intersection with State Highway 21. However, the
Titanium Park plan also shows land adjacent to the access road being
available for commercial building developments and therefore it is not clear
at this stage that a possible re-alignment would necessarily avoid flight
paths over new developments.
An additional benefit from re-alignment would, however, be obtained
whereby an area of land south of the re-aligned runways becomes
available for possible lease and further commercial development.
The NDB mast and related equipment is currently in the path of the
possible re-alignment. This equipment would need to be relocated to
another section of the airfield. This possible re-aligned new runway layout
is illustrated in Figure 6-2.
At this stage until there has been further study of the benefits of re-
alignment, the Master Plan retains the cross runways in the present
configuration.
FIGURE 6-1 GRASS CROSS RUNWAYS – CURRENT ALIGNMENT
To keep the cross runways in their current alignment and allow for future
Code E apron parking, the runway lengths may need to be adjusted such
that the approach and take off surfaces do not infringe clearances.
Further measurement will be required to ensure precise location of
clearance lines with respect to formally declared runway thresholds and
the future location of aircraft parking to the north of the passenger terminal.
Another potential issue arises over the desirability of ab-initio pilots
undertaking take off and landing phases of their training directly over new
building developments. While technically this may be feasible and NZCAA
regulations do not specifically prohibit such activities, international best
practice does not reflect this as positive for airport planning.
Flight training has inherent risks associated with manoeuvres by new
pilots. Generally, pilot training is carried out at airports and in airspace
where obstructions and conflicting traffic are minimised.
HAMILTON INTERNATIONAL AIRPORT 26
MASTER PLAN
HAMILTON MP REPORT KL 12/03/2009and flexible development for growth to approximately 2 million passengers
per annum.
The terminal precinct provided in the land use definition phase
incorporates land for aprons, terminal building, forecourt, car parking, taxis,
coaches and rental cars, circulation, as well as aviation support functions.
The area provided in the terminal precinct comprises 15.84 ha.
6.6. Staging
Figure 6-5 shows indicative staging of developments of the runways,
taxiways and aprons.
Stage 1
This stage has a reconstructed Code B Runway 18/36, parallel to the main
runway, with its own full length Code B taxiway to the west of the runway.
This taxiway also has two additional stub accesses to the main Runway
18/36 to provide for dual runway operations.
Stage 2
This stage also provides for a partial parallel taxiway that could be built
initially as a Code C taxiway and later widened for Code E. This taxiway
would provide possible linkage to the cargo facilities adjacent to the
terminal area and in the north adjacent to PAC.
This partial taxiway would have two stubs providing access to the main
runway. The distance from each stub access point on the runway to the
end of the main runway on either side is about 1500m. This distance
FIGURE 6-2 GRASS CROSS RUNWAYS – POSSIBLE RE-ALIGNMENT should enable all turboprops and most Code C jets to land from each end
of the runway and turn off at the stubs and for most turboprops to take-off
6.4. Taxiways from the stub access points, removing the need for most aircraft to turn
Code B Taxiway and taxi on the main runway, thereby enhancing the capacity of the
It is recommended that the existing parallel Code B taxiway, to west of the runway.
main runway, is extended parallel to the full length of the reconstructed
Stage 3
Code B runway in order to maximise capacity available from this runway.
This stage shows the maximum runway length (total sealed pavement of
Code E Taxiway 2984m) with full length parallel Code E taxiway.
It is recommended to protect land parallel to the future full length of the
main runway for a future Code E taxiway. It is expected that the parallel 6.7. Aerodrome Rescue and Fire Fighting Services (ARFFS)
taxiway would be constructed in stages as described in Section 6-6. The current location for the ARFFS facility is on the northern side of the
passenger terminal.
6.5. Passenger Terminal Area
Previous apron planning by HIA to accommodate possible Code E aircraft
As mentioned in Section 4-6, HIA requested for core land to be identified in
to the north of the passenger terminal and possible terminal expansion
order to build a long term terminal precinct that would provide for balanced
northwards did not specifically address the feasibility of retaining the
ARFFS on its current location.
HAMILTON INTERNATIONAL AIRPORT 27
MASTER PLAN
HAMILTON MP REPORT KL 12/03/2009Although there was no specific conflict identified during this apron planning intersection of the Code B runway and crosswind runways for access
exercise, the Master Plan retains the same current ARFFS location but directly from the GA precinct.
notes that long term terminal planning might need to address its
6.11. Aircraft Re-fuelling
location/relocation.
The current fuel storage and tanker filling area located to the south of the
6.8. Control Tower passenger terminal precinct is appropriate and should be retained,
The siting of the control tower is aimed at providing views for the providing for both landside and airside access.
controllers that incorporate the following key elements:
6.12. Ground Support Equipment (GSE)
• Adequate visibility of all of the manoeuvring area and airspace under Sufficient area has been provided in the 16Ha terminal precinct to cater for
the controller’s area of responsibility, including runway approach lights, the storage and staging of GSE.
graded areas at least 300m from the runway threshold and take-off
climb surfaces
6.13. Navigational Aids
The existing Non-Directional Beacon (NDB) is located north of the
• A view of all runway ends and fire fighting routes crosswind runways and should be retained at that location until a time in
• Visual resolution of all aerodrome movement areas with the exception the future when its role is possibly considered to be redundant.
of the passenger and cargo terminal aprons and taxi lanes which are The VHF Omnidirectional Range (VOR) is located on the main runway
supervised by HIA apron control centreline, at a distance of approximately 750m north from Runway 18
• Minimised glare from the sun pavement end, off airport on a leased site.
• The ability to detect the movement of an aircraft commencing its take- This location is appropriate for the long term Master Plan.
off run within an appropriate time frame (recommended to be four 6.14. Instrument Landing System
seconds, with an upper limit of five seconds) The Master Plan provides for the possible installation of an Instrument
• Lines of sight that are not impaired by external light sources. Landing System (ILS) and High Intensity Approach Lights (HIAL) at each
The current location of the Control Tower, in the west GA and Aviation end of the runway, subject to a satisfactory business case. However,
Support precinct is appropriate for the long term development of the landing approaches from the north on to Runway 18 represent the majority
airport. However, strict control will be required on the locations and heights of low visibility operations and it is possible that the business case may
of new buildings that may be constructed between the Tower and the show that an ILS would likely only be required at this one end.
airfield so as to not obstruct sightlines. The Master Plan also identifies the need to relocate the VOR from its
current position to a new position north of Raynes Road, approximately
6.9. General Aviation (GA)
750m from the sealed end of Runway 18 directly on the centre line of the
The land use definition undertaken to delineate between the core aviation
runway.
and commercial activities has confirmed the precinct for GA and aviation
support activities (including aircraft assembly and maintenance) to the ICAO Annex 14 recommends that 2 , where physically practicable, a
west of the main runway. The bulk of current GA facilities, including flying precision approach category 1 runway should be provided with a precision
training, are in this area which also provides capacity for expanded approach category 1 lighting system and a precision approach category II
activities. or III runway should be provided with a precision approach category II or III
lighting system.
6.10. Helicopters
An existing helicopter Final Approach and Take-off point (FATO) is located
immediately to the west of the passenger terminal area and should be
retained. The Master Plan indicates a second FATO located near the 2
Volume 1, Clause 5.3.4.1
HAMILTON INTERNATIONAL AIRPORT 28
MASTER PLAN
HAMILTON MP REPORT KL 12/03/2009ICAO Annex 14 further states that a precision approach lighting system i.e.
HIAL, shall, wherever possible, extend over 900m from the threshold. The
length of 900 m is based on providing guidance for operations under
category I, II and III conditions. Reduced lengths may support category II
and III operations but may impose limitations on category I operations.
An approach lighting system could also enable the decision height of an
ILS precision approach to be reduced below 250ft where no obstacles are
controlling the decision height. Prior to any decision to implement
approach lighting a business case would be required to quantify the
increase in airport operational availability that would be achieved.
The length of 900m is based on providing guidance for operations under
category I, II and III conditions. Reduced lengths may support category II
and III operations but may impose limitations on category I operations.
An area extending approximately 1000m long from the runway threshold
and 120m wide obstacle free area centred about the extended centre line
of the runway should to be provided for the HIAL. This would include an
additional distance of approximately 100m beyond the outermost light to
prevent its screening.
Because this area for the HIAL would lie substantially on land outside the
boundary of the Airport, it is recommended that HIA works with Waipa
District Council and Airways (the likely owner/operators of future HIAL) to
institute appropriate control or designation over the HIAL reserve to
provide for security for the lights and vehicle access for maintenance.
6.15. Master Plan
The final Master Plan for 2030 is shown at Figure 6-6 and incorporates the
Stage 3 airfield development with the non-aviation commercial land use
definition for areas peripheral to the aviation one.
HAMILTON INTERNATIONAL AIRPORT 29
MASTER PLAN
HAMILTON MP REPORT KL 12/03/2009You can also read