Has Omicron Changed the Evolution of the Pandemic? - XSL FO
←
→
Page content transcription
If your browser does not render page correctly, please read the page content below
JMIR PUBLIC HEALTH AND SURVEILLANCE                                                                                                         Lundberg et al

     Original Paper

     Has Omicron Changed the Evolution of the Pandemic?

     Alexander L Lundberg1,2, MSc, PhD; Ramon Lorenzo-Redondo3,4, PhD; Egon A Ozer3,4, MD, PhD; Claudia A
     Hawkins3,5, MD, MPH; Judd F Hultquist3,4, PhD; Sarah B Welch1,2, MPH; PV Vara Prasad6, MSc, PhD; James F
     Oehmke2, PhD; Chad J Achenbach3,7, MD, MPH; Robert L Murphy3,7, MD; Janine I White1, MA; Robert J Havey7,8,
     MD; Lori Ann Post1,2, PhD
     1
      Buehler Center for Health Policy and Economics, Robert J. Havey, MD Institute for Global Health, Northwestern University, Chicago, IL, United
     States
     2
      Department of Emergency Medicine, Feinberg School of Medicine, Northwestern University, Chicago, IL, United States
     3
      Department of Medicine, Division of Infectious Diseases, Feinberg School of Medicine, Northwestern University, Chicago, IL, United States
     4
      Center for Pathogen Genomics and Microbial Evolution, Robert J. Havey, MD Institute for Global Health, Northwestern University, Chicago, IL,
     United States
     5
      Center for Global Communicable and Emerging Infectious Diseases, Robert J. Havey, MD Institute for Global Health, Northwestern University,
     Chicago, IL, United States
     6
      Sustainable Intensification Innovation Lab, Kansas State University, Manhattan, KS, United States
     7
      Robert J. Havey, MD Institute for Global Health, Feinberg School of Medicine, Northwestern University, Chicago, IL, United States
     8
      Department of Medicine, General Internal Medicine and Geriatrics, Feinberg School of Medicine, Northwestern University, Chicago, IL, United States

     Corresponding Author:
     Lori Ann Post, PhD
     Buehler Center for Health Policy and Economics
     Robert J. Havey, MD Institute for Global Health
     Northwestern University
     750 N. Lake Shore Drive
     Chicago, IL, 60611
     United States
     Phone: 1 312 503 5659
     Email: lori.post@northwestern.edu

     Abstract
     Background: Variants of the SARS-CoV-2 virus carry differential risks to public health. The Omicron (B.1.1.529) variant,
     first identified in Botswana on November 11, 2021, has spread globally faster than any previous variant of concern. Understanding
     the transmissibility of Omicron is vital in the development of public health policy.
     Objective: The aim of this study is to compare SARS-CoV-2 outbreaks driven by Omicron to those driven by prior variants of
     concern in terms of both the speed and magnitude of an outbreak.
     Methods: We analyzed trends in outbreaks by variant of concern with validated surveillance metrics in several southern African
     countries. The region offers an ideal setting for a natural experiment given that most outbreaks thus far have been driven primarily
     by a single variant at a time. With a daily longitudinal data set of new infections, total vaccinations, and cumulative infections
     in countries in sub-Saharan Africa, we estimated how the emergence of Omicron has altered the trajectory of SARS-CoV-2
     outbreaks. We used the Arellano-Bond method to estimate regression coefficients from a dynamic panel model, in which new
     infections are a function of infections yesterday and last week. We controlled for vaccinations and prior infections in the population.
     To test whether Omicron has changed the average trajectory of a SARS-CoV-2 outbreak, we included an interaction between an
     indicator variable for the emergence of Omicron and lagged infections.
     Results: The observed Omicron outbreaks in this study reach the outbreak threshold within 5-10 days after first detection,
     whereas other variants of concern have taken at least 14 days and up to as many as 35 days. The Omicron outbreaks also reach
     peak rates of new cases that are roughly 1.5-2 times those of prior variants of concern. Dynamic panel regression estimates confirm
     Omicron has created a statistically significant shift in viral spread.
     Conclusions: The transmissibility of Omicron is markedly higher than prior variants of concern. At the population level, the
     Omicron outbreaks occurred more quickly and with larger magnitude, despite substantial increases in vaccinations and prior

     https://publichealth.jmir.org/2022/1/e35763                                                     JMIR Public Health Surveill 2022 | vol. 8 | iss. 1 | e35763 | p. 1
                                                                                                                          (page number not for citation purposes)
XSL• FO
RenderX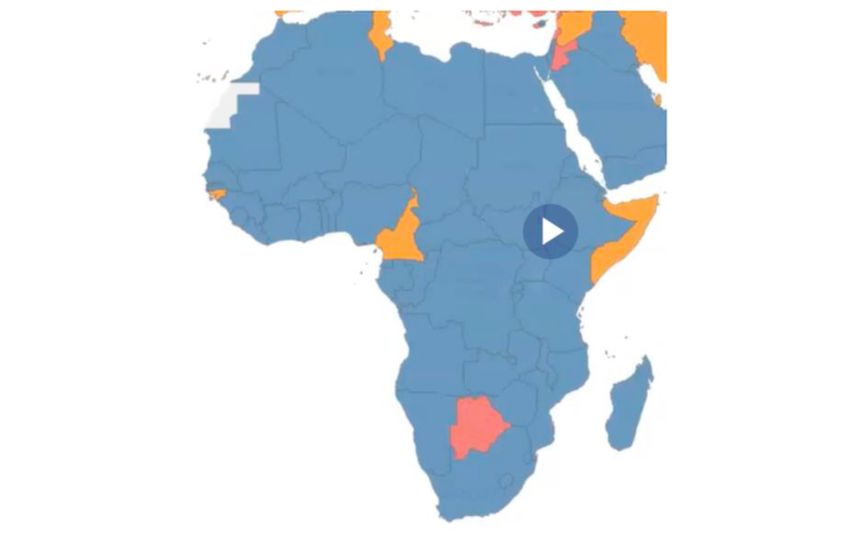
JMIR PUBLIC HEALTH AND SURVEILLANCE                                                                                                 Lundberg et al

     infections, which should have otherwise reduced susceptibility to new infections. Unless public health policies are substantially
     altered, Omicron outbreaks in other countries are likely to occur with little warning.

     (JMIR Public Health Surveill 2022;8(1):e35763) doi: 10.2196/35763

     KEYWORDS
     Omicron; SARS-CoV-2; public health surveillance; VOC; variant of concern; Delta; Beta; COVID-19; sub-Saharan Africa; public
     health; pandemic; epidemiology

                                                                           VOIs and VOCs have been named by the World Health
     Introduction                                                          Organization using the Greek alphabet. One VOC, Beta,
     Background                                                            originated in SSA, with the earliest documented sample in South
                                                                           Africa in May 2020. VOC designation was not declared for the
     The Omicron (B.1.1.529) variant was identified in Botswana            Beta variant until December 18, 2020 [12]. The most recent
     on November 11, 2021 [1]. This novel variant has an                   VOC, Omicron, was identified in multiple locations in
     unprecedented average of 50 mutations, including around 30            November 2021 and was officially designated a VOC on
     mutations in the spike protein. In vitro studies and                  November 26, 2021 [12].
     epidemiological surveys suggest that Omicron is able to spread
     more rapidly, but more information is needed to define                Omicron in Southern African Countries
     transmission rates, determine if it evades vaccine-elicited or        Since its debut more than 2 months ago, Omicron has been
     natural immunity, and determine if it influences disease severity     sequenced all over the world and appears to be responsible for
     or pathogenesis [2]. More data are needed to fill in these critical   driving several outbreaks of SARS-CoV-2 or causing existing
     knowledge gaps to best inform public health practices as              outbreaks to accelerate [13,14]. Because the acceleration of
     Omicron continues to spread [3].                                      daily transmissions has often been driven by multiple variants
     Omicron Compared to Other Variants                                    within a given country’s outbreak, such as in the case of the
                                                                           United States or the United Kingdom [15-17], it is difficult to
     After the first cases of Omicron were identified in Botswana,         disentangle the individual burden each variant places on a given
     it first spread to several countries in sub-Saharan Africa (SSA)      population [18].
     and has since spread globally [4]. Since then, Omicron has been
     identified in more than 140 countries [5,6]. Preliminary              On November 11, 2021, the date that Omicron was first
     investigations estimate that Omicron may have infected 3-6            sequenced in Botswana, the rate of new SARS-CoV-2
     times as many people as the Delta variant over this same time         transmissions in the United Kingdom was 34,427 cases per day.
     period [3,7-10]. Given that most outbreaks of new variants have       Estimates are based on a 7-day moving average, or a rate of
     occurred during periods of low incidence, it is hard to estimate      50.47 daily new cases per 100,000 population [4]. This
     how Omicron will behave in competition with other variants in         transmission rate is more than 5 times that of an outbreak; the
     regions of high incidence. Preliminary data from Europe suggest       Centers for Disease Control and Prevention (CDC) defines an
     Omicron may outcompete Delta, though it is unclear if these           outbreak as 10 daily new cases per 100,000 population. Omicron
     variants are targeting the same population [11]. Specifically, it     was identified in the United Kingdom while they were already
     is not clear if vaccinations or prior infections impact the           in the middle of an outbreak that involved other VOCs.
     infectivity and/or transmissibility of Omicron to the same extent     Conversely, with the exception of Botswana, none of the
     as other variants. Although viral reproduction rates may provide      countries in the south of SSA were in an outbreak. In fact, the
     some proxy of transmission risk, no studies have yet been             average daily speed for SSA or daily new transmissions was
     completed that stratify Omicron’s risk in different populations.      0.17 per 100,000 population, and that rate was decelerating by
     To that end, this study employs surveillance data and empirically     0.08 cases per day during the week that Omicron was first
     tested transmission metrics in the first countries to experience      sequenced in Botswana. This is consistent with previously
     outbreaks in SSA to determine how Omicron compares to the             reported outbreaks in most SSA countries, which occurred at
     first wave of SARS-CoV-2 virus as well as its subsequent              periods of low incidence and thus were driven largely by one
     variants of concern, including Alpha, Beta, and Delta.                variant at a time. Therefore, SSA countries provide an
                                                                           opportunity to understand how Omicron affects an entire
     Variants of Concern                                                   population compared to other VOCs without having to
     Since late 2020, variants of the SARS-CoV-2 virus that pose           differentiate the involvement of other variants within an
     increased risks have been identified, named, and monitored            outbreak.
     [12]. A variant that poses increased risk to human health is
     classified as a variant of interest (VOI) if it has genetic changes
                                                                           Objective
     that affect transmission, severity, immune system protection,         The objective of this study is to examine the status of the
     or treatment effectiveness and is associated with community           SARS-CoV-2 pandemic in SSA and to model novel transmission
     spread [12]. VOIs that result in an increase in transmissibility      metrics to determine if Omicron is more transmissible than other
     or disease severity, or that are not controlled through public        VOCs.
     health, vaccination, or medical therapy interventions, are
     designated as variants of concern (VOC) [12]. Since May 2021,

     https://publichealth.jmir.org/2022/1/e35763                                             JMIR Public Health Surveill 2022 | vol. 8 | iss. 1 | e35763 | p. 2
                                                                                                                  (page number not for citation purposes)
XSL• FO
RenderX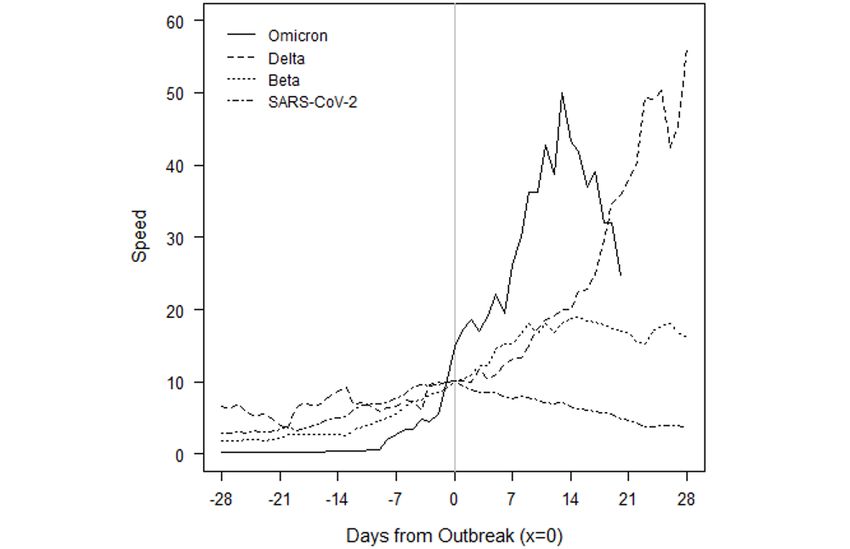
JMIR PUBLIC HEALTH AND SURVEILLANCE                                                                                                 Lundberg et al

                                                                           we also included Arellano-Bond estimates for the entire year
     Methods                                                               of 2021. We controlled for cumulative vaccinations and
     Novel Surveillance Metrics                                            infections because SSA countries had far fewer vaccinations
                                                                           and infections at the time of earlier outbreaks compared to the
     This report will present both standard and new validated              current Omicron outbreaks. An interaction term between an
     surveillance and transmission metrics [19-29] on the status of        indicator for the emergence of Omicron with the 1- and 7-day
     the SARS-CoV-2 pandemic in SSA countries over the past 3              lags of cases provides a test for whether Omicron has shifted
     weeks. The Foundation for Innovative New Diagnostics [30]             the nature of persistence in the pandemic.
     compiles data from multiple sources across individual websites,
     statistical reports, and press releases; data for the most recent     Publicly Available Molecular Data
     8 weeks were accessed from the GitHub repository [31]. This           Data on the number of sequenced variants over time per country
     produced a panel of 47 countries with 120 days for each country       were obtained from publicly available sequences in Global
     (n=5640). An empirical difference equation was specified in           Initiative on Sharing Avian Influenza Data (GISAID) [39]. We
     which the number of positive cases in each country at each day        collected clade designations from sequences using Nextclade
     is a function of the prior number of cases and weekly shift           nomenclature [40] and lineage designations using Pangolin
     variables that measure whether the contagion was growing              nomenclature for SARS-CoV-2 [41,42]. Additionally, we
     faster/slower/at the same rate compared to the previous weeks.        contrasted prevalence data with the compiled data available in
     The dynamic panel model was estimated using the generalized           outbreak.info [43].
     method of moments approach by implementing the
     Arellano-Bond estimator in R (version 4.1.1; R Foundation for         Modeling
     Statistical Computing) with the plm package (version 2.4-1)           We first plotted the spike in cases by variant and country. To
     [32,33].                                                              compare trends in the rate of new infections under each variant,
                                                                           we standardized the point at which a country eclipses the CDC
     Arellano-Bond estimation of difference equations has several
                                                                           threshold of an outbreak as day 0. Within each country, we
     statistical advantages over R naught [26,28,34-38]: (1) it allows
                                                                           followed the rate of SARS-CoV-2 infections in the 4 weeks up
     for statistical examination of the model’s predictive ability and
                                                                           to an outbreak threshold and in the 4 weeks afterward, subject
     the validity of the model specification, (2) it corrects for
                                                                           to the limits of the most recent available data. This
     autocorrelation and heteroscedasticity, (3) it has good properties
                                                                           standardization allows for a comparison of the speed,
     for data with a small number of time periods and large number
                                                                           acceleration, and magnitude of the Omicron outbreaks relative
     of countries, and (4) it corrects for omitted variable issues and
                                                                           to those driven by earlier VOCs.
     provides a statistical test of correction validity. With these
     advantages, the method is applicable to ascertain and statistically   Because these trend comparisons do not control for differences
     validate changes in the evolution of the pandemic within a            in population vaccinations and prior infections during the
     period of a week or less, including changes in the reproduction       various outbreaks, we added these mediators as control variables
     rate [27]. Empirically, we validated this technique based on the      in a dynamic panel regression. We modeled the rate of new
     predictive ability of past data that resulted in the derivation of    infections as a function of infections on the previous day and
     speed, acceleration, jerk, and 7-day persistence, which follow        previous week. These lagged infection rates measure persistence
     the definitions and methods described by Oehmke and                   in the pandemic, or the extent to which cases today echo forward
     colleagues [27,34].                                                   into tomorrow and next week.
     Traditional surveillance indicators include total cases and deaths,   The model contains an indicator variable equal to 1 if the
     7-day moving average of new cases, and 7-day moving average           calendar date was on or after November 1, 2021, and equal to
     of deaths. Enhanced surveillance metrics [26-28] include the          0 if the calendar date was earlier. This indicator is meant to
     following: (1) speed (the weekly average number of new positive       capture a conservative estimate of the time window in which
     tests per day divided by the total country population and             the Omicron variant originated. Interactions between this
     multiplied by 100,000), (2) acceleration (the weekly average of       indicator and infections on the previous day and week provide
     the day-over-day change in the speed of infection), (3) jerk (the     a test for whether Omicron shifted the trajectory of the
     week-over-week change in the acceleration rate of                     pandemic. The model also controlled for cumulative
     transmissions), and (4) seven-day persistence effect on speed,        vaccinations and infections in the country population, and
     which refers to the number of new cases reported today that are       included an indicator for weekend dates, which are subject to
     statistically attributable to new cases reported 7 days ago. We       spotty data reports.
     measure the transmission inflation factor by dividing the rate
                                                                           We used the Arellano-Bond estimator to generate coefficient
     of new cases each week by the rate of new cases on December
                                                                           estimates, along with their standard errors, for a sample period
     3 [4]. Although standard surveillance metrics identify the
                                                                           covering January 1, 2021, through December 31, 2021. This
     presence and severity of an outbreak, they do not explain
                                                                           time period covers the recent Omicron outbreaks as well as
     whether an outbreak is contracting, escalating, or imminent.
                                                                           outbreaks driven by other VOCs.
     Our additional transmission metrics do.
     We also used an extension of the sample to examine how
     Omicron may have shifted the evolution of the pandemic. To
     compare Omicron outbreaks to those caused by earlier VOCs,

     https://publichealth.jmir.org/2022/1/e35763                                             JMIR Public Health Surveill 2022 | vol. 8 | iss. 1 | e35763 | p. 3
                                                                                                                  (page number not for citation purposes)
XSL• FO
RenderX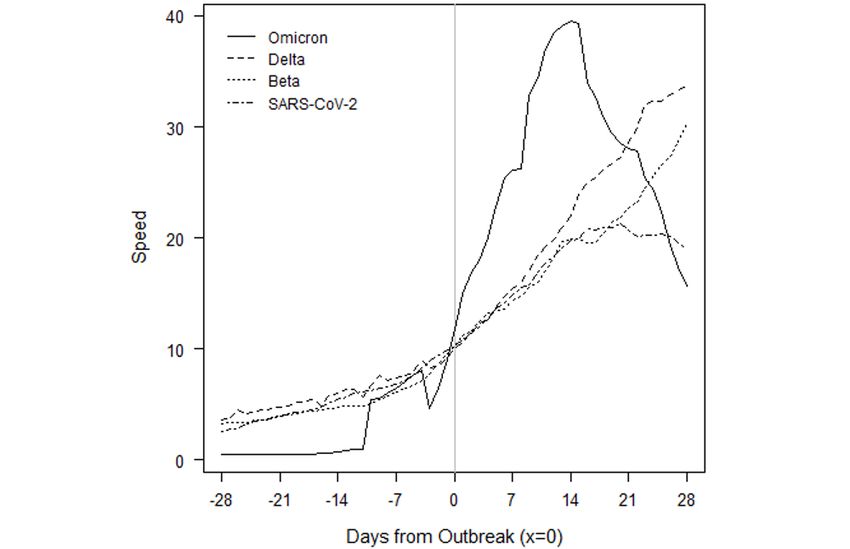
JMIR PUBLIC HEALTH AND SURVEILLANCE                                                                                                 Lundberg et al

                                                                          Zimbabwe at their apex in the outbreak by 26.8-fold, 22.4-fold,
     Results                                                              39.7-fold, 24.9-fold, 3.4-fold, 12.2-fold, 176-fold, and 31.9-fold,
     Table 1 provides standard surveillance metrics along with our        respectively.
     novel metrics of transmission for 7 data points between              Our novel transmission metric, 7-day persistence, is based on
     December 3, 2021, and January 17, 2022. For a complete               a 120-day panel of data and measures the number of new cases
     surveillance and transmission table that includes daily figures      per day per 100,000 that are a function of novel infections 7
     for all SSA countries over the past 7 weeks, current through         days earlier. Essentially, it measures how outbreaks and
     January 17, 2021, please refer to Multimedia Appendix 1 [4].         transmissions echo forward. Measuring the persistence rate of
     The daily speed of the pandemic is defined as the number of          SARS-CoV-2 avoids the limitations and data bias in the
     new cases per day per 100,000 population. If we use the CDC          measurement of R naught, such as sampling error and missing
     threshold for an outbreak or a threshold of 10 daily new cases       data [26,27]. It is the echoing forward of transmissions that
     per 100,000 population, these eight countries in our study group     explains the underlying condition that causes a clustering of
     were in an outbreak sometime between December 3, 2021, and           new cases. Persistence is a transmission metric that is the first
     January 17, 2022: Botswana, Eswatini (formerly known as              to signal a potential outbreak because it is based on 120 days
     Swaziland), Gabon, Lesotho, Namibia, South Africa, Zambia,           of data versus the 7 days used in standard surveillance. As an
     and Zimbabwe (Figure 1) [4]. In the truncated Table 1, we            example, Botswana showed an upward trend in persistence 2
     excluded Cabo Verde, Comoros, and Seychelles because                 weeks before its Omicron outbreak had reached the CDC
     outbreaks in small densely populated island nations included         threshold of 10 cases per 100,000 population (Table 1). The
     other VOCs when Omicron entered into the equation. Although          increase in speed itself only became evident about 7 days before
     Zambia, Namibia, and Botswana currently remain in an outbreak        the threshold was reached. Persistence continues to increase for
     (with a daily rate of new cases per 100,000 population of 11.6,      an additional week after the apex of the outbreak as it is the
     13.5, and 46.6, respectively), Gabon, Lesotho, South Africa,         echo forward of cases.
     Eswatini, and Zimbabwe’s outbreaks have ended and continue           Our model also calculates the weekly rate of acceleration and
     to cycle down at a daily rate of 7.6, 6.3, 9.1, 7.4, and 4.1,        jerk. The acceleration rate helps to identify countries that are
     respectively.                                                        at the beginning, middle, or end of an outbreak, even if a country
     To put the outbreaks in perspective, we standardized the data        still has relatively few new SARS-CoV-2 cases per day. In
     using December 3, 2021, as the base rate of daily cases. The         addition, these transmission metrics can inform when a spike
     inflation factor is the rate of new cases on any given day divided   in cases is still accelerating and at risk for exponential growth
     by the base rate on December 3, 2021. By early December,             or when an outbreak is slowing, reaching its apex, or
     Omicron was driving the escalation of new cases in sub-Saharan       decelerating from day to day, whereas the jerk measures shifts
     countries. Eswatini and South Africa’s Omicron escalation of         in the rates of acceleration week over week.
     cases were first to develop and they are the only two countries      Exponential growth measures the expansion and contraction of
     whose baselines have returned to their December 3, 2021,             the outbreak. At their zenith, Eswatini and Namibia had the
     baselines. The rate of new cases increased for Botswana, Gabon,      largest weeks of exponential growth at 454.8 and 268.1,
     Lesotho, Namibia, South Africa, Eswatini, Zambia, and                respectively.

     https://publichealth.jmir.org/2022/1/e35763                                             JMIR Public Health Surveill 2022 | vol. 8 | iss. 1 | e35763 | p. 4
                                                                                                                  (page number not for citation purposes)
XSL• FO
RenderX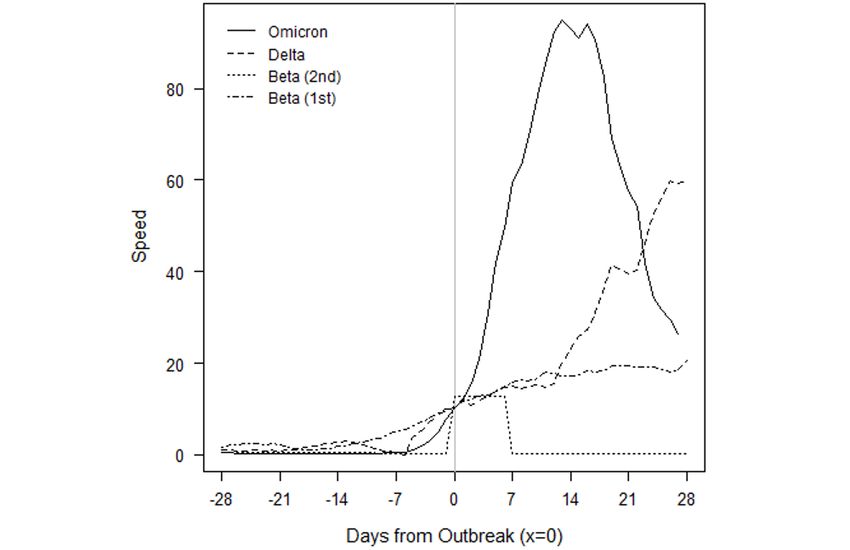
JMIR PUBLIC HEALTH AND SURVEILLANCE                                                                                                         Lundberg et al

     Table 1. Standard and novel surveillance metrics for the first countries to experience an Omicron-only outbreak, December 3, 2021-January 17, 2022.
                                   New cases 7-day   New cases/100,000 7- Inflation   7-day persis- Acceleration                         Exponential growth
      Country and date             moving average    day moving average   factor      tence         weekly       Jerk weekly             potential weekly
      Botswana
           3-Dec-2021              56                2.3                   1.0        1.0           –3.0              8.7                –7.0
           10-Dec-2021             113               4.7                   2.0        3.9           16.5              19.4               23.3
           17-Dec-2021             539               22.5                  9.6        5.6           124.6             108.1              140.0
           24-Dec-2021             1304              54.4                  23.2       30.0          223.4             98.9               291.7
           31-Dec-2021             1502              62.7                  26.8       73.2          57.8              –165.6             159.2
           7-Jan-2022              1478              61.7                  26.3       85.2          –7.0              –64.8              –55.2
           14-Jan-2022             1118              46.6                  19.9       30.4          –105.2            –98.2              –185.3
      Gabon
           3-Dec-2021              24                1.1                   1.0        0.6           –4.9              –1.6               –6.0
           10-Dec-2021             23                1.0                   1.0        1.7           –0.4              4.6                –1.6
           17-Dec-2021             27                1.2                   1.1        1.2           1.4               1.8                3.4
           24-Dec-2021             42                1.9                   1.8        1.6           4.6               3.2                7.7
           31-Dec-2021             537               23.6                  22.4       2.5           152.0             147.4              158.3
           7-Jan-2022              306               13.4                  12.7       32.2          –71.0             –223.0             –81.7
           14-Jan-2022             173               7.6                   7.2        6.6           –40.7             30.3               –46.6
      Lesotho
           3-Dec-2021              12                0.5                   1.0        0.1           2.5               2.9                3.1
           10-Dec-2021             87                4.0                   7.3        0.9           24.4              21.9               26.3
           17-Dec-2021             264               12.2                  22.3       4.7           57.4              33.0               70.2
           24-Dec-2021             471               21.8                  39.7       16.1          67.0              9.6                101.2
           31-Dec-2021             116               5.4                   9.8        29.0          –115.0            –182.1             –65.8
           7-Jan-2022              320               14.8                  27.0       7.2           66.2              181.3              83.0
           14-Jan-2022             136               6.3                   11.5       7.2           –59.7             –126.0             –51.4
      Namibia
           3-Dec-2021              51                2.0                   1.0        0.1           10.9              9.5                12.3
           10-Dec-2021             246               9.5                   4.8        3.3           52.8              41.9               59.3
           17-Dec-2021             495               19.1                  9.7        11.2          67.3              14.6               94.9
           24-Dec-2021             1269              49.0                  24.9       25.5          209.4             142.1              268.1
           31-Dec-2021             628               24.3                  12.3       65.9          –173.3            –382.7             –171.6
           7-Jan-2022              506               19.6                  9.9        33.0          –33.0             140.3              –67.3
           14-Jan-2022             350               13.5                  6.9        9.6           –42.2             –9.1               –63.2
      South Africa
           3-Dec-2021              6982              11.6                  1.0        2.2           67.3              58.1               74.0
           10-Dec-2021             15,467            25.8                  2.2        19.1          98.9              31.6               133.6
           17-Dec-2021             23,437            39.0                  3.4        30.2          92.9              –6.0               159.3
           24-Dec-2021             16,654            27.7                  2.4        51.7          –79.1             –172.0             –123.9
           31-Dec-2021             9311              15.5                  1.3        37.0          –85.6             –6.5               –96.4
           7-Jan-2022              7932              13.2                  1.1        20.9          –16.1             69.5               –38.6
           14-Jan-2022             5461              9.1                   0.8        6.5           –28.8             –12.7              –42.8
      Eswatini

     https://publichealth.jmir.org/2022/1/e35763                                                     JMIR Public Health Surveill 2022 | vol. 8 | iss. 1 | e35763 | p. 5
                                                                                                                          (page number not for citation purposes)
XSL• FO
RenderX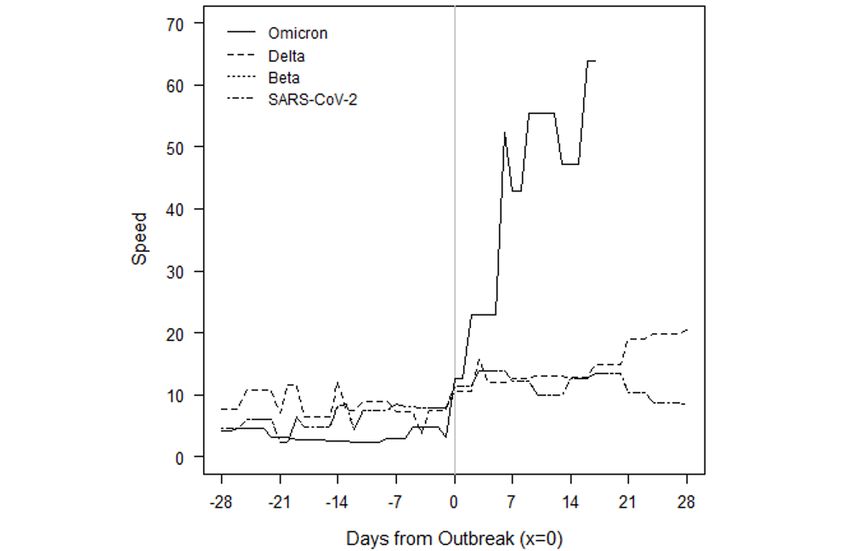
JMIR PUBLIC HEALTH AND SURVEILLANCE                                                                                                        Lundberg et al

                                   New cases 7-day   New cases/100,000 7- Inflation   7-day persis- Acceleration                        Exponential growth
      Country and date             moving average    day moving average   factor      tence         weekly       Jerk weekly            potential weekly
           3-Dec-2021              91                7.7                   1.0        0.2          50.8              49.0               52.4
           10-Dec-2021             573               48.9                  6.3        12.7         288.3             237.6              314.2
           17-Dec-2021             1101              93.9                  12.2       57.3         314.7             26.4               454.8
           24-Dec-2021             725               61.9                  8.0        124.1        –224.1            –538.8             –311.5
           31-Dec-2021             308               26.3                  3.4        82.5         –249.2            –25.1              –214.1
           7-Jan-2022              152               12.9                  1.7        35.4         –93.3             155.8              –91.9
           14-Jan-2022             87                7.4                   1.0        6.3          –38.9             54.4               –44.8
      Zambia
           3-Dec-2021              21                0.1                   1.0        0.0          0.4               0.4                0.5
           10-Dec-2021             66                0.3                   3.2        0.2          1.7               1.3                2.0
           17-Dec-2021             530               2.8                   25.8       0.4          17.2              15.5               18.3
           24-Dec-2021             2071              10.9                  100.7      3.8          57.0              39.9               66.1
           31-Dec-2021             3620              19.1                  176.0      14.9         57.3              0.3                87.6
           7-Jan-2022              3429              18.1                  166.7      26.3         –7.1              –64.4              –30.0
           14-Jan-2022             2203              11.6                  107.1      9.0          –45.4             –38.3              –60.8
      Zimbabwe
           3-Dec-2021              515               3.4                   1.0        0.1          22.3              22.4               23.1
           10-Dec-2021             2625              17.4                  5.1        5.6          97.9              75.6               109.2
           17-Dec-2021             4821              31.9                  9.4        20.5         101.9             4.0                150.9
           24-Dec-2021             1881              12.5                  3.7        42.4         –136.4            –238.2             –109.1
           31-Dec-2021             1503              10.0                  2.9        16.7         –17.5             118.8              –35.0
           7-Jan-2022              1146              7.6                   2.2        13.5         –16.6             1.0                –29.7
           14-Jan-2022             622               4.1                   1.2        3.7          –24.3             –7.8               –26.5

     https://publichealth.jmir.org/2022/1/e35763                                                    JMIR Public Health Surveill 2022 | vol. 8 | iss. 1 | e35763 | p. 6
                                                                                                                         (page number not for citation purposes)
XSL• FO
RenderX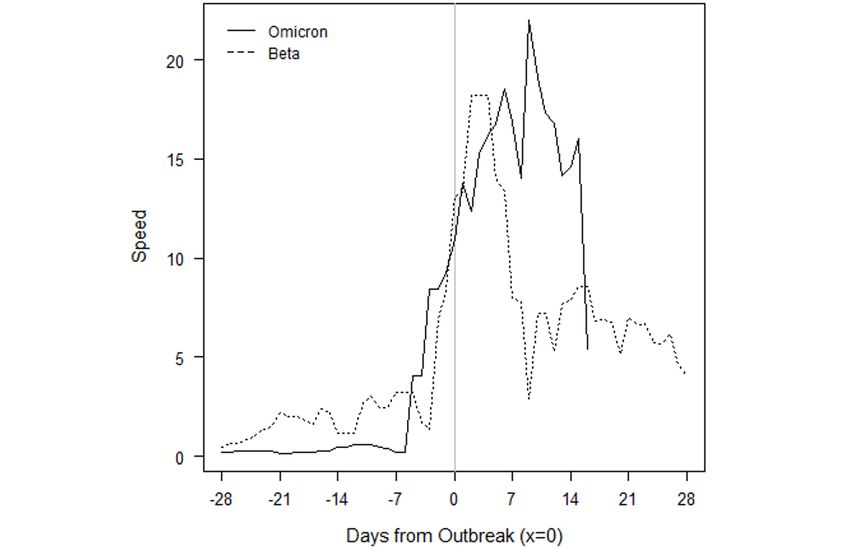
JMIR PUBLIC HEALTH AND SURVEILLANCE Lundberg et al
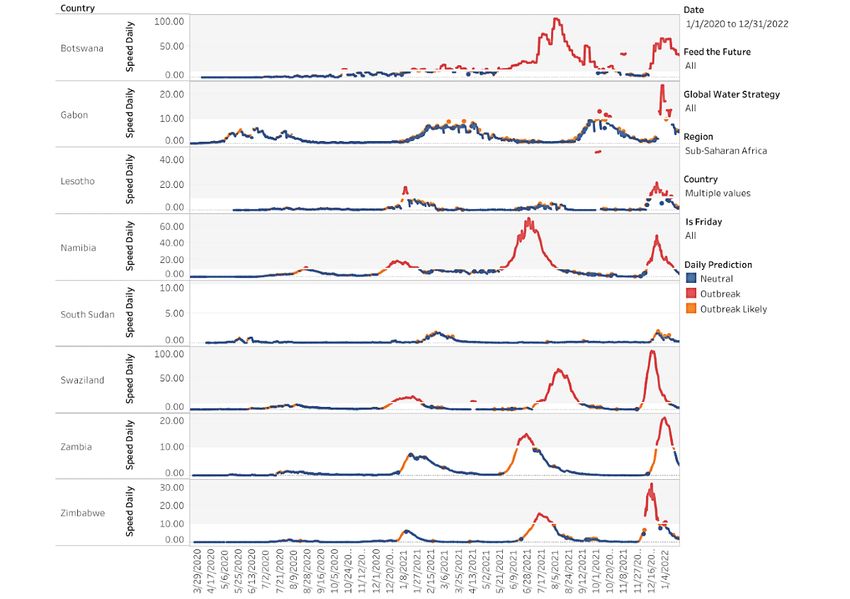
Figure 1. First sub-Saharan countries to experience an Omicron outbreak.
Figure 2 demonstrates how the SARS-CoV-2 pandemic
How Do Omicron Outbreaks Compare to Other VOC transmitted through Africa after the Omicron variant was
Outbreaks? identified. Countries that light up as orange have been
We examined the daily speed of the pandemic or the number experiencing a surge in cases for 7 consecutive days. Blue
of daily new cases per 100,000 population and found that Gabon, countries indicate neutral growth for 24 hours and countries in
Lesotho, South Africa, Eswatini, Zambia, and Zimbabwe have red exceed the outbreak threshold of 10 daily new cases per
already set new 2-year outbreak records in the first 4 weeks of 100,000 population. Since November 11, 2021, a number of
the outbreak, in December 2021. All the countries in Figure 1 countries in Africa had outbreaks forming, especially those
whose current outbreaks are driven by Omicron, except countries in the south of the continent [4]. The figures for each
Botswana, had more new daily infections than during every country, presented below, differentiate between the VOCs.
other outbreak caused by either the original SARS-CoV-2
The evolution of Omicron in the first 8 African countries to
variant, Beta, or Delta. Most of these countries recorded peak
experience an Omicron-only outbreak—Botswana, Eswatini,
speeds during the outbreak of the Delta variant; however, the
Gabon, Lesotho, Namibia, South Africa, Zambia, and
exponential growth of Omicron cases has reversed course and
Zimbabwe—are depicted in the figures presented below. To
contracted. It is remarkable that not only did Omicron result in
compare the evolution of infections to outbreaks driven by
record highs, but also those highs took fewer days to reach.
earlier VOCs, a value of 0 on the x-axis denotes the moment a
For some of the countries currently in an outbreak, such as country eclipses the CDC threshold of 10 new cases per 100,000
Botswana and Zambia, the rate of increase is slowing, which population. This standardization allows for a visual comparison
means even though these countries are in an outbreak, the of outbreaks that have occurred on different calendar dates
increase in daily new cases slowed between the last week in within a country.
December and the first week in January 2022, compared to the
The solid lines refer to the speed, or rate of new cases, of the
prior 4 weeks. In contrast, sub-Saharan countries where Omicron
current Omicron-driven outbreak. In each of Botswana,
began transmitting and escalating later are not slowing
Eswatini, Gabon, Lesotho, Namibia, South Africa, Zambia, and
(Multimedia Appendix 1). Not only did the 7-day moving
Zimbabwe, the speed of the pandemic has accelerated faster
average, rate of new cases, and daily new cases increase more
under Omicron than prior VOCs, as depicted by dashed lines.
rapidly with Omicron than with other VOCs, but the rate itself
increased when compared to the prior 2-4 weeks.
https://publichealth.jmir.org/2022/1/e35763 JMIR Public Health Surveill 2022 | vol. 8 | iss. 1 | e35763 | p. 7
(page number not for citation purposes)
XSL• FO
RenderX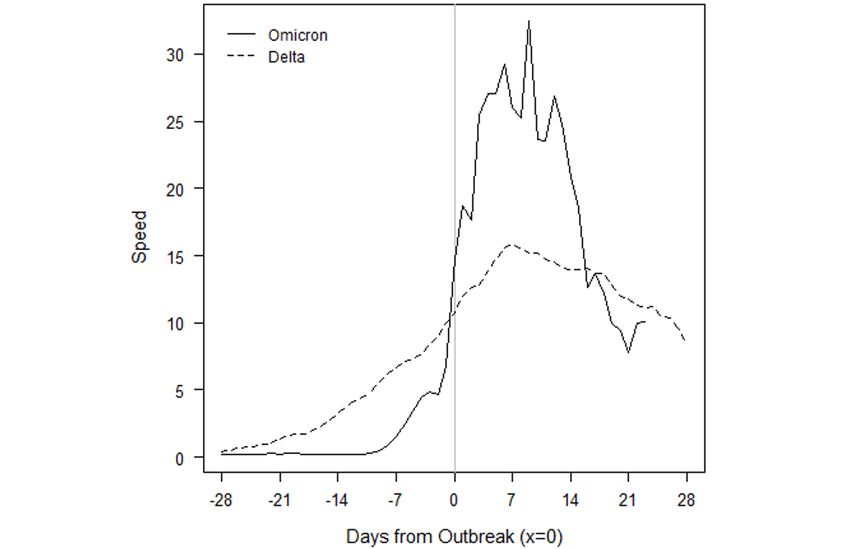
JMIR PUBLIC HEALTH AND SURVEILLANCE                                                                                                      Lundberg et al

     Figure 2. A screen capture of a dynamic map of transmission of the SARS-CoV-2 pandemic through Africa after the Omicron variant was identified.
     Full video can be viewed here: [44].

     In Botswana (Figure 3), the outbreaks from SARS-CoV-2, Beta,             transmissions per 100,000 population. Within 2 weeks, the speed
     and Delta roughly followed the same initial pattern in new cases.        had jumped to 60. If SSA countries with earlier Omicron
     Surprisingly, in fact, the progression of SARS-CoV-2 and Beta            outbreaks that have subsided are an indication, Botswana may
     were similar enough to be almost indistinguishable at the scale          be near its peak speed. The comparison of peak speeds between
     of the plot. Data for the country are not always available on a          Omicron and Delta outbreaks is confounded, however, because
     daily basis, so the trend lines contain steps. The Omicron               the Beta outbreak had yet to truly subside before the Delta
     outbreak began with fewer transmissions than Delta, Beta, and            outbreak began.
     the original SARS-CoV-2 variants. Still, before Omicron, every
                                                                              The Omicron outbreak in Eswatini also quickly accelerated
     outbreak built slowly over the course of several weeks before
                                                                              from near zero new cases per 100,000 population to a peak of
     peaking. Though not depicted over the time scale, the eventual
                                                                              95 within approximately 2 weeks (Figure 4). The peak is over
     peaks of Delta, Beta, and SARS-CoV-2 were roughly 96, 20,
                                                                              1.5 times higher than the previous peak in the Delta outbreak,
     and 12. The return to sub-outbreak speed was variable because
                                                                              and 4 times higher than the peak in either of the previous Beta
     the Beta outbreak had yet to truly subside before the Delta
                                                                              outbreaks. We note that because sequencing data are limited,
     outbreak started. Speed just barely fell to below the CDC
                                                                              the assignment of the initial 2 outbreaks to the Beta variant is
     threshold before the Delta outbreak.
                                                                              our own assumption.
     The Omicron outbreak, in contrast, occurred within less than a
     week. Speed quickly jumped from roughly 5 to 25 daily new

     https://publichealth.jmir.org/2022/1/e35763                                                  JMIR Public Health Surveill 2022 | vol. 8 | iss. 1 | e35763 | p. 8
                                                                                                                       (page number not for citation purposes)
XSL• FO
RenderX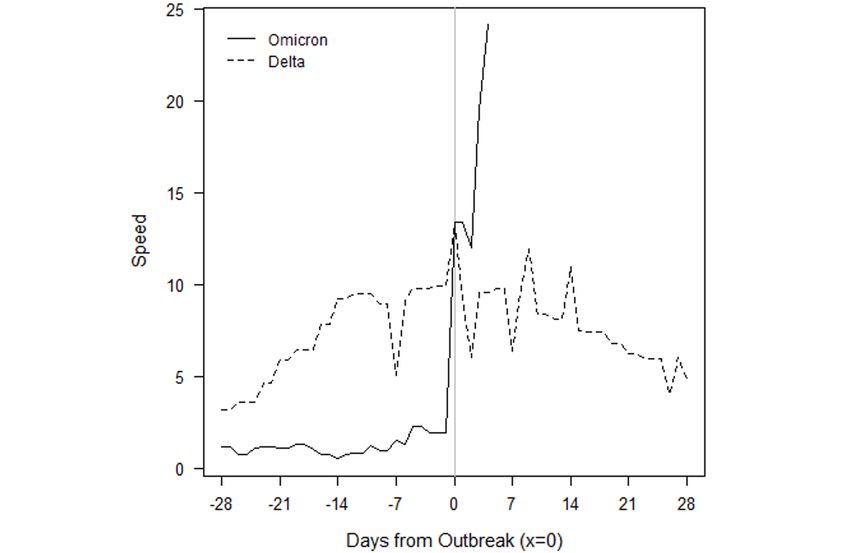
JMIR PUBLIC HEALTH AND SURVEILLANCE                                                                                           Lundberg et al

     Figure 3. Botswana outbreaks by variant of concern.

     Figure 4. Eswatini outbreaks by variant of concern.

     Gabon has seen an even higher acceleration of new cases in the   peak is already twice that of the earlier Delta outbreak, and
     Omicron outbreak (Figure 5). From a speed of near zero, the      acceleration may continue if other SSA countries whose
     country reached a speed of 25 within less than a week. This      Omicron outbreaks have begun to subside provide any

     https://publichealth.jmir.org/2022/1/e35763                                       JMIR Public Health Surveill 2022 | vol. 8 | iss. 1 | e35763 | p. 9
                                                                                                            (page number not for citation purposes)
XSL• FO
RenderX
JMIR PUBLIC HEALTH AND SURVEILLANCE Lundberg et al
indication. In those countries, the rate of new cases accelerated and Delta outbreaks continued to show positive acceleration
for at least 2 weeks before the Omicron outbreak began to for roughly 2 weeks after the CDC threshold was reached. We
subside. note that while we attribute the January 2021 outbreak to the
Beta variant, which was first detected in the country on January
The Omicron and Beta outbreaks in Lesotho followed a broadly
15, 2021, this attribution is an assumption because sequencing
similar trajectory, though the duration of the peak speed in
data are limited. Omicron provided slightly more warning than
Omicron was higher (Figure 6). Each outbreak yielded a peak
it did for Botswana, but speed jumped dramatically over the
speed of roughly 20. This similarity of outbreaks by VOC is
course of a week, from roughly 5 to 20, then to 50 within another
shared by South Africa. The similarity is perhaps unsurprising
10 days. The Omicron outbreak has since subsided as quickly
because Lesotho has borders contained entirely within South
as it rose. The peak speed of 50 is lower than the peak speed of
Africa.
70 the country eventually reached under the Delta outbreak.
Figure 7 depicts the outbreaks for Namibia. Each prior outbreak However, like in Botswana, the Delta outbreak came at the tail
built slowly over the course of several weeks, while Omicron of the Beta outbreak. Speed never fell below 5 between the two,
began with fewer cases than other outbreaks. The initial which may confound a comparison of the Omicron and Delta
SARS-CoV-2 outbreak was fleeting, and speed declined outbreaks.
immediately after the outbreak threshold was reached. The Beta
Figure 5. Gabon outbreaks by variant of concern.
https://publichealth.jmir.org/2022/1/e35763 JMIR Public Health Surveill 2022 | vol. 8 | iss. 1 | e35763 | p. 10
(page number not for citation purposes)
XSL• FO
RenderXJMIR PUBLIC HEALTH AND SURVEILLANCE Lundberg et al
Figure 6. Lesotho outbreaks by variant of concern.
Figure 7. Namibia outbreaks by variant of concern.
South Africa saw a more rapid acceleration in new infections over the course of several weeks, but they continued to rise for
in the Omicron outbreak relative to prior VOCs (Figure 8). The 2-5 weeks after the CDC outbreak threshold was reached. The
prior outbreaks followed similar patterns. They built slowly Omicron outbreak gave roughly a week and a half of warning.
https://publichealth.jmir.org/2022/1/e35763 JMIR Public Health Surveill 2022 | vol. 8 | iss. 1 | e35763 | p. 11
(page number not for citation purposes)
XSL• FO
RenderXJMIR PUBLIC HEALTH AND SURVEILLANCE Lundberg et al
Acceleration has been much faster, and peak speed was higher: difference in cumulative vaccinations and infections under the
40 in Omicron versus 33, 31, and 20 in Delta, Beta, and Omicron outbreaks and those driven by earlier VOCs. For
SARS-CoV-2, respectively. Speed fell to below 20 by the end example, South Africa had reached nearly 12 million total
of December 2021 and dipped below the outbreak threshold by vaccinations by the threshold of the Omicron outbreak, but the
0.09 cases per 100,000 population by the second week of country had only surpassed 1.5 million vaccinations by the
January 2022. threshold of the earlier Delta outbreak. The respective numbers
for total infections at the start of each outbreak were roughly 3
Figure 9 depicts the outbreaks in Zambia. The earlier Delta
million and 1.7 million.
outbreak built slowly over 4 weeks before the country eclipsed
the outbreak threshold. Speed slowly rose to 15 over the next Regression analysis provides estimates of the relationship
2 weeks before subsiding at roughly the same rate at which it between two variables after controlling for others. We completed
grew. The Omicron outbreak only gave 2 weeks of warning, Arellano-Bond dynamic panel estimates for SSA over the full
and within 1 week of surpassing the outbreak threshold, speed calendar year 2021. A dynamic model is required because new
had already reached 20. SARS-CoV-2 infections are certainly a function of prior
infections. The estimation also controls for time-invariant,
Zimbabwe only had one prior outbreak with which to compare
unobservable characteristics, which may differ by country. We
Omicron, which is notable because the country started with a
extended the sample period used for surveillance metrics to
lower rate of transmissions in the Omicron outbreak than it did
cover the start of 2021. The extension was needed to examine
in the Delta and Beta surges in transmissions (Figure 10).
how Omicron outbreaks compare to those from other VOCs
Although Beta caused an increase in cases around the start of
earlier in the year. Note that for countries with complete data
2021, speed did not rise enough to reach the CDC outbreak
for the year, the time period T is slightly higher than 365 days
threshold. Delta reached the outbreak threshold after a 3- to
because the model incorporates lags of variables.
4-week rise in transmissions. Omicron gave only a week’s
warning before reaching the threshold and reached a speed over The dependent variable is the rate of new cases per 100,000
twice the peak of Delta. Again, speed has fallen at roughly the population. The key independent variable, after_nov_21, is an
rate at which it grew, but speed reversed its downward trend indicator for whether the calendar date is on or beyond
over the most recent 2 days of data. November 1, 2021. Because the exact date of origin for Omicron
is unknown, this date is meant to be a conservative estimate of
Importantly, the raw numbers in Figures 3-10 do not control
the time window in which it originated. However, results are
for cumulative vaccinations or infections. The rate of
robust to recoding the variable with nearby dates.
acceleration under Omicron is even more alarming given the
Figure 8. South Africa outbreaks by variant of concern.
https://publichealth.jmir.org/2022/1/e35763 JMIR Public Health Surveill 2022 | vol. 8 | iss. 1 | e35763 | p. 12
(page number not for citation purposes)
XSL• FO
RenderXJMIR PUBLIC HEALTH AND SURVEILLANCE Lundberg et al
Figure 9. Zambia outbreaks by variant of concern.
Figure 10. Zimbabwe outbreaks by variant of concern.
The first and seventh lag of the rate of new cases (lag.pos.1 and forward from day to day and week to week, respectively. The
lag.pos.7, respectively) provide measures of persistence in the regression estimates also control for cumulative cases
pandemic. Their coefficients describe how new cases echo (cum_cases), cumulative vaccinations (cum_vacc), and an
https://publichealth.jmir.org/2022/1/e35763 JMIR Public Health Surveill 2022 | vol. 8 | iss. 1 | e35763 | p. 13
(page number not for citation purposes)
XSL• FO
RenderXJMIR PUBLIC HEALTH AND SURVEILLANCE Lundberg et al
indicator variable for weekend dates (weekend), as data reports Omicron this early in its spread suggests its true effect may be
are less consistently released on weekends. stronger than the initial results indicate.
Because after_nov_21 is interacted with the lagged rate of new The coefficient on cum_vacc shows the protective effect of
cases, the coefficient on after_nov_21 by itself does not provide vaccinations at the population level. Over the course of 2021,
a useful interpretation. To be precise, the coefficient provides every vaccination reduces the expected transmission rate by
the estimated change in the average rate of new cases after 0.002. The effect is statistically significant at the .05 level.
November 2021 for a country with 0 previous cases. Although its magnitude appears modest, keep in mind the
dependent variable measures the daily rate of new infections
However, the interaction between after_nov_21 and the 1- and
per 100,000.
7-day lags of cases (lag.pos.1, lag.pos.7) confirms that Omicron
has changed the evolution of the pandemic. The positive, The positive coefficient on cum_cases may come as a surprise
statistically significant coefficients on the interaction terms if prior infections reduce susceptibility. However, the
mean Omicron has strengthened persistence in the pandemic mechanical correlation between cumulative cases and new
compared to earlier VOCs. After controlling for vaccinations infections in an outbreak seems to mask any possible reductions
and prior infections, 1- and 7-day persistence have increased in susceptibility.
by 1 and 0.52, respectively, since the start of November 1, 2021.
Finally, the Arellano-Bond estimator relies on instrumental
We also note that several SSA countries stand on the precipice variables. Although their validity cannot be directly tested, the
of outbreak. The ability to identify a statistical impact of Sargan test of overidentification restrictions yields a P value
near 1, which suggests the instruments are valid (Table 2).
Table 2. Arellano-Bond dynamic panel data estimatesa.
Variable Coefficient (SE) P value
after_nov_21 –2.68 (1.02) .009
lag.pos.1 –0.68 (0.14)JMIR PUBLIC HEALTH AND SURVEILLANCE Lundberg et al
Likewise, the coming weeks will provide critical information from being reported instantaneously and limits the completeness
on the effect of Omicron outbreaks on deaths and of data. Multiple days of data are frequently bundled into a
hospitalizations. Recent data from the United Kingdom indicate single report, which may give the impression of zero infections
SARS-CoV-2 infections from the Omicron variant may not be or deaths over a period of days followed by a sudden spike in
any less severe than the Delta variant [46], which contradicts those same measures. Our data address this issue by calculating
observations from South Africa that suggest Omicron infections 7-day averages per 100,000 population. However, inconsistent
are less severe than earlier VOC infections [48,49]. Early reporting in combination with large new daily cases reports can
laboratory data also show significant reductions in the ability also artificially suppress the 7-day average and mask the true
of SARS-CoV-2 antibodies to neutralize the Omicron variant impact of increasing cases over that period.
compared to the original virus, among those vaccinated with 2
doses of the Pfizer/BioNTech vaccine [47]. In one study in
Comparison With Prior Work
California, investigators found Omicron increased the risk of We conducted prior surveillance estimates and SARS-CoV-2
hospitalization 4- to 5-fold and increased the risk of symptomatic research on speed, acceleration, jerk, and persistence, relying
disease 7- to 10-fold for mRNA vaccine recipients, with similar on dynamic panel data in SSA and other global regions
relative effects for recently vaccinated individuals or individuals [20,21,23,24,26-29,34,38,50-52].
with waned antibody titers [49]. Thus, the significantly higher
Conclusions
speed and magnitude of an Omicron outbreak, coupled with
more extensive vaccine escape [47] and possibly comparable Without question, Omicron is more transmissible than prior
pathogenicity, could signal a potential to significantly VOCs [49]. The analysis of outbreaks by VOC in southern
overwhelm hospital capacity with a larger number of infected African countries shows Omicron transmits at least 2-3 times
persons within a shorter window of time [45]. faster at a country level than prior VOCs. Despite starting from
a lower daily rate of SARS-CoV-2 transmissions, Omicron
In addition to southern Africa being the region where Omicron results in worse outbreaks in terms of magnitude by a factor of
was first identified, it offers an ideal natural experiment for a 1.5-2 on average. However, as Eswatini, Lesotho, Namibia,
comparison of isolated outbreaks driven by Omicron versus South Africa, and Zimbabwe have shown, the outbreaks may
prior VOCs. The impact of Omicron may be different for also subside as quickly as they grow. Still, as outbreaks grow,
countries already in the midst of current outbreaks driven by local surveillance infrastructure may not be able to keep up with
another VOC. For example, the United States and the United the greater number of persons seeking testing for symptoms or
Kingdom are currently experiencing upsurges in Omicron cases exposure. Extensive media coverage of the Omicron variant
amid ongoing Delta outbreaks. Future work will examine the may also be promoting behavioral changes that could slow the
interaction of VOCs within an outbreak and Omicron’s potential outbreak. Conversely, populations experiencing pandemic
for a viral sweep. fatigue could disregard reports of new outbreaks, relaxing
Limitations preventative behaviors and leading to additional transmissions.
Finally, the recently concluded holiday season likely increased
Our study reports on data current up through January 17, 2022. human interactions as it did a year ago. The results presented
Adverse outcomes are likely to increase because the Omicron in this study suggest it takes fewer cases of Omicron to initiate
outbreak has not had sufficient time to realize morbidity, an outbreak than Delta, Beta, Alpha, and the original
mortality, severity, transmissibility, and evasiveness. Our data SARS-CoV-2. Even if Omicron results in lesser disease severity
are limited by the granularity of country reporting. Data are than prior VOCs, hospitals may expect a high caseload of
reported on a national level for countries within SSA, which patients because Omicron is highly transmissible. The world
precludes intranational analyses that would more closely reflect should plan how to flatten the curve given the speed,
local regulations and better contextualize national trends. In acceleration, jerk, and persistence of Omicron.
addition, suboptimal public health infrastructure prevents data
Acknowledgments
This study was supported by the Institute for Global Health at Northwestern University; Feed the Future through the United States
Agency for International Development (USAID), under the terms of contract number 7200LA1800003 and Feed the Future
Innovation Lab for Collaborative Research on Sustainable Intensification (grant number AID-OAA-L-14-00006) at Kansas State
University; and the DAVEE Innovations Research Innovations grant. The opinions expressed herein are those of the authors and
do not necessarily reflect the views of the USAID or the authors’ organizations.
Conflicts of Interest
None declared.
Multimedia Appendix 1
Daily SARS-CoV-2 surveillance complete file.
[DOCX File , 102 KB-Multimedia Appendix 1]
https://publichealth.jmir.org/2022/1/e35763 JMIR Public Health Surveill 2022 | vol. 8 | iss. 1 | e35763 | p. 15
(page number not for citation purposes)
XSL• FO
RenderXJMIR PUBLIC HEALTH AND SURVEILLANCE Lundberg et al
References
1. Schreiber M. The scientist in Botswana who identified omicron was saddened by the world's reaction. NPR. URL: https:/
/tinyurl.com/at2c6u3n [accessed 2022-01-25]
2. Callaway E. Heavily mutated Omicron variant puts scientists on alert. Nature 2021 Dec 25;600(7887):21-21. [doi:
10.1038/d41586-021-03552-w] [Medline: 34824381]
3. Callaway E, Ledford H. How bad is Omicron? What scientists know so far. Nature 2021 Dec 02;600(7888):197-199. [doi:
10.1038/d41586-021-03614-z] [Medline: 34857948]
4. Post LA, Oehmke JF. The Global SARS-CoV-2 Surveillance Project (GASSP). Northwestern University. URL: https:/
/sites.northwestern.edu/covidglobalsurveillance/ [accessed 2022-01-24]
5. Omicron detected in 89 countries and cases are doubling fast, says World Health Organization. CBS News. 2021 Dec 18.
URL: https://www.cbsnews.com/news/omicron-89-countries-cases-doubling-fast-world-health-organization/ [accessed
2022-01-25]
6. Corum J, Zimmer C. Tracking Omicron and Other Coronavirus Variants. The New York Times. URL: https://www.
nytimes.com/interactive/2021/health/coronavirus-variant-tracker.html [accessed 2022-01-25]
7. Li C, Noreen S, Zhang L, Saeed M, Wu P, Ijaz M, et al. A critical analysis of SARS-CoV-2 (COVID-19) complexities,
emerging variants, and therapeutic interventions and vaccination strategies. Biomed Pharmacother 2022 Feb;146:112550
[FREE Full text] [doi: 10.1016/j.biopha.2021.112550] [Medline: 34959116]
8. Assessment of the further emergence of the SARS-CoV-2 Omicron VOC in the context of the ongoing Delta VOC
transmission in the EU/EEA, 18th update. ECDC. URL: https://www.ecdc.europa.eu/en/publications-data/
covid-19-assessment-further-emergence-omicron-18th-risk-assessment [accessed 2022-01-25]
9. Planas D, Saunders N, Maes P, Guivel-Benhassine F, Planchais C, Buchrieser J, et al. Considerable escape of SARS-CoV-2
Omicron to antibody neutralization. Nature 2021 Dec 23:2021. [doi: 10.1038/s41586-021-04389-z] [Medline: 35016199]
10. Schoub BD. Covid-19: Known Knowns, Known Unknowns, and Unknown Unknowns. Israel Journal of Foreign Affairs
2021 Dec 06:1-10. [doi: 10.1080/23739770.2021.2003082]
11. Franklin J. Omicron is now the dominant COVID strain in the U.S., making up 73% of new infections. NPR. 2021 Dec 20.
URL: https://tinyurl.com/4bru9h5e [accessed 2022-01-25]
12. Tracking SARS-CoV-2 variants. World Health Organization. URL: https://www.who.int/en/activities/
tracking-SARS-CoV-2-variants/ [accessed 2021-09-10]
13. Le Page M. The omicron wave. New Scientist 2021 Dec;252(3364):7. [doi: 10.1016/s0262-4079(21)02185-0]
14. Vaughan A. Omicron emerges. New Scientist 2021 Dec;252(3363):7. [doi: 10.1016/s0262-4079(21)02140-0]
15. Abhilash KP. Alpha, delta and now Omicron: When will the COVID-19 pandemic end? Curr Med Issues 2021;19(4):221.
[doi: 10.4103/cmi.cmi_93_21]
16. Lu L, Mok BW, Chen LL, Chan JM, Tsang OT, Lam BH, et al. Neutralization of SARS-CoV-2 Omicron variant by sera
from BNT162b2 or Coronavac vaccine recipients. Clin Infect Dis 2021 Dec 16 [FREE Full text] [doi: 10.1093/cid/ciab1041]
[Medline: 34915551]
17. Gao S, Guo H, Luo G. Omicron variant (B.1.1.529) of SARS-CoV-2, a global urgent public health alert!. J Med Virol 2021
Nov 30:1. [doi: 10.1002/jmv.27491] [Medline: 34850421]
18. Oróstica KY, Contreras S, Mohr SB, Dehning J, Bauer S, Medina-Ortiz D, et al. Mutational signatures and transmissibility
of SARS-CoV-2 Gamma and Lambda variants. ArXiv Preprint posted online on August 23, 2021 [FREE Full text]
19. Post L, Culler K, Moss CB, Murphy RL, Achenbach CJ, Ison MG, et al. Surveillance of the Second Wave of COVID-19
in Europe: Longitudinal Trend Analyses. JMIR Public Health Surveill 2021 Apr 28;7(4):e25695 [FREE Full text] [doi:
10.2196/25695] [Medline: 33818391]
20. Post LA, Lin JS, Moss CB, Murphy RL, Ison MG, Achenbach CJ, et al. SARS-CoV-2 Wave Two Surveillance in East Asia
and the Pacific: Longitudinal Trend Analysis. J Med Internet Res 2021 Feb 01;23(2):e25454 [FREE Full text] [doi:
10.2196/25454] [Medline: 33464207]
21. Post L, Marogi E, Moss CB, Murphy RL, Ison MG, Achenbach CJ, et al. SARS-CoV-2 Surveillance in the Middle East
and North Africa: Longitudinal Trend Analysis. J Med Internet Res 2021 Jan 15;23(1):e25830 [FREE Full text] [doi:
10.2196/25830] [Medline: 33302252]
22. Post L, Ohiomoba RO, Maras A, Watts SJ, Moss CB, Murphy RL, et al. Latin America and the Caribbean SARS-CoV-2
Surveillance: Longitudinal Trend Analysis. JMIR Public Health Surveill 2021 Apr 27;7(4):e25728 [FREE Full text] [doi:
10.2196/25728] [Medline: 33852413]
23. Post LA, Argaw ST, Jones C, Moss CB, Resnick D, Singh LN, et al. A SARS-CoV-2 Surveillance System in Sub-Saharan
Africa: Modeling Study for Persistence and Transmission to Inform Policy. J Med Internet Res 2020 Nov 19;22(11):e24248
[FREE Full text] [doi: 10.2196/24248] [Medline: 33211026]
24. Post LA, Benishay ET, Moss CB, Murphy RL, Achenbach CJ, Ison MG, et al. Surveillance Metrics of SARS-CoV-2
Transmission in Central Asia: Longitudinal Trend Analysis. J Med Internet Res 2021 Feb 03;23(2):e25799 [FREE Full
text] [doi: 10.2196/25799] [Medline: 33475513]
https://publichealth.jmir.org/2022/1/e35763 JMIR Public Health Surveill 2022 | vol. 8 | iss. 1 | e35763 | p. 16
(page number not for citation purposes)
XSL• FO
RenderXJMIR PUBLIC HEALTH AND SURVEILLANCE Lundberg et al
25. Post LA, Issa TZ, Boctor MJ, Moss CB, Murphy RL, Ison MG, et al. Dynamic Public Health Surveillance to Track and
Mitigate the US COVID-19 Epidemic: Longitudinal Trend Analysis Study. J Med Internet Res 2020 Dec 03;22(12):e24286
[FREE Full text] [doi: 10.2196/24286] [Medline: 33216726]
26. Oehmke JF, Moss CB, Singh LN, Oehmke TB, Post LA. Dynamic Panel Surveillance of COVID-19 Transmission in the
United States to Inform Health Policy: Observational Statistical Study. J Med Internet Res 2020 Oct 5;22(10):e21955. [doi:
10.2196/21955]
27. Oehmke JF, Oehmke TB, Singh LN, Post LA. Dynamic Panel Estimate-Based Health Surveillance of SARS-CoV-2 Infection
Rates to Inform Public Health Policy: Model Development and Validation. J Med Internet Res 2020 Sep 22;22(9):e20924
[FREE Full text] [doi: 10.2196/20924] [Medline: 32915762]
28. Oehmke TB, Post LA, Moss CB, Issa TZ, Boctor MJ, Welch SB, et al. Dynamic Panel Data Modeling and Surveillance of
COVID-19 in Metropolitan Areas in the United States: Longitudinal Trend Analysis. J Med Internet Res 2021 Feb
09;23(2):e26081 [FREE Full text] [doi: 10.2196/26081] [Medline: 33481757]
29. Welch SB, Kulasekere DA, Prasad PVV, Moss CB, Murphy RL, Achenbach CJ, et al. The Interplay Between Policy and
COVID-19 Outbreaks in South Asia: Longitudinal Trend Analysis of Surveillance Data. JMIR Public Health Surveill 2021
Jun 17;7(6):e24251 [FREE Full text] [doi: 10.2196/24251] [Medline: 34081593]
30. SARS-CoV-2 test tracker. FIND. URL: https://www.finddx.org/covid-19/test-tracker/ [accessed 2020-09-09]
31. FINDCov19TrackerData. GitHub. URL: https://github.com/dsbbfinddx/FINDCov19TrackerData [accessed 2022-01-25]
32. Sigmund M, Ferstl R. Panel vector autoregression in R with the package panelvar. The Quarterly Review of Economics
and Finance 2021 May;80:693-720. [doi: 10.1016/j.qref.2019.01.001]
33. Croissant Y. plm: Linear Models for Panel Data. URL: https://cran.r-project.org/web/packages/plm/plm.pdf [accessed
2020-08-31]
34. Post L, Marogi E, Moss CB, Murphy RL, Ison MG, Achenbach CJ, et al. SARS-CoV-2 Surveillance in the Middle East
and North Africa: Longitudinal Trend Analysis. J Med Internet Res 2021 Jan 15;23(1):e25830 [FREE Full text] [doi:
10.2196/25830] [Medline: 33302252]
35. Adekunle IA, Onanuga AT, Akinola OO, Ogunbanjo OW. Modelling spatial variations of coronavirus disease (COVID-19)
in Africa. Sci Total Environ 2020 Aug 10;729:138998 [FREE Full text] [doi: 10.1016/j.scitotenv.2020.138998] [Medline:
32361455]
36. Liu L, Moon HR, Schorfheide F. Panel forecasts of country-level Covid-19 infections. J Econom 2021 Jan;220(1):2-22
[FREE Full text] [doi: 10.1016/j.jeconom.2020.08.010] [Medline: 33100475]
37. Chen X, Qui Z. Scenario analysis of non-pharmaceutical interventions on global COVID-19 transmissions. ArXiv Preprint
posted online on April 7, 2020 [FREE Full text]
38. Papadamou S, Fassas A, Kenourgios D, Dimitriou D. Direct and Indirect Effects of COVID-19 Pandemic on Implied Stock
Market Volatility: Evidence from Panel Data Analysis. MPRA. 2020. URL: https://mpra.ub.uni-muenchen.de/100020/
[accessed 2022-01-25]
39. GISAID Initiative. URL: https://www.gisaid.org/ [accessed 2022-01-25]
40. Huddleston J, Hadfield J, Sibley T, Lee J, Fay K, Ilcisin M, et al. Augur: a bioinformatics toolkit for phylogenetic analyses
of human pathogens. J Open Source Softw 2021 Jan;6(57):2906 [FREE Full text] [doi: 10.21105/joss.02906] [Medline:
34189396]
41. Rambaut A, Holmes EC, O'Toole Á, Hill V, McCrone JT, Ruis C, et al. Addendum: A dynamic nomenclature proposal for
SARS-CoV-2 lineages to assist genomic epidemiology. Nat Microbiol 2021 Mar 29;6(3):415-415 [FREE Full text] [doi:
10.1038/s41564-021-00872-5] [Medline: 33514928]
42. O'Toole Á, Scher E, Underwood A, Jackson B, Hill V, McCrone JT, et al. Assignment of epidemiological lineages in an
emerging pandemic using the pangolin tool. Virus Evol 2021;7(2):veab064 [FREE Full text] [doi: 10.1093/ve/veab064]
[Medline: 34527285]
43. Singh J, Rahman SA, Ehtesham NZ, Hira S, Hasnain SE. SARS-CoV-2 variants of concern are emerging in India. Nat Med
2021 Jul 27;27(7):1131-1133. [doi: 10.1038/s41591-021-01397-4] [Medline: 34045737]
44. Dynamic map of transmission - SARS-CoV-2 Africa. URL: https://northwestern.app.box.com/s/
0rfk2nzrorqhkyqpt9sstjiozkjdw793 [accessed 2022-01-26]
45. Espenhain L, Funk T, Overvad M, Edslev SM, Fonager J, Ingham AC, et al. Epidemiological characterisation of the first
785 SARS-CoV-2 Omicron variant cases in Denmark, December 2021. Euro Surveill 2021 Dec;26(50):2021 [FREE Full
text] [doi: 10.2807/1560-7917.ES.2021.26.50.2101146] [Medline: 34915977]
46. Ferguson N, Ghani Z, Cori A, Hogan A, Hinsley W, Volz E. Report 49: Growth, population distribution and immune escape
of Omicron in England. Imperial College COVID-19 response team. 2021 Dec 16. URL: https://spiral.imperial.ac.uk/
bitstream/10044/1/93038/32/2021-12-16%20COVID19%20Report%2049.pdf [accessed 2022-01-25]
47. Pulliam JRC, van Schalkwyk C, Govender N. Increased risk of SARS-CoV-2 reinfection associated with emergence of the
Omicron variant in South Africa. MedRxiv Preprint published online on December 2, 2021. [doi:
10.1101/2021.11.11.21266068]
https://publichealth.jmir.org/2022/1/e35763 JMIR Public Health Surveill 2022 | vol. 8 | iss. 1 | e35763 | p. 17
(page number not for citation purposes)
XSL• FO
RenderXJMIR PUBLIC HEALTH AND SURVEILLANCE Lundberg et al
48. Discovery Health releases at-scale real-world analysis of Omicron outbreak; including collaboration with the SA Medical
Research Council (SAMRC) to analyse vaccine effectiveness. Discovery Health. URL: https://www.discovery.co.za/
corporate/health-insights-omicron-outbreak-analysis [accessed 2022-01-25]
49. Gardner BJ, Kilpatrick M. Estimates of reduced vaccine effectiveness against hospitalization, infection, transmission and
symptomatic disease of a new SARS-CoV-2 variant, Omicron (B. 1.1. 529), using neutralizing antibody titers. Medrxiv
Preprint published online on December 12, 2021. [doi: 10.1101/2021.12.10.21267594]
50. Paul A, Chatterjee S, Bairagi N. Prediction on Covid-19 epidemic for different countries: Focusing on South Asia under
various precautionary measures. Medrxiv Preprint published online on April 11, 2020. [doi: 10.1101/2020.04.08.20055095]
51. Post LA, Argaw ST, Jones C, Moss CB, Resnick D, Singh LN, et al. A SARS-CoV-2 Surveillance System in Sub-Saharan
Africa: Modeling Study for Persistence and Transmission to Inform Policy. J Med Internet Res 2020 Nov 19;22(11):e24248
[FREE Full text] [doi: 10.2196/24248] [Medline: 33211026]
52. Post LA, Lin JS, Moss CB, Murphy RL, Ison MG, Achenbach CJ, et al. SARS-CoV-2 Wave Two Surveillance in East Asia
and the Pacific: Longitudinal Trend Analysis. J Med Internet Res 2021 Feb 01;23(2):e25454 [FREE Full text] [doi:
10.2196/25454] [Medline: 33464207]
Abbreviations
CDC: Centers for Disease Control and Prevention
GISAID: Global Initiative on Sharing Avian Influenza Data
SSA: sub-Saharan Africa
VOC: variant of concern
VOI: variant of interest
Edited by G Eysenbach; submitted 22.12.21; peer-reviewed by C Moss, A Joseph, R Rastmanesh; comments to author 13.01.22;
revised version received 17.01.22; accepted 22.01.22; published 31.01.22
Please cite as:
Lundberg AL, Lorenzo-Redondo R, Ozer EA, Hawkins CA, Hultquist JF, Welch SB, Prasad PVV, Oehmke JF, Achenbach CJ, Murphy
RL, White JI, Havey RJ, Post LA
Has Omicron Changed the Evolution of the Pandemic?
JMIR Public Health Surveill 2022;8(1):e35763
URL: https://publichealth.jmir.org/2022/1/e35763
doi: 10.2196/35763
PMID: 35072638
©Alexander L Lundberg, Ramon Lorenzo-Redondo, Egon A Ozer, Claudia A Hawkins, Judd F Hultquist, Sarah B Welch, PV
Vara Prasad, James F Oehmke, Chad J Achenbach, Robert L Murphy, Janine I White, Robert J Havey, Lori Ann Post. Originally
published in JMIR Public Health and Surveillance (https://publichealth.jmir.org), 31.01.2022. This is an open-access article
distributed under the terms of the Creative Commons Attribution License (https://creativecommons.org/licenses/by/4.0/), which
permits unrestricted use, distribution, and reproduction in any medium, provided the original work, first published in JMIR Public
Health and Surveillance, is properly cited. The complete bibliographic information, a link to the original publication on
https://publichealth.jmir.org, as well as this copyright and license information must be included.
https://publichealth.jmir.org/2022/1/e35763 JMIR Public Health Surveill 2022 | vol. 8 | iss. 1 | e35763 | p. 18
(page number not for citation purposes)
XSL• FO
RenderXYou can also read