Health Care Costs in Prince Edward Island - Institute of Fiscal ...
←
→
Page content transcription
If your browser does not render page correctly, please read the page content below
Past, Present, Future
   Health Care Costs in
   Prince Edward Island

                      Spring 2017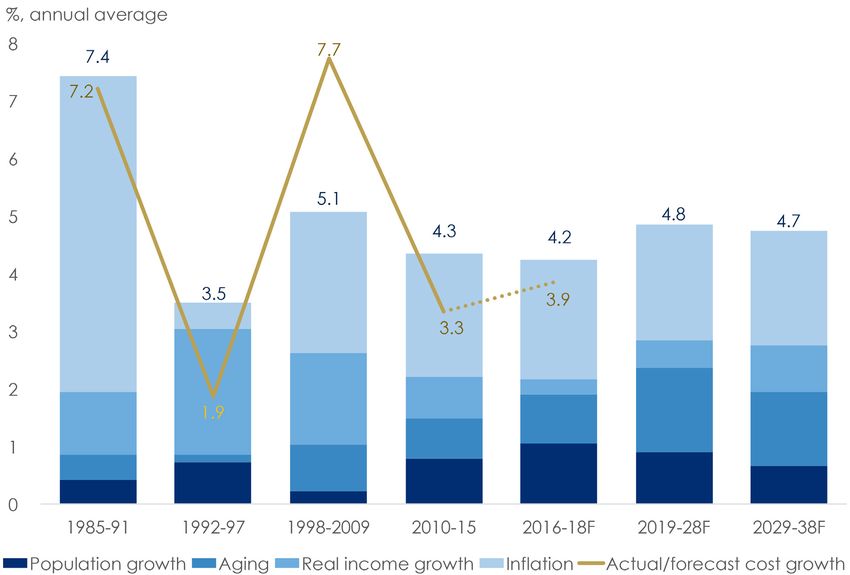
About this Document
The Institute of Fiscal Studies and Democracy (IFSD) is a Canadian think-tank sitting at the nexus of
public finance and state institutions. Fiscal ecosystems include governments, legislatures, the public
administration and other key actors and institutions in our political and economic life. This ecosystem,
rooted in hundreds of years of political history and economic development, is composed of an
intertwined set of incentives, public and private information and a complex and sometimes opaque set
of rules and processes based on constitutional law, legislative law, conventions and struggles for power.
The actors within this system depend on one another as well as the robustness and transparency
of information and processes, all underpinned by a society’s standards of accountability. It is at this
dynamic intersection of money and politics that the Institute of Fiscal Studies and Democracy @
uOttawa aims to research, advise, engage and teach. The IFSD has been funded by the Province of
Ontario to undertake applied research and student engagement in public finance and its intersection
with public administration, politics and public policy. The IFSD undertakes its work in Canada
at all levels of government as well as abroad, leveraging partnerships and key relationships with
organizations such as the World Bank, OECD, IMF and US National Governors Association.

This report was prepared by Randall Bartlett, Chief Economist, and Dominique Lapointe, Senior
Analyst, under the direction of Kevin Page. The report was designed by Jessica Rached and assembled
by AN Design Communications. The final report and any errors or omissions rest solely with the IFSD.

                                                                                       First Printing: April 2017
                                                                               No. 17009 - Prince Edward Island

1 Stewart Street, Suite 206
Ottawa, ON K1N 6N5
613-562-5800 x 5628

ifsd.ca | info@ifsd.ca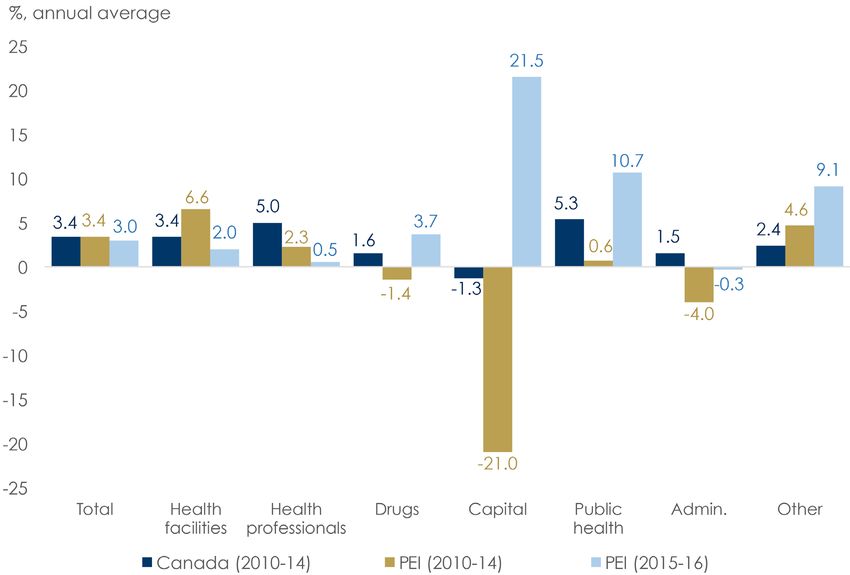
Key Points

• Over the past 30 years, health care spending in Prince Edward Island (PEI) has followed a similar
  pattern of peaks and troughs as that at the national level, tied to overall economic activity and
  fluctuations in federal funding. More generally, throughout this period, health spending has
  remained above the notional health care cost derived from the macroeconomic fundamentals of
  population growth, aging, real income growth, and inflation. And, in the coming years, this trend
  is expected to continue. Despite this gap, PEI remains in the ‘middle-of-the-pack’ among Canadian
  provinces in terms of health care costs per capita.

• More specifically, from 2010 to 2014, national health spending slowed relative to the previous
  decade. Meanwhile, in Prince Edward Island during this period, average health care spending
  growth was in line with the national average (3.4%). Notable differences between health spending
  growth in PEI and Canada as a whole in 2010 through 2014 were on health facilities (6.6%% versus
  3.4%) and other health spending (4.6% versus 2.4%). In contrast, spending on capital (-21.0%
  versus -1.3%), administration (-4.0% versus 1.5%), and drugs (-1.4% versus 1.6%) was lower in PEI
  over this period. The contraction in capital investment is a concern, although less so than in other
  jurisdictions as it has rebounded strongly in the last couple of years (21.5%). All other spending
  categories have also rebounded during this latter period except the two largest: health facilities
  (2.0%) and health professionals (0.5%). As a result, average annual growth in total health spending
  decelerated in 2015 and 2016, to 3.0%.

• In 2015, the Council of the Federation called on the federal government to commit to maintaining a
  25% participation in provincial health care expenditures (excluding transfers from the equalization
  program). In order to meet this request, the provinces and territories asked the federal government
  to commit to grow the Canadian Health Transfer (CHT) by 5.2% annually. Instead, the Government
  of Canada decided to move forward with an increase in the CHT tied to the pace of nominal GDP
  growth. An additional commitment of $11.5 billion over ten years was made for federal health
  priorities, namely mental health and home care, although much of this is back-end loaded to the
  end of the 5-year budget planning horizon. To date, all provinces have agreed to this offer, with the
  exception of Manitoba.

• As a result of this agreement, the federal share of national health spending will rise in the next few
  years as fiscal restraint among provinces and territories continues. This is also true in Prince Edward
  Island. However, as the underlying cost pressures keep rising due to the macroeconomic cost
  drivers, the Institute of Fiscal Studies and Democracy is forecasting a gradual decline in the federal
  share of health spending. Indeed, by 2026, the federal share will have fallen below its current level.
  And if health spending restraint is relaxed, the federal share will fall even further.

• In summary, while additional federal funds dedicated to home care and mental health will
  provide modest support to provincial finances, this agreement is neither sufficient nor
  transformative in helping the provinces to meet the health care needs of their citizens. And
  given the back-end loaded nature of additional health funding, the larger concern is that
  health care reforms have been largely punted to beyond the 2019 election.

                                                   3
In its recent publication, ‘CHT Conundrum: Ontario Case Study’, the Institute of Fiscal Studies and
Democracy (IFSD) outlined an approach to examining historical health care spending while projecting
the drivers of health care costs over the coming 20 years.1 Summarizing the historical results for Prince
Edward Island (PEI) here, health care spending growth can be divided into four distinct periods:
1985–1991, 1992–1997, 1998–2009, and 2010–2016 (see Chart 1). These time periods are important
as they overlap with distinct periods of higher economic growth and federal transfers to the provinces
in the case of the 1985–1991 and 1998–2009 periods, and the opposite circumstance in the case of the
1992–1997 and 2010–2016 periods.
Chart 1: Annual Growth in Total Health Expenditures in Prince Edward Island
Source: Canadian Institute for Health Information, Institute of Fiscal Studies and Democracy.
Note: Years refer to fiscal years. Numbers include both public and private health expenditures. Period ends in fiscal 2016–17.
While each of these periods was characterized by very different economic and fiscal circumstances,
they were also reflective of different underlying health care cost drivers in Prince Edward Island. For
instance, the higher expenditure growth years of the 1980s were the result of significant increases
in spending across most spending categories, with the average growth in expenditures on drugs
(26.1%) and other health spending (12.8%) topping the list. In contrast, capital investment (-1.6%)
declined over this period. Then, in the more austere years of the 1990s, health care expenditures
averaged a more modest 1.9% annually, as expenditures on capital (-4.3%) contracted. Other areas
of health spending remained positive over this period but advanced at a much slower pace than was
previously the case, the exception being spending on administration (6.1%). Fast forward to the
balanced federal budgets and solid economic growth of the late-1990s and early-2000s, and spending
resumed anew. This time, the advance was led by capital investment (17.2%), complemented by
notable gains in expenditures on administration (12.7%) and drugs (11.2%), although all sectors saw
spending accelerate.
1
See ‘CHT and the Federation: Past, Present, and Future’ for references.
4Then the 2008–09 recession hit, and own-source revenue growth in Prince Edward Island turned negative.
With revenues hobbled by weak economic activity, the provincial government needed to find savings. And,
indeed, it did. From 2010 through 2014, average total health care expenditure growth in PEI was constrained
to 3.4% annually—in line with the national average and less than half the pace of the previous decade (see
Chart 2). While spending was restrained in most expenditures categories, much of the savings were found in
contracting capital investment (-21.0%), as well as spending on administration (-4.0%) and drugs (-1.4%).
The contraction in capital investment is a concern, although less so than in other jurisdictions as it has
rebounded strongly in the last couple of years (21.5%). All other spending categories have also rebounded
during this latter period except the two largest: health facilities (2.0%) and health professionals (0.5%). As
a result, average annual growth in total health spending decelerated in 2015 and 2016 to 3.0%. Importantly,
these aggregate savings took place at a time when the Canada Health Transfer (CHT)—the federal
government’s dedicated funding for health care—was increasing at an annual rate of 6%, meaning the CHT
share of PEI’s health spending rose over this period.
Chart 2: Growth in Health Spending by Category
Source: Canadian Institute for Health Information, Institute of Fiscal Studies and Democracy.
Note: Years refer to fiscal years. Health facilities include hospitals and other institutions. Health professionals include physicians and other professionals.
National health data by spending category is only available through the 2014–15 fiscal year. Numbers include both public and private health expenditures.
“Other health spending” includes expenditures on home care, medical transportation (ambulances), hearing aids, other appliances and prostheses, health
research and miscellaneous health care.
Looking ahead to the next few years, growth in health care costs in Prince Edward Island is expected
to outpace the 3.3% annual average observed from 2010 through 2015, accelerating modestly to 3.9%.
This is only slightly less than the 4.2% growth suggested by the macroeconomic drivers of health care
costs—population growth, aging, real income growth, and inflation—over the 2016 to 2018 period (see
Chart 3).2 Beyond 2018, cost pressures are expected to advance at an annual pace of nearly 5% for the
subsequent 20 years, due to a significant aging of the PEI population over this period (see Table 1).
2
Similar to the recent work of the Financial Accountability Officer (2017) based on analysis by the Organisation for Economic Co-operation and Development
(OECD, 2013), a real income elasticity of health care expenditures of 0.8 was used in this analysis.
5Chart 3: Growth in Actual versus Notional Health Care Costs
Source: CIHI, Prince Edward Island Ministry of Finance, Statistics Canada, Institute of Fiscal Studies and Democracy.
Note: The IFSD estimates and forecasts assume no enrichment. Years refer to fiscal years. Numbers include both public and private health expenditures.
Table 1: Actual versus Notional Health Care Spending Growth in Prince Edward Island
%, annual average Actual/Budget Enrichment* Notional Population Aging Real Income Inflation
1985–1991 7.2 -0.2 7.4 0.4 0.4 1.1 5.5
1992–1997 1.9 -1.6 3.5 0.7 0.1 2.2 0.5
1998–2009 7.7 2.7 5.1 0.2 0.8 1.6 2.4
2010–2015 3.3 -1.0 4.3 0.8 0.7 0.7 2.1
2016–2018 3.9 -0.4 4.2 1.1 0.8 0.3 2.1
2019–2028 4.8 0.9 1.5 0.5 2.0
2029–2038 4.7 0.7 1.3 0.8 2.0
Source: CIHI, Prince Edward Island Ministry of Finance, Statistics Canada, Institute of Fiscal Studies and Democracy.
Note: Growth forecasts for health spending, real GDP, and GDP inflation are taken from the most recent budget documents for the period 2016 to 2018.
Population projections are from the M1 (medium) scenario from Statistics Canada. Numbers include both public and private health expenditures.
*Enrichment is equal to actual less notional health spending growth.
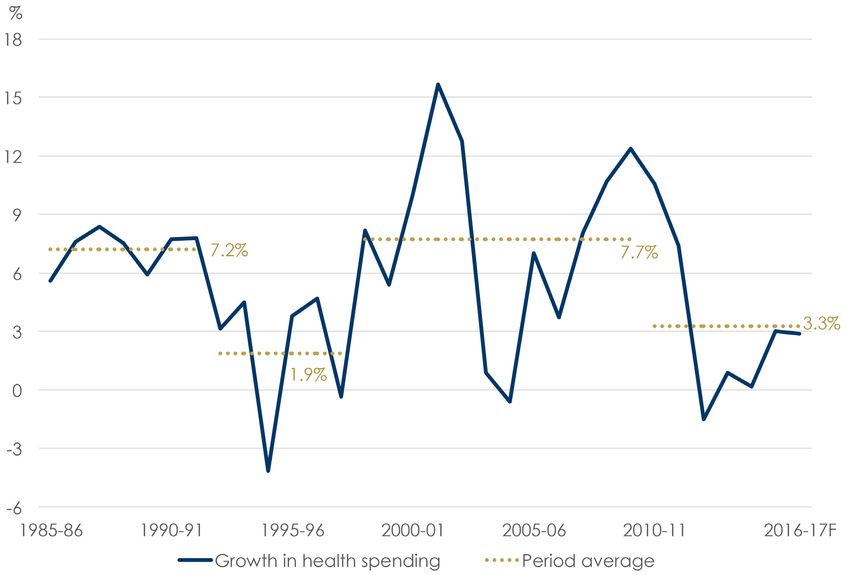
Examining the planned savings over the next few years in a historical context, it becomes clear that
health spending has been higher than that suggested by the underlying macroeconomic cost drivers
since the late-1990s (see Chart 4). However, this began to change over the 2010 to 2015 period, with
lower spending growth having slightly closed the gap with the macroeconomic fundamentals. In the
next couple of years, the spending gap is expected to remain relatively stable. Still, according to the
Canadian Institute for Health Information (CIHI), Prince Edward Island exhibits a lower per capita cost
of health care than Alberta, Manitoba, Newfoundland & Labrador, Saskatchewan, and the territories.
PEI also received a solid grade from the Conference Board of Canada on the health status of its
population, ranking as well as higher-cost Alberta and outperforming all other Atlantic Provinces (see
6Table 2). Indeed, this conclusion is further supported by a broad collection of health care indicators
compiled by CIHI.
Chart 4: Actual/Forecast Health Spending versus Notional Costs
Source: CIHI, Prince Edward Island Ministry of Finance, Statistics Canada, Institute of Fiscal Studies and Democracy.
Note: The IFSD estimates and forecasts assume no enrichment. Years refer to fiscal years. The notional estimate is indexed to the 1981 level of total health
care expenditures, as estimated by CIHI. Numbers include both public and private health expenditures.
Table 2: Relative Ranking of Population Health Status, Health Care System Performance, and Per Capita Cost
Ranking Health Status (Conference Board) Health Care System Performance (CIHI/IFSD) Per Capita Cost (CIHI)
1 British Columbia Ontario Quebec
2 Ontario Quebec Ontario
3 Quebec New Brunswick British Columbia
4 Prince Edward Island Prince Edward Island New Brunswick
5 Alberta Alberta Nova Scotia
6 New Brunswick British Columbia Prince Edward Island
7 Nova Scotia Newfoundland & Labrador Manitoba
8 Manitoba Manitoba Saskatchewan
9 Saskatchewan Nova Scotia Alberta
10 Newfoundland & Labrador Saskatchewan Newfoundland & Labrador
11 Yukon Yukon Yukon
12 Northwest Territories Nunavut Northwest Territories
13 Nunavut Northwest Territories Nunavut
Source: Conference Board of Canada, Canadian Institute for Health Information (CIHI), Institute of Fiscal Studies and Democracy (IFSD).
Note: Ranking calculations of health care system performance using CIHI data were done by the IFSD, by assigning values to above average (1), average
(0), or below average (-1) performance for 15 indicators and then ranking the totals. Per capita cost ranking is from lowest to highest using CIHI data
from 2014.
7This analysis must now be put in the context of the recent health care funding negotiation between the
federal government and provincial-territorial (P-T) governments. The IFSD has found that the Province of
Prince Edward Island will win in the short run but lose in the long run as a result of having signed on to the
health funding offer proposed by the federal government (see Chart 5). In December 2016, P-T governments
were unanimous in their resolve to see the CHT advance at an annual pace of 5.2%, which they projected to
be the average annual growth rate in national health care costs over the coming decade. Instead, the federal
government’s proposal, which was later confirmed in Budget 2017, would see federal health funding (the
CHT plus modest new supplementary measures) increase at an average annual pace of 3.6%, well below that
desired by P-T governments. This reflects the fact that any new money beyond that pledged by the previous
federal government is back-end loaded to the end of the 5-year fiscal planning horizon. As a result, the
federal government’s contribution to national health care expenditures is expected to fall to just over 20%
by 2026. Given the PEI’s per capita cost of health care spending is slightly above the national average, health
transfers make up a lower-than-average share of health care expenditures compared to other provinces. If
PEI’s health care costs were to advance by 5.2% annually, the federal share of health spending would follow a
pattern similar to that observed at the national level over the next decade.
Chart 5: CHT Share of Health Care Costs for Canada and PEI
Source: CIHI, Prince Edward Island Ministry of Finance, Finance Canada, Statistics Canada, Institute of Fiscal Studies and Democracy.
Note: Years refer to fiscal years. Numbers include both public and private health expenditures.
But the story changes when one takes into account official health care spending forecasts from the
Government of Prince Edward Island and the IFSD’s projections of the macroeconomic drivers of health
care costs starting in 2019. With growth in the CHT expected to outpace health care spending growth in PEI
through 2018, federal funding will assume an increasingly large portion of health care expenditures over
the next few years (see Table 3). Then, starting in 2019, the federal share of health spending will begin to
decline, ultimately reaching a level in 2026 below the 2016 level. And if the CHT were assumed to advance at
a similar pace thereafter, the federal share of PEI’s health spending would likely continue to decline.
8Table 3: Federal Funding for Health Care in Prince Edward Island
Federal Health Canada Health New Supplementary Amount Received Projected Provincial Federal Share of
$ billions Funding* Transfer Measures by Province Health Costs Health Costs (%)
2013 30.3 30.3 0.1 0.6 20.2%
2014 32.1 32.1 0.1 0.6 21.3%
2015 34.0 34.0 0.1 0.6 22.0%
2016 36.1 36.1 0.0 0.1 0.7 22.7%
2017 37.5 37.1 0.4 0.2 0.7 22.5%
2018 39.4 38.4 1.0 0.2 0.7 22.7%
2019 41.2 39.9 1.3 0.2 0.7 22.7%
2020 42.9 41.4 1.5 0.2 0.8 22.6%
2021 44.6 42.9 1.7 0.2 0.8 22.4%
2022 45.9 44.4 1.5 0.2 0.9 22.0%
2023 47.2 46.0 1.3 0.2 0.9 21.6%
2024 48.7 47.6 1.1 0.2 0.9 21.2%
2025 50.1 49.2 0.9 0.2 1.0 20.9%
2026 51.2 50.9 0.3 0.2 1.0 20.4%
Source: CIHI, Prince Edward Island Ministry of Finance, Statistics Canada, Finance Canada, Institute of Fiscal Studies and Democracy.
Note: Growth forecasts for health spending, real GDP, and GDP inflation are taken from the most recent budget documents for the period 2016 to
2018. The federal health funding forecast from fiscal 2016–17 through 2021–22 is from Budget 2017. Numbers include both public and private health
expenditures.
*Federal health funding includes the CHT and modest new supplementary measures from Budget 2017.
Conclusion
The Government of Prince Edward Island slowed the pace of growth in its health spending in recent
years, which has helped to bring its total health bill closer to where macroeconomic fundamentals
suggest it should be. But additional cost containment will be necessary to close this gap further. At
the same time, the quality and availability of health services in PEI are considered on par with some
of the best performing and much larger jurisdictions in Canada. For a comparatively small jurisdiction
with a rapidly aging population, this is good news. However, the fact that recent savings have been
weighted toward declining capital investment is disconcerting, although there are tentative signs that
the tide is turning in this regard. These continued savings also mean that the CHT will make up an
increasingly large share of PEI’s health spending over the next few years. But this won’t last long, as
the macroeconomic health care cost drivers are expected to be higher than the growth rate in the CHT
over the coming decade. Consequently, the federal contribution to health spending will fall through
2026, forcing PEI to disproportionately bear the burden of the additional health care costs beyond the
increases in federal health transfers. Indeed, much of the new federal funding in addition to the CHT
is back-loaded to the end of the 5-year fiscal planning horizon, and beyond the 2019 federal election.
This leads the IFSD to conclude that the Government of Prince Edward Island should have rejected the
federal government’s recent offer on health funding and held out for a better deal.
9INSTITUTE OF FISCAL STUDIES AND DEMOCRACY | INSTITUT DES FINANCES PUBLIQUES ET DE LA DÉMOCRATIE @ UOTTAWA
You can also read