HEALTH IMPACTS OF COAL FIRED POWER
       GENERATION IN TUZLA
←
→
Page content transcription
If your browser does not render page correctly, please read the page content below

HEALTH IMPACTS OF COAL FIRED POWER
GENERATION IN TUZLA
BOSNA I
              HERCEGOVINA

HEALTH IMPACTS OF COAL FIRED POWER
        GENERATION IN TUZLA

           Tuzla, november 2013.

             www.ekologija.ba        1
PUBLISHER:

Centar za ekologiju i energiju

M. i Ž. Crnogorčevića 8, 75000 Tuzla, BiH
Tel: +387 35 249 310, fax: +387 35 249 311
www.ekologija.ba

Authors:

Mike Holland , mike.holland@emrc.co.uk
Nurka Pranjić, pranjicnurka@hotmail.com

Centar za ekologiju i energiju

Denis Žiško

Stamp:

"OFF-SET" Tuzla

     The publication is produced within the framework of the project "Clean air for Tuzla"

2                                      www.ekologija.ba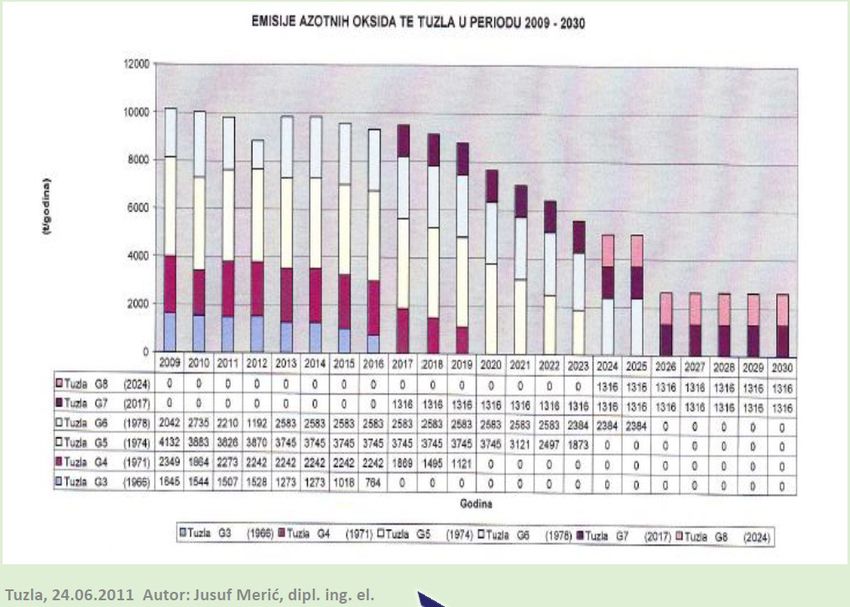
CONTENT

SUMMARY .................................................................................................................................. 4

1         INTRODUCTION ............................................................................................................. 5

    1.1   Air pollution and health .................................................................................................... 5

    1.2   Objectives of this report ................................................................................................... 6

2         TUZLA AND THE SURROUNDING AREAS .................................................................... 6

    2.1   The region ....................................................................................................................... 6

    2.2   Air quality in and around Tuzla ......................................................................................... 7

3         METHODS ...................................................................................................................... 9

    3.1   Scenarios ........................................................................................................................ 9

    3.2   The impact pathway approach ......................................................................................... 9

    3.3   Health impact assessment ............................................................................................ 10

    3.4   Exposure assessment ................................................................................................... 11

    3.5   Baseline data on the incidence of health impacts .......................................................... 12

    3.6   Monetisation of impacts ................................................................................................. 12

4         RESULTS ...................................................................................................................... 12

    4.1   Scenario 1: Total impact of the coal fired power plants at the European scale ............. 12

     4.1.1     Health impacts .......................................................................................................... 12

     4.1.2     Monetized values ...................................................................................................... 16

    4.2      Scenario 2: Total impact of exposure to pollution in the Tuzla region
             (irrespective of the source of pollution) ....................................................................... 17

     4.2.1     Health impacts .......................................................................................................... 17

     4.2.2     Monetized values ...................................................................................................... 18

5         DISCUSSION ................................................................................................................ 18

6         REFERENCES .............................................................................................................. 19

Appendix 1: Further information on health impacts ................................................................... 21

Appendix 2: Annual emissions of air pollutants by plant ........................................................... 22

                                                          www.ekologija.ba                                                                  3
SUMMARY

This report assesses the health impacts of an existing coal-fired power plant in Tuzla and two new coal-
fired plants that are planned to be built in the region. Emissions need to be seen against a background of
very high ambient concentrations. These are much in exceedance of the WHO Guideline for PM2.5 levels,
here regarded as the key air quality indicator, though we note that air quality limits for other pollutants,
notably SO2 are also exceeded. High exposure to SO2 is now very unusual in much of Europe, with
concentrations of the gas a small fraction of those in Tuzla in almost all EU cities.

The importance of air pollutant effects on health is emphasised by the recent decision by IARC (the
International Agency for Research on Cancer) to classify air pollution as a Group 1 carcinogen, with no
qualification on source or global region. The REVIHAAP (Review of Evidence of Health Aspects of Air
Pollutants) and HRAPIE (Health Risks of Air Pollution in Europe) studies led by WHO-Europe on behalf of
the European Commission provide a consensus view from European and North American experts that air
pollution has significant and varied impacts on health in addition to the cancers of concern to IARC. These
include reduced life expectancy, increased hospital admissions from respiratory and cardiac effects, the
development of bronchitis, and various lesser impacts, for example on lost working days. The HRAPIE
recommendations have been used for the analysis presented here.

The analysis presented in this report is performed from two perspectives. The first considers impacts of
the air pollutants released from the coal-fired power stations of the Tuzla region at the European scale,
bearing in mind the long-range transport of pollutant emissions and associated atmospheric chemistry.
The second considers the health impacts associated with current exposure of the population of the Tuzla
region, irrespective of source. Results at the European scale indicate that the existing power plant caused
an estimated 4,900 lost years of life expectancy to 131,000 lost working days and over 170 hospital
admissions for cardiac and respiratory illness in 2013. Although emissions associated with the proposed
new plant are lower, they will of course continue for many more years to come. Analysis addressing the
time series of emissions data for the plant over the period 2015 to 2030 indicate that total European scale
damage would be of the order €810 million, with over 39,000 life years lost and of course many more
new cases of chronic bronchitis, hospital admissions, lost working days and so on.

The following table shows annual impacts associated with population exposure in the Tuzla region
assuming that the monitoring sites provide a reliable indication of average conditions. Analysis is based
only on exosure to fine particles (PM2.5), so there is potential for additional effects from other pollutants.
Impacts are collectively valued at €61 million/year (prices adjusted for the Bosnian situation). We have
not been able to assess the effect of the power plants, specifically, on the local people, as this would
require further detailed dispersion modelling.

Table i) Annual impacts associated with PM2.5 concentrations in the Tuzla region

 Tuzla and Banovići                                                                        Impact
 Chronic Mortality (All ages) LYL median VOLY                   Life years lost            2,875
 Infant Mortality (0-1yr) median VSL                            Deaths                     3
 Chronic Bronchitis (27yr +)                                    Cases                      187
 Bronchitis in children aged 6 to 12                            Added cases                361
 Respiratory Hospital Admissions (All ages)                     Cases                      113
 Cardiac Hospital Admissions (>18 years)                        Cases                      81
 Restricted Activity Days (all ages)                            Days                       272,914
 Asthma symptom days (children 5-19yr)                          Days                       5,355
 Lost working days (15-64 years)                                Days                       69,924

In conclusion, air quality in the Tuzla region is poor and estimated here to have significant impacts on
population health. One source of this air pollution is the reliance on coal fired power generation which is
forecast to continue for many years to come as things stand. The effects of new power plant development
need to be seen against this background.

4                                            www.ekologija.ba
1        INTRODUCTION

        1.1      Air pollution and health

Air pollution is increasingly recognized as a significant threat to public health. A very recent development
is the decision by IARC (the International Agency for Research on Cancer) to classify outdoor air pollution
as carcinogenic to humans (Group 1), in relation to lung cancer (IARC, 2013). The Group 1 classification
is used where it is considered that the evidence of causality between an agent and an effect is clear. They
also noted a positive association with an increased risk of bladder cancer. Particulate matter, a major
component of outdoor air pollution, was evaluated separately and was also classified as carcinogenic
to humans (also Group 1). Although the composition of air pollution and levels of exposure can vary
dramatically between locations, the conclusions of the IARC Working Group apply to all regions of the
world. Further review work by WHO-Europe through the REVIHAAP and HRAPIE studies demonstrates
that the health impacts of air pollutants are not restricted to cancer, but include also respiratory and cardiac
mortality, bronchitis, hospital admissions, and various other effects.

Table 1 provides further information on the health risks of the pollutants with which this report is mainly
concerned, sulfur dioxide (SO2), nitrogen dioxide (NO2) and particulate matter (PM). It includes reference to
WHO guidelines and EU air quality limit values for the three pollutants, expressed in μg.m-3 (microgrammes,
10-6 g, per cubic metre of ambient air) and EU emission limit values for industrial plant expressed in
mg.m-3 (milligrammes, 10-3 g, per cubic metre of discharged gas). Information is based on both WHO
recommendations (see Krzyzanowski and Cohen, 2008) and Directives of the European Union. These
limit values can be compared with information for the Tuzla region and associated thermal power plants in
the sections that follow.

Further information on the health risks of air pollution is provided in Appendix 1.

Table 1. Health risks from various pollutants, pollutant guideline values for ambient air and limit values
(WHO recommendations, 2013)

                                                                         Air quality guidelines and
 Pollutant                    Related Health Risks (WHO)
                                                                         limit values
 Sulfur dioxide (SO2)         Can affect respiratory system and          WHO Guidelines.
                              lung functions, aggravation of asthma
                              and chronic bronchitis, makes              20 μg/m3 (day)
                              people more prone to infections
                              of the respiratory tract; irritation of    500μg/m3 (10min)
                              eyes; cardiac disease aggravated;
                              ischaemic stroke risk.                     EU Directive 2008/50/EC:

                                                                         125 μg/m3 (24 hours) , not to be
                                                                         exceeded > 3 times/year

                                                                         350 μg/m3 (1 hour) , not to be
                                                                         exceeded > 24 times/year

 Nitrogen oxides (NOx)        Asthma development (suspected),            WHO Air Quality Guidelines and
                              asthma      exacerbation,     chronic      EU Directive 2008/50/EC:
                              obstructive    pulmonary    disease,
                              stunted lung development; cardiac          NO2: 40 μg/m3 (annual)
                              arrhythmias, ischemic stroke.
                                                                         NO2: 200 μg/m3 (1 hour)
                              Reacts with VOCs in sunlight to form
                              ground- level ozone which is also
                              harmful to health.

                                              www.ekologija.ba                                                5
Particulate matter: Respiratory: asthma development WHO Guidelines:
(suspected), asthma exacerbation,
Coarse particulates chronic obstructive pulmonary PM2.5: 10 μg/m3 (year)
(PM10) disease, stunted lung development
(PM2.5); lung cancer PM10: 20 μg/m3 (year)
Fine particulates (PM2.5)
Cardiovascular: cardiac arrhythmias, EU Directive 2008/50/EC:
acute myocardial infarction,
congestive heart failure (PM2.5) PM2.5: 25 μg/m3 target (year)
Nervous system: ischaemic stroke. PM10: 40 μg/m3 (year) limit
PM10: 50 μg/m3 (day) limit, not to be
exceeded on > 35 days
Differences are apparent in the WHO Guideline and EU limit values for the concentration of pollutants
in ambient air. These differences reflect a view on the feasibility of achieving the WHO Guidelines in
the EU on the timescale of Directive 2008/50/EC. As will be seen below, the guideline/limit values do
not reflect thresholds for effects on health; impacts will still occur amongst sensitive individuals at lower
concentrations.
1.2 Objectives of this report
Extensive coal and lignite deposits around Tuzla have led to a reliance on these fuels for power generation
and wider industrial use. The following power stations are either in use, or planned, for the area:
○○ Tuzla Thermoelectric power plant (TET) blocks G3 to G6, with total installed capacity 730 MW,
using brown coal and lignite;
○○ Replacement block 7 of TE Tuzla with an installed capacity of 450 MW (Tais, 2010; Krstović,
2010; Merić, 2011);
○○ A new 300 MW thermoelectric plant in the Municipality of Banovići.
The purpose of this report is to quantify the health impacts associated with the existing plant and the two
additional plants that are planned to be developed in the coming years. This analysis is performed at two
scales. The first considers impacts of the power plants across Europe, recognizing that air pollutants can
be transported over distances in excess of 1000 km. The second seeks to describe the local impacts of
pollution. The methods used for this quantification reflect the latest advice provided by the World Health
Organization (WHO), as recommended in the HRAPIE (Health risks of air pollution in Europe) Project
performed for the European Commission, and accounting for the views of European and North American
health experts.
2 TUZLA AND THE SURROUNDING AREAS
2.1 The region
The Municipality of Tuzla is one of the 13 municipalities of the Tuzla Canton and covers an area of 294 km2
with a population of 132 000 inhabitants. The city of Tuzla is the administrative centre of the Canton and
is the largest economic centre of north-eastern Bosnia and Herzegovina. Around 75% of the population of
the municipality lives in the urban zone and the remaining population is located in rural local communities.
The Municipality of Banovići is located approximately 15 km southwest of Tuzla and has a population of
32,140. In addition to the urban areas of Banovići city, the Municipality includes the following villages:
Omazići, Turija, Čubrić, Breštica, Seona, Grivice, Banovići-village, Tulovići, Pribitak, Treštenica and Hrvati.
The area includes surface-coal-mines and the Turija and Grivice underground-coal-mines (Pranjić and
Salihović, 2003).
6 www.ekologija.baThe Tuzla region has substantial coal reserves, thought to be sufficient for 200 to 250 years use. These
reserves are estimated at 316 million tons of dark coal and 2.66 billion tons of lignite, equivalent to 24%
of Bosnia and Herzegovina’s total dark coal reserves and 66% of its lignite reserves. The mines are
facing technical and economic problems that reflect the competitiveness of thermal power plant electricity
production (Merić, 2011; Kazagić i sar., 2012).
2.2 Air quality in and around Tuzla
Figure 1 shows the location of the air pollutant monitoring stations in the Tuzla region relative to the
Thermal Power Plants (TPP).
Inspection of air quality data from these stations shows a significant number of exceedances of alert levels
(Musemić et al, 2012). Air quality during the heating season (winter) in the urban areas of Tuzla reaches
national category II or III (polluted or very-polluted air) with exceedance of permitted SO2 levels of 400 μg/
m3 (3 to 4 times the maximum allowable concentration). Levels of PM2.5 are also significantly higher in
Tuzla in winter (Hadžić et al, 2009). The same applies to Banovići (Figure 2).
Each year PM2.5 concentrations exceeded permissible limits in Tuzla (from +39 μg/m3 in 2004 on 4
occasions) to +52 μg/m3 in 2009 (> 5 times).The Air Quality Index (AQI) calculated during the period from
2003 to 2006 exceeded the 100 μg/m3 on up to 174 days per year and the 300 μg/m3 level up to 32 days
per year (Musemić et al. 2012).
Figure 1. Location of TPP Tuzla, TPP Banovići and the pollution monitoring stations.
www.ekologija.ba 7Figure 2. Variation in concentrations of SO2, NO2 and PM2.5 in 2012 in Banovići. Summary data on air quality in terms of annual average concentrations for 2012 are provided in Table 2. Trends in PM2.5 concentrations from 2008 to 2012 are shown in Figure 3, demonstrating persistent and substantial exceedance of both the EU target value for annual average concentration of 25 μg/m3 and, even more notably, the WHO Guideline of 10 μg/m3. Table 2. Annual average concentrations of air pollutants in the Tuzla region in 2012 (µg.m-3). Monitoring station SO2 PM2.5 NO2 Skver 55 52 38 BKC 56 40 35 Bukinje 58 41 23 Bektići No data 44 No data Cerik 43 No data 40 Banovići 61 38 21 Average for all sites 55 43 31 Figure 3. Mean PM2.5μg/m3 per year for the air quality monitoring stations in Tuzla and Banovići from 2008 to 2012. 8 www.ekologija.ba
The results demonstrate that air quality in the Tuzla region is poor, and thus likely to have a significant
impact on the health of the local population. It is against this background that the impact of additional coal-
fired power generation capacity must be considered.

         3        METHODS

         3.1      Scenarios

The health effects of air pollution are considered for the following situations:

Scenario 1: The total annual impact associated with the emissions from the three power plants at the
            European scale;
Scenario 2: The total impact associated with exposure to air pollution in the Tuzla region, irrespective of
            source;

         3.2      The impact pathway approach

Analysis follows the Impact Pathway Approach developed in the ExternE Project funded by the European
Commission through the 1990s. The IPA describes a logical pathway from emission through exposure of
the population to pollution to impact assessment and finally monetisation.

                                    1. Activity (e.g. demand for electricity)

                                                        ↓
                                       2. Emission (e.g. tonnes of SO2)

                                                        ↓
                                    3. Dispersion and atmospheric chemistry
             (e.g. including formation of secondary aerosols such as ammonium sulphate, µg.m3)

                                                        ↓
                            4. Exposure of the general population (people. µg.m3)

                                                        ↓
                            5. Exposure of population at risk from a specific effect
                                           (people at risk. µg.m3)

                                                        ↓
 6. Incidence of the health effect under analysis linked to the pollutant under investigation (e.g. hospital
                                               admissions)

                                                        ↓
                                     7. Monetisation of health impacts (€)

                   Figure 4. The impact pathway approach (ExternE, 1995; 1998; 2005)

The example shown in the Figure deals with assessment of the impacts of sulphur dioxide (SO2) emissions
on health, mediated through the formation of ‘secondary’ ammonium sulphate aerosols in the atmosphere1.
However, the same general approach works for any air pollutant.

1           ‘Primary’ particles, in contrast, are those emitted directly from combustion sources and numerous other
activities.

                                               www.ekologija.ba                                                  9
3.3 Health impact assessment
The core reference for the health impact assessment is the HRAPIE (Health Response to Air Pollutants
In Europe) Project coordinated by WHO-Europe for the European Commission, and bringing together a
large number of senior experts on the health effects of air pollution from Europe and North America (WHO-
Europe, 2013; and Holland, 2013, for a description of the practical implementation of the recommended
response functions). This is the most up to date review of the science available. For analysis for the
European Commission it supersedes the earlier work of Hurley et al (2005) developed under the Clean Air
For Europe (CAFE) Programme.
HRAPIE provides response functions for exposure to three pollutants, fine particles (PM2.5 or PM10), NO2
and ozone. No account was taken of effects of SO2 specifically, largely on the grounds that concentrations
of SO2 in EU cities are now very low (unlike the situation in Tuzla). The omission of effects of SO2 may
well lead to underestimation of the health impacts of air pollution in the Tuzla region. The following health
outcomes are considered (Table 3):
Table 3. Summary of information from HRAPIE showing endpoints for health impact assessment.
Relative risk from
Exposure
Effect Pollutant a 10μg.m-3 change
period
in exposure
All cause mortality, age 30+ PM Long 1.062
All cause mortality, age 30+ NO2 Long 1.055
All cause mortality O3 Short 1.0029
Respiratory mortality O3 Long 1.014
Post -neonatal infant mortality PM Long 1.04
Respiratory hospital admissions PM Short 1.019
Respiratory hospital admissions NO2 Short 1.018
Respiratory hospital admissions O3 Short 1.0044
CVD hospital admissions PM Short 1.0091
CVD hospital admissions O3 Short 1.0089
Bronchitic symptoms in asthmatic children NO2 Long 1.021
Prevalance of bronchitis in children PM Long 1.08
Incidence of chronic bronchitis in adults PM Long 1.117
Restricted activity days PM Short 1.047
Work loss days PM Short 1.046
Asthma symptoms in asthmatic children PM Short 1.028
Minor restricted activity days O3 Short 1.0154
The response functions shown are not fully additive. This applies especially to effects of long term exposure
to PM, NO2 and O3 on mortality, and to effects of PM on restricted activity days (RADs), work loss days and
childhood asthma. For effects of long term exposure on mortality, at the present time it is recommended
only to perform the quantification for PM. For the effects of PM on RADs (etc.) it is recommended to
subtract results for work loss days and childhood asthma from the result for RADs to avoid double counting.
The HRAPIE recommendations do not propose use of a threshold for quantification of impacts, except
(effectively) in the case of ozone. For ozone, only exposure above a level of 35 parts per billion is factored
into the analysis. This is stated to be an analytical ‘cut point’, above which the quantification of impacts
can be done with greater confidence than below. The authors are, however, quite clear that this is not a
threshold. Given the relative magnitude of impacts, however, the view that there is no threshold for effects
of exposure to particles is especially important. This has been re-inforced by the publication of Canadian
10 www.ekologija.baresearch that found no evidence for a threshold of effect even in areas where concentrations of particles were very low indeed (
Emission of NOx 9,843 t/year 1,316 t/year* 590 t/year***
Table 5. Annual emissions and associated health impacts at the European scale for the Tuzla power
station, Blocks G3-G6 in 2013.

 TET Blocks G3-G6                                        NOx          PM2.5          SO2          Total

 Emissions (tonnes/year)                                   9,843         1,990       51,661

 Chronic mortality (life years lost)                         755           327         3,835        4,918

 Infant mortality (1 – 11 months, cases)                         0             0            1              1

 Chronic bronchitis, population aged >27, cases                 35            15         180          231

 Respiratory hospital admissions, all ages                       3             1           13             17

 Cardiac hospital admissions, all ages                          24            10         122          157

 Restricted activity days (RADs) working age              76,571        33,154      388,748       498,473

 Work loss days                                           20,124         8,713      102,171       131,008

 Child asthma                                              1,895           820         9,620       12,335

 Child bronchitis                                            176              76         892        1,143

For TET Blocks G3-G6, damage is dominated by the high emissions of SO2, which are modelled through the
long range formation of sulphate aerosols in the PM2.5 size fraction. The effects of NOx (via the formation
of secondary nitrate aerosols) and direct emissions of PM2.5 generate about 20% of total estimated health
impacts for the plant.

Table 6. Annual emissions and associated health impacts at the European scale for the Tuzla power
station, proposed Block 7.

 TET Block 7                                             NOx          PM2.5          SO2          Total

 Emissions (tonnes/year)                                   1,316              86         877

 Chronic mortality (life years lost)                         101              14           65         180

 Infant mortality (1 – 11 months, cases)                         0             0            0              0

 Chronic bronchitis, population aged >27, cases                  5             1            3              8

 Respiratory hospital admissions, all ages                       0             0            0              1

 Cardiac hospital admissions, all ages                           3             0            2              6

 Restricted activity days (RADs) working age              10,237         1,429         6,599       18,266

 Work loss days                                            2,691           376         1,734        4,801

 Child asthma                                                253              35         163          452

 Child bronchitis                                               23             3           15             42

For the proposed block 7 addition to the Tuzla power plant it is emissions of NOx that are considered likely
to dominate, providing 56% of estimated health impact.

                                             www.ekologija.ba                                              13
Table 7. Annual emissions and associated health impacts at the European scale for the proposed
Banovići power station.
TPP Banovići NOx PM2.5 SO2 Total
Emissions (tonnes/year) 590 39 1,050
Chronic mortality (life years lost) 45 6 78 130
Infant mortality (1 – 11 months, cases) 0 0 0 0
Chronic bronchitis, population aged >27, cases 2 0 4 6
Respiratory hospital admissions, all ages 0 0 0 0
Cardiac hospital admissions, all ages 1 0 2 4
Restricted activity days (RADs) working age 4,590 650 7,901 13,141
Work loss days 1,206 171 2,077 3,454
Child asthma 114 16 196 325
Child bronchitis 11 1 18 30
SO2 emissions are again dominant for the proposed plant at Banovići. These results are dependent on
estimates of emissions made above in this report (Table 4), and reflect the factor 3 higher fuel sulphur
content between Banovići and Tuzla Block 7.
Results for all operational and proposed Blocks at the Tuzla power station are provided for the years 2013,
2015, 2020, 2025 and 2030 in Table 8, based on the emissions data provided in Appendix 2, noting the
retirement of old plant and introduction of new plant according to the following schedule:
G3: Up to 2016
G4: Up to 2019
G5: Up to 2023
G6: Up to 2025
G7 and Banovići: 2017
G8: 2024 to 2030
Table 8. Annual damage at the European scale from the power plants for Tuzla and Banovići, 2013 and
2015 to 2030 at 5-year intervals.
2013 NOx PM2.5 SO2 Total
Emissions (tonnes/year) 9,843 1,294 51,661
Chronic mortality (life years lost) 755 213 3,835 4,803
Infant mortality (1 – 11 months) 0 0 1 1
Chronic bronchitis, population aged >27 35 10 180 226
Respiratory hospital admissions, all ages 3 1 13 17
Cardiac hospital admissions, all ages 24 7 122 153
Restricted activity days (RADs) all ages 76,571 21,550 388,748 486,869
Work loss days 20,124 5,664 102,171 127,959
Child asthma, days 1,895 533 9,620 12,048
Child bronchitis, cases 176 49 892 1,117
14 www.ekologija.ba2015 NOx PM2.5 SO2 Total
Emissions (tonnes/year) 9,588 1,278 50,799
Chronic mortality (life years lost) 736 210 3,771 4,717
Infant mortality (1 – 11 months) 0 0 1 1
Chronic bronchitis, population aged >27 35 10 177 222
Respiratory hospital admissions, all ages 3 1 13 16
Cardiac hospital admissions, all ages 23 7 120 151
Restricted activity days (RADs) all ages 74,587 21,290 382,262 478,139
Work loss days 19,603 5,595 100,466 125,664
Child asthma, days 1,846 527 9,459 11,832
Child bronchitis, cases 171 49 877 1,097
2020 NOx PM2.5 SO2 Total
Emissions (tonnes/year) 8,234 1,051 32,723
Chronic mortality (life years lost) 632 173 2,429 3,234
Infant mortality (1 – 11 months) 0 0 0 1
Chronic bronchitis, population aged >27 30 8 114 152
Respiratory hospital admissions, all ages 2 1 8 11
Cardiac hospital admissions, all ages 20 6 78 103
Restricted activity days (RADs) all ages 64,054 17,511 246,240 327,805
Work loss days 16,835 4,602 64,717 86,153
Child asthma, days 1,585 433 6,093 8,112
Child bronchitis, cases 147 40 565 752
2025 NOx PM2.5 SO2 Total
Emissions (tonnes/year) 5,606 529 16,938
Chronic mortality (life years lost) 430 87 1,257 1,775
Infant mortality (1 – 11 months) 0 0 0 0
Chronic bronchitis, population aged >27 20 4 59 83
Respiratory hospital admissions, all ages 1 0 4 6
Cardiac hospital admissions, all ages 14 3 40 57
Restricted activity days (RADs) all ages 43,610 8,815 127,458 179,883
Work loss days 11,462 2,317 33,498 47,277
Child asthma, days 1,079 218 3,154 4,451
Child bronchitis, cases 100 20 292 413
www.ekologija.ba 152030 NOx PM2.5 SO2 Total
Emissions (tonnes/year) 3,222 197 2,804
Chronic mortality (life years lost) 247 32 208 488
Infant mortality (1 – 11 months) 0 0 0 0
Chronic bronchitis, population aged >27 12 2 10 23
Respiratory hospital admissions, all ages 1 0 1 2
Cardiac hospital admissions, all ages 8 1 7 16
Restricted activity days (RADs) all ages 25,065 3,281 21,100 49,446
Work loss days 6,587 862 5,546 12,995
Child asthma, days 620 81 522 1,224
Child bronchitis, cases 57 8 48 113
Table 9 shows total impacts estimated for the emissions profile of Appendix 2, Again including emissions
from Banovići) from 2017 through to 2030.
Table 9. Total impacts from all plant, European scale, 2015-2030.
Total impacts, 2015-2030 NOx PM2.5 SO2 Total
Emissions (tonnes/year) 104,444 12,080 394,143
Chronic mortality (life years lost) 8,015 1,985 29,259 39,260
Infant mortality (1 – 11 months) 1 0 5 6
Chronic bronchitis, population aged >27 377 93 1,375 1,845
Respiratory hospital admissions, all ages 28 7 101 136
Cardiac hospital admissions, all ages 256 63 934 1,253
Restricted activity days (RADs) all ages 812,495 201,259 2,965,919 3,979,673
Work loss days 213,539 52,895 779,501 1,045,935
Child asthma, days 20,106 4,980 73,393 98,479
Child bronchitis, cases 1,864 462 6,803 9,128
4.1.2 Monetized values
Converting the health impacts from Table 5, Table 6 and Table 7 to a monetary equivalent gives the
following results (valued using data for the EU average, adjusted by Bosnian PPP adjusted GDP/
capita)3:
3 Given the assumption of an elasticity of 1 in the costing between EU averages and Bosnian willingness
to pay and the broad range considered in the paper of Hammitt and Robinson, these figures should be regarded as
uncertain, but we can have reasonable confidence that public willingness to pay to avoid impacts at this level would
broadly be of this order of magnitude.
16 www.ekologija.ba○○ Tuzla Blocks G3 to G6: €99 million / year
○○ Tuzla Block 7: €3.7 million / year
○○ Banovići: €2.7 million / year
It is clear that Tuzla Blocks G3 to G6 generate substantially higher damage than the two proposed plants.
However, together the two new plants would generate an annual health externality of €6.4 million/
year. Also, in the event that Tuzla Block G8 is also constructed, additional emissions (and hence damage)
equivalent to those calculated for Tuzla Block G7 would arise, bringing total damage for the new facilities
to €10 million / year.
Turning to the results for the time series from 2013 to 2030, monetised equivalents, adjusted for Bosnian
conditions are as follows:
○○ 2013: €99 million
○○ 2015: €97 million
○○ 2020: €67 million
○○ 2025: €37 million
○○ 2030: €10 million
○○ Total, 2015 to 2030: €810 million
4.2 Scenario 2: Total impact of exposure to pollution in the Tuzla region (irrespective
of the source of pollution)
4.2.1 Health impacts
Given a small level of variation in the PM2.5 concentrations reported from the monitoring sites (average
43 μg.m-3 in a range of 38 to 52 μg.m-3, see Table 2), it is assumed that the full population for the region
(132,000 in Tuzla, 32,140 in Banovići) is exposed to the average of 43 μg.m-3. This of course assumes
that the monitoring stations are representative of exposure for the population rather than peak (‘hot-spot’)
concentrations. The response functions applied are again taken from the HRAPIE Project led by WHO-
Europe.
Table 10. Health impacts associated with exposure to air pollution in Tuzla and Banovići.
Tuzla and Banovići Impact
Chronic Mortality (All ages) LYL median VOLY Life years lost 2,875
Infant Mortality (0-1yr) median VSL Deaths 3
Chronic Bronchitis (27yr +) Cases 187
Bronchitis in children aged 6 to 12 Added cases 361
Respiratory Hospital Admissions (All ages) Cases 113
Cardiac Hospital Admissions (>18 years) Cases 81
Restricted Activity Days (all ages) Days 272,914
Asthma symptom days (children 5-19yr) Days 5,355
Lost working days (15-64 years) Days 69,924
www.ekologija.ba 174.2.2 Monetized values
Applying the EU valuations adjusted by per capita PPP adjusted GDP gives a total damage associated
with these impacts of €61 million/year. The mortality result in the top row of the table should be put in
context of the number of deaths over which it is aggregated. Dividing by the number of deaths expected in
the region gives an estimated loss of life expectancy per person of 3.2 years. Similar estimates have
been derived for cities in China and India (IIASA, 2011), though there are questions as to the linearity of the
response functions at higher concentrations. Whilst this may imply a bias to overestimation in the impacts,
it is to be remembered that results exclude assessment against SO2, NO2 and ozone exposure.
5 DISCUSSION
The report summarises evidence of poor air quality as recorded at the pollution monitoring stations in the
Tuzla region. There are frequent exceedances of alert thresholds in the area, emphasising the problems
that exist.
This is a matter of considerable concern given that air pollution is linked to a wide range of health problems,
from days of restricted activity all the way through to mortality (WHO, 2013). At the time that this report was
being written, the International Agency for Research on Cancer (IARC) published new findings, concluding
that air pollution is carcinogenic. It is notable that effects will occur even when air quality limit values
are being complied with, given the conclusion that there is no threshold for the effects of some important
pollutants, including fine particles (PM2.5, see for example, Crouse, 2012).
The existing power plant in Tuzla has high emissions of NOx, SO2 and PM2.5. It is estimated that this
plant is linked to 4,918 ‘years of life lost’ (an expression of longevity) across Europe each year and
a variety of effects on morbidity. In total, and adjusting valuation to Bosnian conditions, this and other
health impacts are valued at €99 million/year, based on current day values. Two further power plant
units are proposed, at Tuzla and Banovići. Being more modern these plants would emit less pollution
per unit of electricity generated, but are still estimated here to be associated with 310 years of life
lost annually, and damage of €6.4 million/year (increasing to €10 million/year if Block G8 is included).
These damages would continue for as long as each plant is operational, potentially 40 years or more for
the proposed facilities, and 10 or more years for the existing plant. Over the period 2015 to 2030 it is
estimated that the Tuzla and Banovići plants would cause cumulative impacts of 39,260 years of life
lost, numerous cases of morbidity and damage totaling €810 million.
Analysis of the health impacts of local air pollution on the population of Tuzla and Banovići is also provided,
with an estimated 2,875 years of life lost and various other health impacts, combining to give a monetary
value of €61million/year.
The analysis has not sought to apportion the impacts of poor local air quality between the power stations
and other sources (e.g. domestic burning) as this would require further data and modeling. However, the
plants will contribute to poor air quality in the region as well as further afield.
18 www.ekologija.ba6 REFERENCES
1. Begić H, Tahirović FH, Dinarević S, Ferković V, Pranjić N (2002). Učešće riziko-faktora u nastanku
urođenih anomalija srca u djece na području Tuzlanskog kantona. Medicinski Arhiv. 56(2): 73-77.
2. Brunekreef B, Annesi- Maesano I, Ayres JG, et al (2012) Ten principles for clean air. European
Respiratory Journal. 39 (3): 525-8.
3. Crouse, DL et al (2012) Risk of Non accidental and Cardiovascular Mortality in Relation to Long-
term Exposure to Low Concentrations of Fine Particulate Matter: A Canadian National-Level
Cohort Study. Environmental Health Perspectives, 120. http://ehp.niehs.nih.gov/wp-content/
uploads/120/5/ehp.1104049.pdf.
4. Dadvand P, Parker J, Bell ML, et al (2013) Maternal Exposure to Particulate Air Pollution and Term
Birth Weight: A Multi-Country Evaluation of Effect and Heterogeneity.
5. EEA (2010): The European Environment State and Outlook 2010: Air pollution. European
Environment Agency, Copenhagen, Denmark.
6. EEA (2011, 2013) Revealing the costs of air pollution from industrial facilities in Europe (2013
report in preparation). European Environment Agency, Copenhagen, Denmark.http://www.eea.
europa.eu/publications/cost-of-air-pollution.
7. ExternE (1995; 1998; 2005) Methodology report, and updates. ExternE (Externalities of Energy)
Project for European Commission DG XII. http://www.externe.info/externe_d7/?q=node/4.
8. FIPA Energy sector (2012) B&H Investment projects: B&H energy sector. FIPA 13.11.2012; pp
1-61.
9. Hadžić D, Mladina N, Ljuca F, Bazardžanović M (2009) Air pollution and Hospitall Admission
Trends of children with Bronchial Obstruction in Tuzla Canton. Med Arh. 63 (3): 146-150.
10. Hammitt, JK and Robinson, LA (2011) The Income Elasticity of the Value per Statistical Life:
Transferring Estimates between High and Low Income Populations. Journal of Cost-Benefit
Analysis, 2, 1-27. http://www.regulatory-analysis.com/hammitt-robinson-VSL-income-elasticity.
pdf.
11. Holland, M (2013) Implementation of the recommendations of the HRAPIE Porject for cost-benefit
analysis (in preparation).
12. Hurley, JF et al (2005) Methodology for the cost-benefit analysis of the Clean Air For Europe
Programme. Report to European Commission DG Environment. http://ec.europa.eu/environment/
archives/cafe/pdf/cba_methodology_vol2.pdf.
13. IARC (2013) http://www.iarc.fr/en/publications/books/sp161/index.php
14. IIASA (2013) Co-benefits of post-2012 global GHG-mitigation policies. International Institute for
Applied Systems Analysis. http://www.iiasa.ac.at/publication/more_XO-11-070.php.
15. Kazagić A, Musić M, Aganović E (2012) Energetska efikasnost u EP BiH – aktuelna situacija,
aktivnosti i projekcije do 2030. (Energy efficiency in the B&H Electro Economy: the current
situation, activities and projections to 2030) ENERGA, međunarodna konferencija (International
Conference), Tuzla 7-8 juni, 2012.
16. Krstović G (2010) Environmental Assessment for the project Reduction of Air Pollution through
Connecting Clinical Medical Center Tuzla on District Heating Network. HVAC expert, United
Nations Development Programme UNDP B&H, ongoing 2019.
17. Krzyzanowski, M and Cohen, A (2008) Update of WHO Air Quality Guidelines. Air Qual Atmos
Health (2008) 1:7–13. http://www.euro.who.int/__data/assets/pdf_file/0003/78681/E91399.pdf.
18. Lim SS, Vos T, Flaxman AD, et al (2012) A comparative risk assessment of burden of disease and
injury attributable to 67 risk factors and risk factor clusters in 21 regions, 1990—2010: a systematic
analysis for the Global Burden of Disease Study 2010. The Lancet. 380(9859):2224-2260.
www.ekologija.ba 1919. Mehinović N, Pranjić N, Ferković V, Aščerić M (2004) Urban-rural differences in cancer incidence
in the Tuzla canton, Bosnia and Herzegovina in 2002. Boock of abstracts of Second International
conference on rural health & First International conference on occupational and environmental
health in Mediterranean, South East and Central European Countries, Belgrade. pp 128-129.
20. Merić J (2011) Novi investicioni ciklus u JP EP BiH sa posebnim osvrtom na izgradnju zamjenskog
bloka 7- 450 MW (New investment cycles in JP EP B&H with special emphasis on the construction
of a replacement block 7-450 MV). JP Elektroprivreda Bosne i Hercegovine (Electricity Company
of Bosnia and Herzegovina); 2011; p 1-32.
21. Musemić R, Šahman- Salihbegović S, Ahmetović N (2012) Simulation of polutant transport and
assessment of impacts on human health. Journal of Trends in development of machinery and
Associated Technology. 16 (1):159-62.
22. Pope CA, Burnett RT, Thun MJ, et al (2002) Lung cancer, cardiopulmonary mortality, and long-
term exposure to fine particulate air pollution. JAMA.287:1132–41.
23. Pranjić N (2006) Zdravstvena ekologija (Environmental Health). University book, University of
Tuzla.
24. Pranjić N, Begić H (1998) Lead poisoning of children in Bosnia and Herzegovina (Trovanje djece
olovom u Bosni i Hercegovini). Med Arh 1998; 53/3 (2): 59-61.
25. Pranjic N, Salihović H (2003) Urbane i ruralne razlike u pojavi karcinoma pluća u općini Banovići.
Zbornik I kongresa Medicine rada Bosne i Hercegovine s međunarodnim učešćem “Medicina rada
u Evropi”, Tuzla 2003; 207-208.
26. Tais M (2012) Analysis of effects of emission reduction from Gradina and Slavinovici hospitals,
and Dragodol community, after conection on the district heating network in Tuzla. Bosnia and
Herzegovina Contact for Air Quality and Emission Inventory to the European Environment Agency,
for UNDP Bosnia and Herzegovina; 2010.
27. WHO (2013) Review of evidence on health aspects of air pollution – REVIHAAP: First results.
World Health Organization Regional Office for Europe, Copenhagen, Denmark. http://www.euro.
who.int/__data/assets/pdf_file/0020/182432/e96762-final.pdf [accessed 19 February 2013].
28. WHO (2013) HRAPIE Project, Health Response to Air Pollution in Europe (in preparation). World
Health Organization Regional Office for Europe, Bonn. http://www.euro.who.int/en/health-topics/
environment-and-health/air-quality/activities/health-aspects-of-air-pollution-and-review-of-eu-
policies-the-revihaap-and-hrapie-projects
20 www.ekologija.baAppendix 1: Further information on health impacts
Fine particles in the PM10 size class4 are readily inhalable and because of their small size are not filtered
and penetrate deeply into the cardiovascular system where they cause damage. Those smaller than 2.5
µm (PM2.5) penetrate deeper than those closer to 10 µm. These particles have strong associations with
most types of respiratory illness and mortality. They also have a strong association with circulatory (heart
disease and strokes) disease and mortality. Particles allow many chemicals harmful to human health to
be carried to many of our internal organs causing a wide range of illness and mortality including cancer,
especially lung cancer, brain damage and damage to the unborn child (EEA, 2010; Lim et al, 2012; WHO,
2013; Mehinović et al, 2004).
A broadly similar list of health effects for elevated particulate concentrations has been compiled by the US
Environmental Protection Agency (EPA):
○○ Increased total mortality, respiratory deaths; cardiovascular deaths, cancer death;
○○ Increased risk of premature births and infant mortality;
○○ Increased risk of pneumonia;
○○ Increased hospital admissions and emergency room visits;
○○ Exacerbation of asthma attacks;
○○ Increased bronchodilator use;
○○ Increased respiratory symptoms in both lower and upper respiratory tract;
○○ Decreased lung function;
○○ Increased incidence of rhinitis;
○○ Increased absenteeism/number of days of restricted activity
Older people, children and patients with chronic respiratory or cardiovascular diseases experience the
largest threat to their health and well-being from air pollution (Pranjić, 2006; EEA, 2010; Brunekreef et al.,
2012), as they are more susceptible to the damage done by the pollutants. Children, even before birth, are
particularly susceptible to air pollutants (Dadvand et al, 2013; Pranjić and Begic, 1998; Begic et al, 2002).
Recent studies found associations between exposure to outdoor air pollution during pregnancy and lower
birth weight, as well as higher rates of preterm birth and pre-eclampsia. Across the EU it is estimated that
air pollution is responsible for an average reduction in life expectancy of 8.6 months or, in other words, for
492 000 premature deaths every year.
With the exception of a few countries, cardiovascular disease is the leading cause of death in Europe
and accounts for approximately 40% of deaths or 2 million deaths per year. Public health costs related to
cardiovascular disease were estimated at €196 billion a year for the EU, the respective estimate for chronic
respiratory diseases, coming from the European Lung Foundation (ELF) and the European Respiratory
Society (ERS), being €102 billion per year.
4 PM10 = fine particles with an aerodynamic diameter of less than 10 microns. PM2.5 = fine particles with an
aerodynamic diameter of less than 2.5 microns.
www.ekologija.ba 21Appendix 2: Annual emissions of air pollutants by plant
Fine Particles
Sulphur dioxide
22 www.ekologija.baNitrogen oxides (NOx) www.ekologija.ba 23
Centar za ekologiju i energiju

      M. i Ž. Crnogorčevića 8, 75000 Tuzla, BiH
     Tel: +387 35 249 310, fax: +387 35 249 311
                  www.ekologija.ba

24                 BOSNA I
                  www.ekologija.ba
                    HERCEGOVINA
PROTECT THE ENVIRONMENT!
You can also read