HEPTAGON KETTLE HILL US L/S EQUITY FUND* - Heptagon Capital
←
→
Page content transcription
If your browser does not render page correctly, please read the page content below

Q3 2021

HEPTAGON KETTLE HILL US L/S
EQUITY FUND*
*A sub-fund of Heptagon Fund plc

The Fund has been classified as an Article 6 for the purposes of the EU's Sustainable Finance Disclosure Regulation
('SFDR'). The Fund takes sustainability criteria into account within the investment process but does not have sustainable
investment as its objective and does not promote environmental or social characteristics

Heptagon Capital, 63 Brook Street, Mayfair, London W1K 4HS
Tel: +44 20 7070 1800 Fax: +44 20 7070 1881
(FRN 403304)

Authorised & Regulated by the Financial Conduct Authority
12 Endeavour Square, London, E20 1JN

                                                                                                                            1
IMPORTANT INFORMATION

The following presentation provides information on the Heptagon Kettle Hill US L/S Equity Fund (the “Fund”), a sub-fund of Heptagon Fund Plc which is an open-
ended umbrella type investment company authorised pursuant to UCITS regulations. Heptagon Capital Limited (“Heptagon”) is the Investment Manager and Kettle
Hill Capital Management, LLC (“Kettle Hill”) is the Sub-Investment Manager meaning Kettle Hill exercises discretionary investment authority over the Fund.

Kettle Hill has been managing Kettle Hill Partners, LP, a Delaware Limited Partnership available for U.S. accredited investors since its inception in June 2003. The
Fund has the same Portfolio Manager and investment team, the same investment objective and uses the same philosophy and strategy as Kettle Hill Partners, LP.
Since the Fund has a relatively short time period, the following presentation makes extensive reference to Kettle Hill Partners, LP to provide a better understanding
of how the team has managed this strategy over a longer time period. Net returns for Kettle Hill Partners, LP are net of 1.5% management fee and 20% performance
fee.

Kettle Hill manages the Fund according to the same investment principles, philosophy and execution of approach as those used for Kettle Hill Partners, LP, however
it should be noted that due to certain factors including, but not limited to, differences in cash flows, fees, expenses, performance calculation methods, and portfolio
sizes and composition, there may be variances between the investment returns demonstrated by each portfolio in the future.

For the same reason, although the following presentation makes extensive reference to the performance of Kettle Hill Partners, LP since its inception in 2003, it is
provided purely for indicative purposes to demonstrate how Kettle Hill has performed historically in its role as investment advisor to this specific strategy. The
performance for Kettle Hill Partners, LP is not the performance of the Fund and is not an indication of how the Fund would have performed in the past or will
perform in the future. This material should not be viewed as a solicitation or offer of services by Kettle Hill. It is provided for informational purposes only. The
information contained herein does not constitute an offer to sell or the solicitation of an offer to purchase any U.S. registered security or U.S. investment product.

Any performance data quoted represents past performance. Performance figures are also shown for the Hedge Fund Research HFRX Equity Hedge (“HFRX”) Index.
The HFRX Index is a trademark of the Hedge Fund Research® Company. The HFRX Index utilizes a rigorous quantitative selection process to represent the larger
hedge fund universe.

The investment return and principal value of an investment will fluctuate so that the investor's shares, when redeemed, may be worth more or less than their
original cost. Any investor should consider the investment objectives, risks and charges and expenses of the Fund carefully before investing. The Funds' prospectus
and simplified prospectus contain these and other important information about the Fund. The prospectus should be read carefully before investing. Please email
london@heptagon-capital.com for a free copy of these documents.

                                                                                                                                                                     2
                                                                                                                                                     2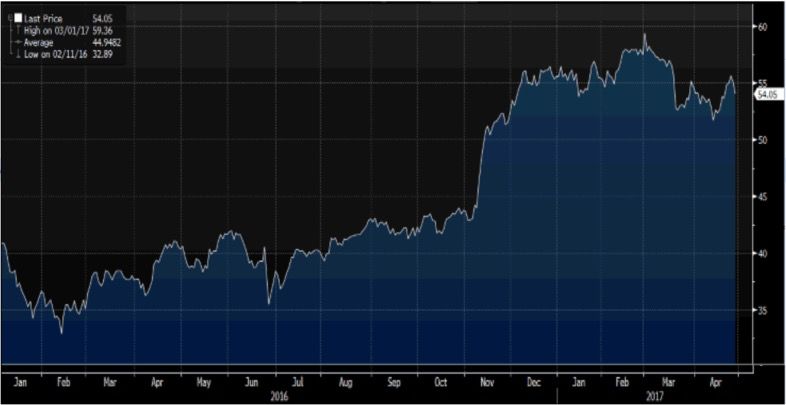
TABLE OF CONTENTS

                                                                      4
I      The Investment Manager & Sub-Investment Manager

                                                                      10
II     The Case for U.S. Small Cap Stocks

                                                                      13
III    Investment Philosophy and Process

                                                                      21
IV     Risk Management and Guidelines

                                                                      24
V      Performance – Kettle Hill Partners, LP

                                                                      27
VI     Portfolio Analysis – Heptagon Kettle Hill US L/S Equity Fund

                                                                      29
VII    Case Studies

                                                                      36
VIII   Kettle Hill Investment Team

                                                                      40
IX     Fund Particulars and Structure

                                                                      42
X      Appendix

                                                                      46
XI     Disclaimer

                                                                           3
THE INVESTMENT MANAGER &
SUB-INVESTMENT MANAGER

IRISH UCITS FUND STRUCTURE

The diagram below explains the Irish UCITS fund structure and the relationship between the Investment Manager, Sub-Investment Manager and
other relevant service providers for the Heptagon Kettle Hill US L/S Equity Fund.

                                        Promoter and
                                         Investment                              UCITS          Daily NAV &      Oversight of
                                                            Marketing &                                                              Oversight of
                                           Manager                           Compliance &      subscription /   share class FX
                                                             Investor                                                                  Service
                                                                             EU registration    redemption        hedging
                                                             Relations                                                                Providers
                                         Heptagon                              oversight          approval
                                       Capital Limited

                                       Sub-Investment
                                          Manager
                                                                                                Investment
                                                              Portfolio         Quarterly
                                                                                                   Risk
                                         Kettle Hill        Management        Investor calls
                                          Capital                                              Management
                                        Management

                                       Administrator
                                       Brown Brothers
                                       Harriman Fund                          Shareholder
                                       Administration      Daily Reports        Services
                                      Services (Ireland)
                                           Limited
   Heptagon         Heptagon
   Fund Plc        Kettle Hill US
                                         Depositary
 (domiciled in      L/S Equity
    Ireland)           Fund            Brown Brothers         Trade          Safekeeping of      Corporate
                                      Harriman Trustee     Reconciliation        Assets           Actions
                                      Services (Ireland)
                                           Limited

                                                                               Company
                                       Legal Advisers       Legal Advisors    Secretary for
                                                             as to matters       board
                                        Simmons &                            meetings and
                                         Simmons              of Irish Law
                                                                               corporate
                                                                             administration

                                      Prime/Derivative
                                          Brokers
                                                               Swaps            Futures          Options
                                      Morgan Stanley

                                                                                                                                                    5
                                                                                                                                 5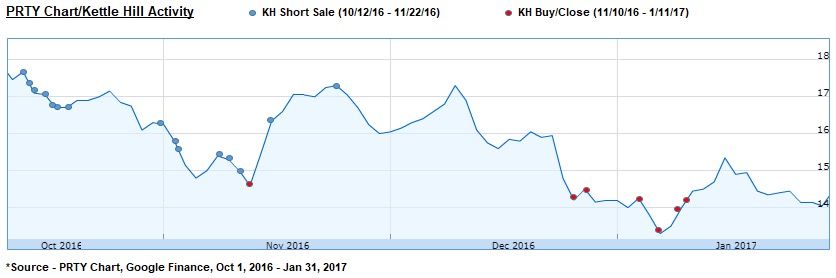
HEPTAGON CAPITAL

       Independent                       $15.9 bn**
      boutique asset                   Assets under                Established in                      4 Office                      40 Total                      16 Different
       management                      Management                      2005                           Locations                     Employees                      Nationalities
           firm                         and Advice

                                                                            I Heptagon Capital

                                                                                                                                             Discretionary Portfolio
        Heptagon UCITS Fund Platform                                      External Manager Platform
                                                                                                                                                 Management
  In-house
                                                                     •   Hedge Funds                                                 •   Discretionary Portfolio Management
  •    Heptagon European Focus Equity Fund                                                                                           •   Concentrated Equity Management
                                                                     •   Private Equity
  •    Heptagon Future Trends Equity Fund
                                                                     •   Alternative Funds                                           •   Hedging and Overlay Strategies
  •    Heptagon Future Trends Hedged Fund                                                                                            •   Asset Allocation Advice
                                                                     •   Long Only Funds
  •    Heptagon Listed Private Assets Fund                                                                                           •   Bespoke Mandates
                                                                     •   Real Estate
  Sub-advised

  •    Yacktman US Equity Fund
  •    Driehaus Emerging Markets Sustainable Equity
       Fund
  •    Driehaus US Micro Cap Equity Fund
  •    Driehaus US Small Cap Equity Fund
  •    Kopernik Global All-Cap Equity Fund
  •    WCM Global Equity Fund                                  PRI is a leading global network for investors who are committed to integrating environmental, social and governance
  •    Heptagon Kettle Hill US L/S Equity Fund                 considerations into their investment practices and ownership policies. Heptagon signed the UN PRI on 10th July 2019.
  •    Summit Sustainable Opportunities L/S Equity Fund
  •    Easterly US Value Equity Fund

*Heptagon Capital includes Heptagon Capital Limited, licensed to conduct investment services by the Malta Financial Services Authority and Heptagon Capital LLP, authorised and regulated
by the Financial Conduct Authority
** As of 30.06.2021
                                                                                                                                                                                       6
                                                                                                                                                                     6
KETTLE HILL

                                                            •   Focus primarily on US small caps
  Inefficient Target Market
                                                            •   Emphasis on underfollowed, misunderstood and mispriced opportunities

                                                            •   Investing in small caps since 1996
  Experienced Portfolio Manager
                                                            •   Managing the strategy since June 1, 2003

                                                            •   Specialists in US small cap stock research
  Experienced Team
                                                            •   Long-standing professional relationships in a team-oriented culture

                                                            •   Rigorous, disciplined and scalable investment process
                                                            •   Utilise a combination of value and momentum investing
  Disciplined Investment
                                                            •   Active portfolio management using long and short positions
                                                            •   Emphasis on capital preservation in volatile markets

                                                            •   9.0% annualised return, 7.6% annualised volatility since inception, net of fees*
  Performance
                                                            •   Annualised alpha since inception is approximately 7.9% vs HFRX Index*

  Strategy AUM                                              •   $683mm*

                    Past performance is no guide to future performance and the value of investments and income from them can fall as well as rise.

*Data for Kettle Hill Partners, LP as of 30 June 2021
                                                                                                                                                     7
                                                                                                                                                 7
KETTLE HILL

I Key Points of Differentiation

                            Focus on inefficient segment of             A contrarian value investment                      Thorough fundamental
                          the marketplace - US Small Cap                   strategy utilising a growth                 bottom-up research combined
                                      Long/Short                                  investor tool kit                         with macro awareness

    Seeking asymmetric payoff                     An active trading orientation                   Strict risk management                    18-year live strategy track
                  profile                          to portfolio and net exposure                          discipline                                   record*
                                                             management

                Kettle Hill Partners, LP is a long/short equity hedge fund that seeks to generate superior rates of return in any market environment by investing primarily in
                domestic small-cap stocks. Independent thinking, unique stock selection, excellent fundamental research, and sound investment discipline provide an attractive
                risk/reward opportunity for our limited partners.

*June 2003 to June 2021
                                                                                                                                                                                 8
KETTLE HILL TEAM

The below table shows all employees at Kettle Hill. The Portfolio Manager and Analysts are responsible for the portfolio management (including
idea generation, portfolio construction, security selection, investment research and risk management) of the Fund. Compliance and Trading
personnel at Kettle Hill also support the Fund’s activities.

The Portfolio Manager has managed the strategy since June 2003 and is supported by a well-resourced team of experienced investment
professionals.

                                                                       Portfolio Manager

                                                                     Andrew Y. Kurita, CFA
                                                               Portfolio Manager/ Chief Investment
                                                                             Officer
                                                             Portfolio Management Experience: 18 years
                                                               US Micro/Small – Industrials/Financials
                                                                    Investing Experience: 25 years
                                                                       Firm Experience: 18 years

                                                                             Analysts

    Stuart B. Goldberg                 Thomas R. Jolley               James M. Moynihan,                 Rishabh Mehra                Brian M. Cullinane
     Generalist Analyst                Generalist Analyst                    CFA                         Generalist Analyst            Generalist Analyst
        US Micro/Small                     US Micro/Small               Generalist Analyst                US Micro/Small                 US Micro/Small
    Investing Experience: 28        Investing Experience: 3 years         US Micro/Small           Investing Experience: 3 years     Investing Experience: 11
              years                   Firm Experience: 3 years        Investing Experience: 23       Firm Experience: 3 years                  years
    Firm Experience: 4 years                                                    years                                                Firm Experience: 4 years
                                                                     Firm Experience: 11 years

                                                                    Compliance and Trading

         Afroz Qadeer                           Bryan R. Kiss, CPA                       Brian R. Appleton                          Paul M. Basile
     Chief Executive Officer                   Chief Financial Officer/                 Director of Marketing                          Trader
   Investing Experience: 28 years             Chief Compliance Officer                    Investor Relations                   Trading Experience: 28 years
      Firm Experience: 6 years              Investing Experience: 24 years        Capital Markets Experience: 24 years          Firm Experience: 16 years
                                              Firm Experience: 18 years                 Firm Experience: 7 years
                                                                                                                                                                9
                                                                                                                                                9
THE CASE FOR U.S. SMALL CAP STOCKS
THE CASE FOR U.S. SMALL CAP
STOCKS
I Growing Passive Investments Larger Addressable Investment Universe
• Increases in passive investments lead to higher 2000+ Stocks
correlations, which may add to mispricing of securities
• Forced rebalancing can create ’noise’
• Increasingly opportunities appearing outside small-cap
index (new issues, spin-offs, restructurings, “fallen
500+ Stocks
angels”)
Russell Small Cap Universe S&P Universe
I Less Research Focus in Small Cap Universe
Average Analyst Coverage per Stock
• Numerous opportunities within small-cap subset of the 22
market
• Less focus, scarce information may inhibit some
investor’s ability to calculate risks
• Higher volatility, less liquidity – certain investors avoid / 7
exclude small-caps
US sma ll cap stock universe S&P stocks
($200m-$5bn mkt cap) ($45b avg. mkt cap)
Source: Factset Research Data, 17 July 2017
11
11THE CASE FOR U.S. SMALL CAP STOCKS
• Market Capitalisation, which includes Russell 2000
Small Cap Universe • Minimum average daily dollar trading volume of $1m
• 75% of universe trades over $3 million per day on average
• Sell-side research coverage is limited
Inefficient Market • Liquidity constraints limit buy-side research coverage
• Extreme valuation swings create greater opportunities
• More “fallen angels”
Better Long Opportunities • Asymmetric risk/reward targets with significantly more upside versus downside potential,
based on valuation of tangible assets and worst-case cash flow estimate
• One-hit wonders, companies in secular decline, poor management teams, less diversified
Better Short Opportunities
business models
• Change in small companies is often more significant and more frequently misunderstood
than for larger companies
Bigger Catalysts
• New products, new management, M&A, spinoffs, divestitures, IPOs, restructurings,
liquidity, financings, industry supply/demand, change in industry structure
12
12INVESTMENT PHILOSOPHY AND PROCESS
INVESTMENT PHILOSOPHY

                                  •   Limited sell-side, buy-side, media coverage, greater impact of change vs large caps
    Inefficient Universe
                                  •   Target asymmetric risk/reward investment opportunities

                                  •   Fundamental based value-orientation, utilising a growth investor toolkit (modeling,
    Contrarian Value Philosophy       forecasting, due diligence/channel checks)
                                  •   Original ideas, “Fallen Angels”, overlooked/unfavoured industries and sectors

                                  •   Rely on in-house research to identify and screen opportunity set
                                  •   Focus on primary research, catalyst identification and thesis validation
                                  •   Ongoing monitoring of position specific news, trends and events
    Proprietary Research          •   In-house due diligence, survey analyst focused on finding current, pertinent data that will
                                      enhance research efforts
                                  •   Uncover leading indicators that predict contrarian outcomes
                                  •   Long and short positions should be alpha generators

                                  •   Active portfolio and net exposure management at portfolio and position levels based on
    Active Exposure Management        market view, macro environment, hedge fund positioning, risk/reward, short-term trading
                                      considerations and time to catalyst

                                  •   Adhere to well defined risk parameters at portfolio and position levels
                                  •   Establish position and industry sizing guidelines
                                  •   Utilise position and portfolio level stop loss guidelines
    Risk Management
                                  •   Focus on capital preservation during volatile times – seek to avoid permanent loss of
                                      capital
                                  •   Maintain portfolio liquidity and opportunity set
Source: Kettle Hill
                                                                                                                                    14
                                                                                                                   14
INVESTMENT PHILOSOPHY
I Ideal Kettle Hill Stock – “The Fallen Angel”
Small-cap “Early stage”/small-cap
companies investors seek rewards
typically rely on 2 (growth, earnings
Product failures, management/execution, competition, etc.,
fewer products, potential) for risks.
can all dramatically change the future earnings, growth
services offered,
1 along with 3 potential of a small-cap company. Any change may cause a
small-cap company to lose “sponsorship” within its investor
limited resources
base, resulting in the stock selling off precipitously.
(management
team, etc.) - all
greatly affecting
the company’s Inflection point – Some Valuation increases as
performance. dynamic change has revenues, earnings
5 taken place, been
Stocks may reach a “base” 6 increase, and benefits
Price
identified, attracted from resulting multiple
or “support level” as
marginal investor expansion.
marginal selling of the
attention.
stock decreases, certain
fundamentals are better
4 reflected in the current
price , or certain tangible
valuations are considered
(book value, cash flows,
NOLs, etc.). Management
teams may signal “value”
to the market by buying
company stock.
Time
Source: Kettle Hill
15
15IDEA GENERATION & DUE DILLIGENCE PROCESS
• Primarily domestic Small-Cap equities (which includes Russell 2000)
Investment Universe 2,000+ stocks
• Minimum average daily dollar trading volume of >$1m
Identify stocks with powerful non-consensus catalysts: 40 to 60 stocks
Screens: Valuation, growth, earnings quality, Company news: New products, strategic change, business
management buying/selling, technical analysis, trends
Idea Screening Network: Public and private company contacts Themes: Macro view and industry selection, supply/demand,
industry competitive structure, cyclical analysis
Evaluate risk/reward and key issues: 15 to 20 stocks on WIP list
Seeking 50% upside, 10% downside, with a 6 to 18-month investment horizon*
Risk Reward Identify potential for significant change in earnings and assess valuation
Interview multiple sources: 4 to 6 stocks
Management, employees, competitors, distributors, suppliers, customers, analysts
Due Diligence Proprietary surveys
Forecast earnings: Portfolio Investment
Earnings Modelling Quarterly model measured relative to street expectations
Careful monitoring of short-term business trends
Record initial thesis and target price
Thesis Write-Up
1.Achievement of target price 4.Net exposure management
2.Change in thesis 5.Short-term trading
Exit Discipline 3.20% stop-loss
Source: Kettle Hill
*Potential upside and downside risk/reward based on Kettle Hill’s own internal research/analysis and resulting price targets.
16
16TYPICAL PORTFOLIO CHARACTERISTICS
55-80 positions
Longs Shorts
30-40 25-40
Typical Exposure Ranges
• Gross: 70% - 120%
• Net: 10% - 60%
• Avg.: +25%
• Target L/S ratio: 2:1
Long Component Tactical Component Short Component
Stable Value Deep Value Asymmetric Long and Short Fundamental Thematic
Value
• Greater Visibility • Diminished • Catalyst Driven • Shorter term • Catalyst Driven • Natural Hedges
• Lower Volatility Downside • Higher • Exposure Management • Revenue/Earnings to Longs
• 3% avg. size • Backstops: Risk/Reward • Individual Equities Decrease • Macro,
• Return Tangible Assets, • 1% avg. size • ETFs • 1.5% avg. size Industry/Sector
Expectations: Book Value, • Return • Return • Exposure
-5% to +20% Cash Flow Expectations: Expectations: Management
• Catalyst Driven -20% to +100% -10% to +20% • 0.5% avg. size
• 3% avg. size • Return
• Return Expectations: -
Expectations: 20% to +50%
-10% to +40%
Security Selection and Research Process
Past performance is no guide to future performance and the value of investments and income from them can fall as well as rise.
Source: Kettle Hill
17
17PORTFOLIO CONSTRUCTION: BUILDING/MANAGING POSITIONS
Idea Generation Research Portfolio Management Exit Position
Sizing – Buy Positions Continuing Research
• Due Diligence • Upside/Downside
• Modelling & Risk Smaller Positions Larger Positions • Surveys • Achieve price target
50 to 200 bps 200 to 600 bps
Forecasting • Conviction • Channel Checks • Conviction/Thesis
• Greater downside risk • High conviction
(Internal vs • Current price • Less Liquid • Limited downside risk • Site Visits change
• Higher beta • Lower beta
Consensus) valuation • Management Team • Risk/Reward change
• Building/ R&D Position • More liquid
• Setting Price Target • Near-term visibility,
• Mid/Long-term catalyst • Attractive valuation Meetings • Exposure
• Near/Longer-term
Data Points catalyst Management
• Max: 600 bps @ cost
• Time to catalyst Position
Sizing – Short Positions New Idea Sourcing
Maintenance
• Liquidity • Alpha Shorts
• Hedge Instruments • Tactical Trading • Tactical Trading
Smaller Positions Larger Positions • Market/Sector • Market/Sector
25 to 150 bps 150 to 500 bps
moves moves
• Greater downside risk • High conviction
• Less Liquid • Near-term catalyst • Resizing • Resizing
• Higher beta • Greater liquidity • Scaling • Scaling
• Building/ R&D Position • Max: 300 BP non-ETF
short @ cost, 500 bps • Liquidity • Liquidity
ETF @ cost
Risk Guidelines, Risk Management
Position Volatility Sector Limits Liquidity Stop-Loss
Concentration Limits
Source: Kettle Hill
18
18PORTFOLIO CONSTRUCTION: NET EXPOSURE MANAGEMENT
Directional: 40% Net Long
• Number, size/convictions in longs/shorts
• Relative market valuation, volatility
• Overall portfolio volatility Exposure Management Inputs:
• Risk management
• Bottom-up fundamental analysis on
Micro/Macroeconomic Factors individual securities
• Sector strength/weakness, catalysts • Net sector exposure management
• Key economic indicators (i.e. – changes in • State of equity curve
monetary, fiscal policy, unemployment, etc) • PM’s overall market / economy viewpoint
• Changes in currencies, commodities • Hedge Fund positioning
markets
• Cycles/trends: momentum vs.
fundamental, growth vs. value
Less Directional/Defensive:
10% Net Long
Source: Kettle Hill
19
19HISTORCIAL NET AND GROSS EXPOSURE 30/06/2003 – 30/06/2021
• Kettle Hill Partners, LP has averaged 26% net exposure since inception in 2003
• No significant leverage/derivatives utilised since inception
Gross Exposure Net Exposure Average Net Exposure
140%
100%
60%
20%
-20%
Ju 03
Ju 04
Ju 05
Ju 06
Ju 07
Ju 08
Ju 09
Ju 10
Ju 11
Ju 12
Ju 13
Ju 14
Ju 15
Ju 16
Ju 17
Ju 18
Ju 19
Ju 20
De -03
De 04
De -05
De -06
De -07
De -08
De -09
De -10
De -11
De 12
De 13
De -14
De -15
De -16
De -17
De -18
De -19
De -20
21
c-
c-
c-
c-
c-
c-
c-
c-
c-
c-
c-
c-
c-
c-
c-
c-
c-
c-
n-
n-
n-
n-
n
n
n
n
n
n
n
n
n
n
n
n
n
n
n
Ju
Sources: Kettle Hill, AlternativeSoft.
20
20RISK MANAGEMENT GUIDELINES
RISK MANAGEMENT AND GUIDELINES

  Exposure             •   Beta-adjusted net, gross and industry exposure monitored regularly

                       •   Maximum of 150% gross exposure
  Leverage
                       •   Rarely employed

                       •   6% maximum long position at cost
  Position Size        •   3% maximum non-ETF short position at cost
                       •   5% maximum ETF short position at cost

                       •   Average position may generally be liquidated within a week, based on one-third of
                           average daily trading volume
  Liquidity
                       •   Approximately 1% maximum individual positions in less actively traded stocks
                       •   Approximately 10% maximum aggregate portfolio limit for less actively traded stocks

  Industry Limits      •   Approximately 20% maximum net industry concentration

                       •   Approximately 20% stop-loss on individual positions from cost
  Stop Loss
                       •   Approximately 5% portfolio loss triggers reduction in net and gross exposure

Source: Kettle Hill

                                                                                                                 22
                                                                                                     22
RISK MANAGEMENT AND GUIDELINES
I Position and Portfolio Level Inputs + Underlying Exposures + Implied Sensitivities = Potential Outcomes
Periodic Position, Portfolio Level Analysis Risk Management
• Conscious of significant underlying bets being made within the
• Returns based analysis Fund:
• Position, sector & geographic marginal contribution to risk • Country, sector, currency, security-specific risks
• Correlation analysis • Correlations
• Index, factor analysis • Betas
• Liquidity analysis • Market, sector and individual security volatility
• Fundamental and technical factors • Vital inputs when constructing portfolio:
• Scenario analysis (stress testing) • Managing exposure levels
• Risk decomposition • Liquidity
• Beta decomposition across correlation and volatility • Sector and individual security volatility
• State of equity curve important in determining risk level of
portfolio
• Adherence to risk discipline with respect to risk guidelines
Qualitative + Quantitative Portfolio Manager Portfolio Construction +
Inputs Experience Risk Management
Source: Kettle Hill
23
23PERFORMANCE – KETTLE HILL PARTNERS, LP
PERFORMANCE OF KETTLE HILL PARTNERS, LP                                                                                                         as of 30/06/2021 (net of fees)

I Monthly Returns
                                                                                                                                                                                        Excess
           Jan        Feb        Mar           Apr         May         Jun         Jul         Aug          Sep           Oct         Nov           Dec         Total       HFRX
                                                                                                                                                                                        Return
2003                                                                   0.8%        1.6%        1.2%         0.2%          1.3%         1.5%         4.2%       11.3%         14.5%        -3.2%
2004      0.7%        1.4%        1.1%         0.7%        -0.5%       0.4%        1.3%        0.1%         0.1%          1.6%         0.9%         3.2%       11.5%          2.2%         9.3%
2005      0.8%       -0.2%       -0.1%         0.0%         0.6%       3.4%        2.5%        2.1%         -0.9%        -0.6%         1.5%         2.7%       12.3%          4.2%         8.1%
2006      1.5%        1.8%        2.8%         1.1%         0.1%       1.9%        0.6%        0.4%         1.7%          0.5%         4.6%         2.7%       21.5%          9.2%       12.3%
2007      -0.6%       1.2%        0.4%         0.9%         1.2%       0.1%       -1.7%        -2.1%        0.9%          1.4%        -2.5%        -0.5%        -1.4%         3.2%        -4.6%
2008      -0.6%      -0.1%        1.8%         2.2%         1.3%      -1.4%       -2.5%        -1.2%        -3.9%        -3.7%        -6.0%         3.1%       -10.7%       -25.5%       14.8%
2009      7.7%        1.6%        3.9%         8.1%         2.7%       1.0%        9.3%        3.8%         0.4%         -4.0%        -0.4%         0.4%       39.6%         13.1%       26.5%
2010      1.7%        2.0%        4.8%         0.0%        -1.1%      -1.7%        0.5%        -0.4%        1.7%          0.0%         1.3%         4.1%       13.4%          8.9%         4.5%
2011      -0.2%       1.6%       -0.9%         0.6%        -1.1%       1.1%        0.2%        -2.4%        -5.0%         9.0%        -1.0%         0.7%         2.0%       -19.1%       21.1%
2012      3.1%        2.0%       -0.4%        -0.4%        -2.1%       1.1%       -0.4%        1.1%         2.9%          0.0%         0.5%         0.4%         8.0%         4.8%         3.2%
2013      1.9%       -1.8%        1.2%        -1.9%         2.0%       0.9%        1.1%        -2.4%        1.9%          1.6%         1.8%         1.7%         8.1%        11.1%        -3.0%
2014      -0.8%       1.5%        0.4%        -0.4%         1.4%       0.3%       -1.8%        4.8%         -0.3%         0.8%        -1.0%         1.9%         6.7%         1.4%         5.3%
2015      1.2%        2.9%        0.0%         0.3%         1.6%      -0.6%        0.5%        0.5%         -1.4%         3.0%         0.8%        -1.0%         8.1%        -2.3%       10.4%
2016      -3.0%       0.1%        2.3%         0.9%         2.5%      -1.2%        2.4%        1.7%         1.0%          0.0%         2.5%         0.4%         9.9%         0.1%         9.8%
2017      0.3%        0.0%       -0.6%         0.5%        -0.7%       1.6%       -0.8%        0.2%         1.0%          0.1%         0.5%         0.5%         2.6%        10.0%        -7.4%
2018      1.0%        0.7%       -0.9%         1.3%        -0.4%       0.6%       -0.1%        0.2%         0.6%           -2.7%      -0.9%        -1.6%        -2.3%        -9.4%         7.1%
2019      3.2%        0.0%       -2.4%         3.1%        -2.8%       1.4%        0.9%        -2.9%        2.7%          0.4%        -4.0%         0.2%        -0.5%        10.7%       -11.2%
2020      1.0%       -3.9%       -1.5%         3.7%         5.0%       3.0%        0.4%        4.2%         -0.0%         1.5%         8.0%         2.8%       26.5%          4.6%       21.9%
2021      -2.3%       5.9%        0.0%         2.5%         0.3%       0.1%                                                                                      6.5%         7.9%        -1.4%

I Cumulative Alpha* above HFRX
  350%
                                                                                                        Statistics – 31/05/2003-30/06/2021                      Kettle Hill           HFRX
  300%                                                                                                  Annualised return                                            9.0%              1.7%
  250%
  200%                                                                                                  Annualised volatility                                        7.6%              7.4%
  150%
                                                                                                        Annual Sharpe Ratio                                          1.16              0.19
  100%
   50%                                                                                                  Max drawdown                                               -17.3%             -29.5%
    0%
                                                                                                        Beta to HFRX                                                 0.59              1.00
       M 04

       M 05

       M 06

       M 07

       M 08

       M 09

       M 10

       M 11

       M 12

       M 13

       M 14

       M 15

       M 16

       M 17

       M 18

       M 19

       M 20

             1
          -2
          -

          -

          -

          -

          -

          -

          -

          -

          -

          -

          -

          -

          -

          -

          -

          -

          -
        ay

        ay

        ay

        ay

        ay

        ay

        ay

        ay

        ay

        ay

        ay

        ay

        ay

        ay

        ay

        ay

        ay

        ay

                                                                                                        Correlation to HFRX                                          0.58              1.00
       M

                                                                           * Beta adjusted Alpha
                  Past performance is no guide to future performance and the value of investments and income from them can fall as well as rise.
Sources: Kettle Hill, Bloomberg, AlternativeSoft.
Kettle Hill represents the Kettle Hill Partners, LP Fund (net of fees). HFRX represents the Hedge Fund Research HFRX Equity Hedge Index. Please refer to important information on page 2. Past
performance of Kettle Hill Partners, LP is no indication of future performance of the Heptagon Kettle Hill U.S L/S Equity Fund (Irish UCITS Fund).                                               25
                                                                                                                                                                              25
PERFORMANCE OF KETTLE HILL PARTNERS, LP as of 30/06/2021 (net of fees)
I Historical Cumulative Returns
Investment growth of Kettle Hill Partners, LP since June 30, 2003 vs. Hedge Fund Research HFRX Equity Hedge
400%
Kettle Hill Partners, LP (net of fees)
350% I Annualised Returns
Hedge Fund Research HFRX Equity Hedge Index
300%
YTD 1 Yr 3 Yrs 5 Yrs 10 Yrs
250%
200% Kettle
6.5% 9.0% 8.6% 7.8% 7.2%
Hill
150%
100%
HFRX 7.9% 1.7% 4.1% 5.3% 2.4%
50%
0%
+/- -1.4% +7.3% +4.5% +2.5% +4.8%
M 04
M 05
M 06
M 07
M 08
M 09
M 10
M 11
M 12
M 13
M 14
M 15
M 16
M 17
M 18
M 19
M 20
1
-2
-50%
-
-
-
-
-
-
-
-
-
-
-
-
-
-
-
-
-
ay
ay
ay
ay
ay
ay
ay
ay
ay
ay
ay
ay
ay
ay
ay
ay
ay
ay
M
Past performance is no guide to future performance and the value of investments and income from them can fall as well as rise.
Sources: Kettle Hill, Bloomberg, AlternativeSoft.
Kettle Hill represents the Kettle Hill Partners, LP Fund (net of fees). HFRX represents the Hedge Fund Research HFRX Equity Hedge Index. Please refer to important information on page 2. Past
performance of Kettle Hill Partners, LP is no indication of future performance of the Heptagon Kettle Hill U.S L/S Equity Fund (Irish UCITS Fund).
26
26PORTFOLIO ANALYSIS – HEPTAGON KETTLE HILL US L/S EQUITY FUND
PORTFOLIO CHARACTERISTICS                                                           as of 31/05/2021

  I Portfolio Characteristics          Long    Short    Top 5 Longs

    Number of positions                 48      43      Ulta Beauty Inc                       3.6%

                                                        Wynn Resorts Ltd                      3.1%
    >$10bn                             37.5%   -22.8%
                                                        APA Corp                              3.1%

    $5bn-$10bn                         11.4%   -1.5%    Park Hotels & Resorts Inc             3.0%

                                                        Alphabet Inc                          3.0%
CASE STUDIES The companies discussed in this document below were chosen as representations of the type of stocks held in the Heptagon Kettle Hill US L/S Equity Fund (Irish UCITS Fund). The stocks are not presented to demonstrate performance. Holdings are subject to change and may not reflect recent market activity or current holdings. This information is not provided to the recipient for the purpose of soliciting investment advisory clients for Kettle Hill. This information is not intended to provide investment advice. Nothing herein should be construed as a solicitation, recommendation or an offer to buy, sell or hold any securities, market sectors, other investments or to adopt any investment strategy or strategies. You should assess your own investment needs based on your individual financial circumstances and investment objectives. This material is not intended to be relied upon as a forecast or research. The opinions expressed are those of Kettle Hill as of 22nd August, 2017 and are subject to change at any time due to changes in market or economic conditions. The following case study slides have not been updated since 22nd August, 2017 and may not reflect recent market activity. The information and opinions contained in this material are derived from proprietary and non-proprietary sources deemed by Kettle Hill to be reliable and are not necessarily all inclusive. Kettle Hill does not guarantee the accuracy or completeness of this information. There is no guarantee that any forecasts made will come to pass. Reliance upon information in this material is at the sole discretion of the reader.
TACTICAL CASE STUDY: REGIONAL BANKS

                      Our strategy is largely defined by our research process and driven by fundamental, bottoms-up stock selection. From time
                      to time, there are instances where the Advisor may seek tactical exposure based on a macro view.

 I SPDR KBW REGIONAL BANKING ETF (KRE)                                                               I 1Q/2Q 2016 Backdrop:
 1/1/2016 ($41.57) to 4/30/2017 ($54.05); Low: 02/11/16 $32.89                                       •    Overall negative consensus macro view; Market drop in 1Q 2016
                                                                                                     •    US Federal Reserve talks down rate hike expectations
                                                                                                              •   US GDP growth strengthening
                                                                                                              •   Weakening US dollar; strengthening commodities - Oil, High
                                                                                                                  yield debt both rally
                                                                                                     •    Chinese Central Bank supports lending
                                                                                                     •    European Central Bank and Bank of Japan cut interest rates, increase
                                                                                                          Quantitative Easing programs
                                                                                                     •    Brexit concerns
                                                                                                     I Investment Opportunity: Regional Banks (Jan’16 –
                                                                                                     Apr ‘17)
                                                                                                 Stocks sold off given concerns regarding prior energy loan exposure,
                                                                                                 interest rate sensitivity, Priced in no interest rate hikes/possible negative
                                                                                                 interest rate movement
                                                                                                 Kettle Hill investment research focus:
                                                                                                 •       Tangible Price-to-Book Valuations
 Stocks/ETFs invested in during period include:         Zions                                    •       Loan Book Strength (first lien loans)
 Bancorporation (ZION), Comerica Inc. (CMA), Texas Capital                                       •       Energy exposure – portfolio concentration, diversification among
 Bancshares (TCBI), Banc of California Inc. (BANC), SPDR KBW                                             upstream/midstream/downstream and energy service providers;
 Regional Banking ETF (KRE)                                                                              protected vs historic default/recovery rates, pre-provision income
                                                                                                 •       Est. Cost Savings – reducing efficiency ratio, improve return on capital
                                                                                                 •       Insider Buying
                    Past performance is no guide to future performance and the value of investments and income from them can fall as well as rise.
Source: Kettle Hill
These examples are for illustrative purposes only. All information is internal, and has not been verified by any external source. Kettle Hill may or may not own these securities currently.   30
TACTICAL CASE STUDY: 2016 US PRESIDENTIAL ELECTION
Our strategy is largely defined by our research process and driven by fundamental, bottoms-up stock selection. From time
to time, there are instances where the Advisor may seek tactical exposure based on a macro view.
I 4Q 2016 Backdrop: I Exposure Management/Positioning:
• Consensus election view favored Clinton Presidential victory • Non-consensus viewpoint :
• Early Polling - March 30th, 2016, Rasmussen Polls: Clinton • We estimated that pundits were incorrect – Trump
41% vs Trump 36% victory would be bullish (tax reform, infrastructure, etc.)
• Estimated downside (down -5% in near term) already
• Late Polling – Nov 7th, 2016, Rasmussen Polls: Clinton 45%
priced into market
vs Trump 43%
• Increased net exposure to approx. early Nov 7th – Net @
• Market discounting uncertainty surrounding any potential Trump
40% (versus historic avg. of 25%)
Presidential victory; Standard Republican platform
• Reduced net exposure after market moves, November
• S&P Range from September 22nd (SPX: 2177) to
30th net exposure ~ 13%
November 3rd (SPX: 2088) approximately -5%
Past performance is no guide to future performance and the value of investments and income from them can fall as well as rise.
Source: Kettle Hill
These examples are for illustrative purposes only. All information is internal, and has not been verified by any external source. Kettle Hill may or may not own these securities currently.
31CASE STUDY – LONG: inContact, INC. (SAAS)
The following is a highlight of an investment in inConact, Inc. (SAAS), a provider of cloud contact centre software solutions.
• Research subsequent to research of “software-as-a-service” (SAAS) space, call center data/software companies gaining traction
within enterprise software
• Focus on companies with changing dynamics, enterprise adoption : high topline growth rates/margins, high streams of
recurring revenues, attractive valuations
• Conference meeting with FIVN (1/13/16), with follow up site visit (3/4/16) - leading to SAAS research
I SAAS Chart/Kettle Hill Activity I Kettle Hill Analysis
• Significant uptick in enterprise
adoption of cloud software
technology, strong product
offering
• Revenues: 2016 Street
Consensus @ $260mm vs KH
Est of $275mm; growth rate
~25%
• Margins: Consolidated @ 50+%,
Software @ 60+%
• Per KH Estimates, trading ~ 2x
EV/Sales, vs SAAS group trading
at 3-5x EV/Sales
• Valuation: $9-$10/share
(*Company acquired by NICE
Ltd., May 18th, 2016 for
$14/share)
Past performance is no guide to future performance and the value of investments and income from them can fall as well as rise.
Source: Kettle Hill
These examples are for illustrative purposes only. All information is internal, and has not been verified by any external source. Kettle Hill may or may not own these securities currently.
32CASE STUDY – LONG: PEREGRINE SEMICONDUCTOR (PSMI)
The following is a highlight of an investment in Peregrine Semiconductor (PSMI), a fabless provider of
high-performance radio frequency integrated circuits.
• Initial IPO, 8/8/12 @ $14
• Company faced a patent infringement event several months later that excluded the company from design inclusion in one of its
largest client’s products.
• Result: Consensus Estimates for Sales/EBITDA/EPS from $60mm/$8.35mm/$0.15/share to $45.8mm/$0.6mm/$(0.02)/share
I PSMI Chart/Kettle Hill Activity I Kettle Hill Analysis
• Recognised Insider Buying
Activity
• Meetings with PSMI
management
• Cash on hand, NOLs = $3/share
• Sum-of-Parts Valuation: High
Performance Semi business =
$6/share + IP Valuation =
$3/share; Total SOP Value =
$12/share
• KH Valuation: ~$12/share
(*Company acquired by Murata
@ $12.50/share)
Past performance is no guide to future performance and the value of investments and income from them can fall as well as rise.
Source: Kettle Hill
These examples are for illustrative purposes only. All information is internal, and has not been verified by any external source. Kettle Hill may or may not own these securities currently.
33CASE STUDY – SHORT: PARTY CITY HOLDCO INC. (PRTY)
The following is a highlight of an investment in Party City Holdco Inc. (PRTY), a retailer of party goods, costumes throughout North
America.
• Private Equity buyers IPO’d company in April 2015
• Prior Years – 2014/15: Halloween falls on Friday, Saturday respectively (Strong prior year performance, current year
expectations)
• Halloween is large component of business; 4Q is 35% of sales, 75% of earnings.
I PRTY Chart/Kettle Hill Activity I Kettle Hill Analysis
• Weaker same store sales
expectations for Halloween, 4Q
performance (Halloween falling
on Monday, Oct 31, 2016)
• Weaker internet search trends
YOY into Halloween
• Internet sales of costumes,
party goods taking market
share from brick-and-mortar
party shops
• Media fragmentation makes it
hard for retailers to focus on,
carry the right licenses
• Superhero fatigue/flops at box
office; Superman/Batman
struggles at box office
• Disney – no new titles vs prior
years; no visibility into new
titles
Past performance is no guide to future performance and the value of investments and income from them can fall as well as rise.
Source: Kettle Hill
These examples are for illustrative purposes only. All information is internal, and has not been verified by any external source. Kettle Hill may or may not own these securities currently.
34CASE STUDY – SHORT: POLARIS INDUSTRIES INC. (PII)
The following is a highlight of an investment in Polaris Industries Inc. (PII), designer, engineer and manufacturer of on/off-road
vehicles.
• Due diligence/research arose from work on competitor, Arctic Cat (ACAT); prior CEO warning of industry headwinds
(competition, pricing, FX)
• Company had years of significant sales, earnings growth, traded 20x forward PE estimates, above $150/share
I Pll Stock Chart I Kettle Hill Analysis
• PII had grown earnings 20+% in the
prior two years; our research/due
diligence suggested that may slow to
low-mid teens rate
• As a result, street estimates for
2H2015/FY2016 may fall precipitously
(street estimates – 2016: $8.67/share.
KH estimates for 2016: $6.50/share)
• PII Inventories up 20%, while sales up
12%
• Negatives: FX headwinds, new
products coming in market with
significant discounts on pricing
• KH Target: $98/share (based on
roughly 15x our forward EPS
estimates)
• KH began shorting stock in late
June 2015 at an initial price of
$150/share, with several trades
around the stock over the next
several months.
• The last trade to cover an
outstanding short position was in
early April 2016 at a price of
$95.39/share.
Past performance is no guide to future performance and the value of investments and income from them can fall as well as rise.
Source: Kettle Hill
These examples are for illustrative purposes only. All information is internal, and has not been verified by any external source. Kettle Hill may or may not own these securities currently.
35KETTLE HILL INVESTMENT TEAM
KETTLE HILL MANAGEMENT TEAM

  The biographies below are for all employees at Kettle Hill that support the Fund or are responsible for the portfolio management (including
  idea generation, portfolio construction, security selection, investment research and risk management) of the Fund.

                                                        Andrew Kurita is the Founder of Kettle Hill Capital Management, LLC and has served as the Portfolio Manager
           Andrew Y. Kurita, CFA                        since its inception in 2003. Prior to this role, he was a Vice President at Andor Capital Management, LLC covering
         Chief Investment Officer and                   the industrial sector on the Diversified Growth Fund. From 1996 until 2001, Andrew worked at Cramer Rosenthal
                                                        McGlynn, LLC, where he was a Vice President and Analyst on the hedge fund and small-cap value products. He is
                Portfolio Manager                       a CFA® charterholder with 25 years of small-cap and hedge fund investing experience. He graduated cum laude
                                                        with honours with a BA in Economics from Williams College, 1995.

    Afroz Qadeer is the CEO of Kettle Hill Capital Management, LLC. Prior to Kettle Hill, Mr. Qadeer spent several
    years in the alternative investments industry developing and managing multi-manager portfolios across a range
    of hedge fund strategies. Most recently, Mr. Qadeer co-founded Equinox Institutional Asset Management, LP,
    serving as its President and Chief Investment Officer. Equinox Institutional Asset Management was the
    rebranding of Tapestry Asset Management, LP, which was founded by Mr. Qadeer in 2002 and subsequently                                                 Afroz Qadeer
    acquired by Equinox Financial Group in January 2013. Mr. Qadeer has also held tenures in hedge fund research                                       Chief Executive Officer
    and portfolio management roles with Goldman Sachs Asset Management, Optima Fund Management, and Lake
    Partners. Mr. Qadeer holds an MBA from The Wharton School, University of Pennsylvania, and a Bachelor of
    Commerce from Sydenham College, University of Bombay, India.

                                                        Bryan Kiss is the CFO and CCO at Kettle Hill Capital Management, LLC. He has been with the firm since its
             Bryan R. Kiss, CPA –                       inception in 2003. Prior to his current role, he was an Analyst at Capital Management Associates, Inc. for two
                                                        years, an investment management firm specializing in small-cap stocks. From 2000 to 2001, he was an Analyst at
         Chief Financial Officer, Chief
                                                        Cramer Rosenthal McGlynn, LLC. Preceding that, Bryan worked at Arthur Andersen, LLP. Mr. Kiss is a Certified
               Compliance Officer                       Public Accountant with 24 years of combined investing and accounting experience and graduated magna cum
                                                        laude with a BS in Accounting from Binghamton University, 1997.

                      Past performance is no guide to future performance and the value of investments and income from them can fall as well as rise.
                                                                                                                                                                                 37
Source: Kettle Hill. Sauren Golden Awards 2020 - Two gold medals for excellent fund management for Absolute Return (Long/Short Equity) USA category.
                  1
                                                                                                                                                                      37
KETTLE HILL MANAGEMENT TEAM & KETTLE HILL TEAM
Brian Appleton joined Kettle Hill Capital Management, LLC in 2014 as Director of Marketing. Prior to this role,
Brian R. Appleton he worked at SunTrust Robinson Humphrey as a Director in Equity Research Sales from 2009 until 2013. He
worked at Jefferies, LLC from 2002 until 2008, initially in healthcare equity research before taking on a role as
Director of Marketing, Investor
Vice President in Equity Research Sales. From 1995 until 2000, he was an Investment Officer at AmSouth
Relations Bancorporation (FANB). He holds an MBA from Vanderbilt University, 2002 and a BS in Finance, Business
Administration from the University of Tennessee, Knoxville, 1995.
Brian Cullinane joined Kettle Hill Capital Management, LLC as an Analyst in 2017. He spent the prior four years
at Wolfe Research, LLC as a Vice President on the Consumer: Staples and Hardlines Retail research team. Brian Cullinane
Previously, Brian was a research associate on the Consumer: Food & Drug Retail team at Jefferies, LLC from
Generalist Analyst
2010 to 2013. He holds an MBA in Finance, 2009, and a BBA in Finance, 2008, from Loyola University
Maryland.
Mr. Goldberg brings 28 years of investment experience to the team at Kettle Hill. Stuart joined the team in
February 2018 as a Generalist Analyst, after having worked at the firm from 2013 to 2014. More recently he
spent four years working as a Senior Research Analyst at Litespeed Partners. From 2012 to 2013, he worked
Stuart Goldberg as a Research Consultant at Daruma Hinoki Fund. Prior to that role, he was a Senior Research Analyst at
CastleRock Management, LLC from 2009-2012. From 2002 to 2009, Mr. Goldberg was the Founder/Chief
Generalist Analyst Investment Officer at PSD Capital Management. From 1997 to 2002 he served as an Analyst at Feirstein
Capital Management, LLC. From 1993 to 1997 he was the Manager of Small Companies Research at Merrill
Lynch and Company. He holds an MBA, focusing on Finance, from New York University, 1992, and a BSBA,
Finance, from Boston University, 1983.
Source: Kettle Hill
38
38KETTLE HILL TEAM
Mr. Moynihan joined Kettle Hill Capital Management as an Analyst in 2018, bringing approximately 23 years of
investment experience to the Firm. Before his start date in April 2018, he worked at the firm from 2005 to 2013.
James M. Moynihan
More recently he spent nearly two years working as a Portfolio Manager at UBS O’Connor. From 2014 to 2015, he
Generalist Analyst worked as an Analyst at WaveLength Asset Management. From 1998 to 2005, Mr. Moynihan worked as a Senior
Telecommunications Services Analyst at Merrill Lynch. He holds a BA in Economics from Bates College, 1995.
Paul Basile brings over 28 years of trading and investing experience to the team at Kettle Hill Capital
Management, LLC. He has been in his current role with the firm since 2005. Prior to that, he was the Head
Trader at AJB Capital, LLC for two years. From 2001 until 2004, he traded Financials for the Diversified Growth
Paul M. Basile
Fund at Andor Capital Management, LLC. From 2000 until 2001, he worked at J.P. Morgan Securities, LLC as an
Assistant Equity Trader in Block Trading. From 1993 until 2000, he traded Preferred Securities at Paine Webber Trader
& Co. Mr. Basile served in the United States Navy, where he was a Surface Warfare Officer. He holds a BS in
History from the United States Naval Academy, 1989 and an MBA in Finance from Fordham University, 1999.
Mr. Jolley joined Kettle Hill Capital Management as an analyst in April 2018. Prior to this role, he worked as a
Thomas R. Jolley Private Equity researcher at the Burgiss Group, and in the pharmaceutical industry as a drug safety consultant,
specializing in pharmacovigilance. He holds an MA in Imperial History from King’s College London, an MA in
Generalist Analyst
History & Literature from Columbia University, and a BA in Economics from Drew University.
Mr. Mehra joined Kettle Hill Capital Management as an Investor Relations Analyst in August 2018. Prior to this
Rishabh Mehra
role, he worked as a Financial Analyst at the River Partners Capital Management, and as a Sales intern at Olden
Lane. He holds a Bachelor of Science in Economics from Drexel University. Generalist Analyst
Source: Kettle Hill
39
39FUND PARTICULARS AND STRUCTURE
HEPTAGON KETTLE HILL US L/S EQUITY FUND PARTICULARS

                                                   An open-ended umbrella type investment company authorised pursuant to the European Communities (Undertakings
 Legal Structure
                                                   for Collective Investment in Transferable Securities) Regulations 2011, as amended.

  Share Classes                                    A (Retail) /       C (Seed – closed) / I (Institutional) / S (Institutional)

                                                   A           IE00BF1D6B55
                                                   C           IE00BF1D7122 (closed)
  ISIN / Bloomberg Ticker
                                                   I           IE00BF1D7H82
                                                   S           IE00BF1D9H23

  Exchange Listed                                  None

                                                   Austria, Denmark, Finland, France, Germany, Ireland, Italy, Luxembourg, Netherlands, Norway, Spain, Sweden,
  Registered for Retail Sale
                                                   Switzerland, UK
  Registered for Accredited
                                                   Singapore (CISNET restricted scheme)
  Investors
  Minimum Investment                               A = $15,000 / C = $1,000,000 (closed)             /    I = $2,000,000           /    S = $20,000,000

  Management Fee                                   A = 1.75%      /     C = 1.00% (closed)        /      I = 1.50%             /       S = 1.25%

  Performance Fee                                  A = 15%        /     C = 15% (closed)         /       I = 15%           /           S = 15%

  Subscriptions                                    Daily - T+3 Settlement

  Redemptions                                      Daily - T+5 Settlement

                                                   Base Currency of Fund: USD
  Currency Denomination
                                                   Hedged Share Classes: EUR, GBP, CHF

  Lock-up Provision                                None

  Leverage                                         Up to 150%

  Sub-Investment Manager                           Kettle Hill Capital Management

  Depositary                                       Brown Brothers Harriman Trustee Services (Ireland) Limited

  Administrator                                    Brown Brothers Harriman Fund Administration Services (Ireland) Limited

  Lawyers                                          Simmons & Simmons LLP, Dublin
  Auditor                                          Grant Thornton LLP
Please refer to important information on page 2.                                                                                                                 41
APPENDIX
KETTLE HILL AUM HISTORY

A. 2003: Founded by Andrew Kurita, PM and Bryan
   Kiss, CFO/CCO

B. 2008: Financial Crises leads to client (FOF)
   redemptions. AUM at end year approx. $69mm
                                                       800
                                                                 Firm AUM ($,mm)
C. March 2010: Total Firm AUM exceed $100mm
                                                       700
D. December 2012: New Institutional and FOF client                                                 J
   mandates won, AUM increases to $194mm at
   peak
                                                       600
E. January 2014: Client specific, non-performance
   related redemptions: Firm AUM decreases to
   $76mm                                               500
                                                                                               H
F.   2015/2016: Launch of segregated accounts as
     sub-advisor for US 40 Act Funds                   400

G. September 2017: New Institutional client                                                G
   mandate won. Total Firm AUM exceeds $200m           300
                                                                 B

H. October 2017: Heptagon Kettle Hill US L/S Equity                          D
   UCITS Fund launch. Total Firm AUM exceeds           200                             F
   $300m
                                                             A        C            E
I.   August 2018: Heptagon Kettle Hill US L/S Equity   100
     Fund reaches $135m. Total Firm AUM exceeds
     $500m
                                                         0
J.   December 2018: Heptagon Kettle Hill US L/S
                                                       Ju -03

                                                       Ju -04

                                                       Ju -05

                                                       Ju -06

                                                       Ju -07

                                                       Ju -08

                                                       Ju -09

                                                       Ju -10

                                                       Ju -11

                                                       Ju -12

                                                       Ju -13

                                                       Ju -14

                                                       Ju -15

                                                       Ju -16

                                                       Ju -17

                                                              8
                                                        ec 3

                                                        ec 4

                                                        ec 5

                                                        ec 6

                                                        ec 7

                                                        ec 8

                                                        ec 9

                                                        ec 0

                                                        ec 1

                                                        ec 2

                                                        ec 3

                                                        ec 4

                                                        ec 5

                                                        ec 6

                                                        ec 7

                                                        ec 8
     Equity Fund reaches $288m. Total Firm AUM

                                                            -1
                                                       D -0

                                                       D -0

                                                       D -0

                                                       D -0

                                                       D -0

                                                       D -0

                                                       D -0

                                                       D -1

                                                       D -1

                                                       D -1

                                                       D -1

                                                       D -1

                                                       D -1

                                                       D -1

                                                       D -1

                                                       D -1
                                                          n

                                                          n

                                                          n

                                                          n

                                                          n

                                                          n

                                                          n

                                                          n

                                                          n

                                                          n

                                                          n

                                                          n

                                                          n

                                                          n

                                                          n

                                                          n
                                                       Ju

     exceeds $700m

Source: Kettle Hill
                                                                                                   43
KETTLE HILL CAPITAL MANAGEMENT – ORGANISATIONAL COMMITTEES
I Management Committee I Valuation Committee
The Management Committee is responsible for setting the longer- The Valuation Committee is responsible for Firm-wide
term strategic objectives of the firm as well as handling significant pricing/valuation assessments. Members include: Andrew Kurita,
business issues facing the firm. Members include: CEO Afroz Bryan Kiss, Paul Basile and Afroz Qadeer as members.
Qadeer, CIO/PM Andrew Kurita, CFO/CCO Bryan Kiss, and Director
of Marketing Brian Appleton. Meeting Frequency: As needed
Meeting Frequency: Quarterly, or as needed
I Best Execution Committee I Risk Committee
The Best Execution Committee systematically evaluates and The Risk Committee is also responsible for Firm-wide risk
documents the execution performance of its brokers. The review assessment. It will review the overall risk, liquidity, exposure levels,
of brokers will consist of various factors, including, as applicable, leverage, trading, and portfolio constraints of the Funds. This will
the factors set forth below: include compliance of all the accounts managed by Kettle Hill with
their Respective mandates. The Risk Committee will also review all
• average commission rates /reasonableness of such rates compliance, communications/IT, and trading vendor relationships.
• the value of research provided
Members include: CEO Afroz Qadeer, CIO/PM Andrew Kurita,
custody / prime brokerage services
CFO/CCO Bryan Kiss, and Director of Marketing Brian Appleton.
• unusual trends (i.e. - higher than usual commission rates, large
volume of business directed to unknown broker) Meeting Frequency: Quarterly, or as needed
• responsiveness
execution capability
financial condition
Members include: CEO (Afroz Qadeer), Chief Investment Officer
(Andrew Kurita), CFO/CCO (Bryan Kiss) and the Head Trader (Paul
Basile).
Meeting Frequency: Quarterly
Source: Kettle Hill
44PORTFOLIO LIQUIDITY ANALYSIS
• Portfolio liquidity is shown assuming $500mm AUM and 20% of trailing 30 day volume
• 92% of the long portfolio and 99% of the short portfolio can be liquidated in one week or less
• 100% of the long portfolio and 100% of the short portfolio can be liquidated in one month or less
Longs Days to Liquidate 1 day 2 days 3 days 4 days 5 days 10 days 20 days >20 days
%NAV 28.5% 36.8% 40.9% 43.7% 46.2% 28.5% 28.5% 28.5%
% of Long 56.5% 72.9% 81.0% 86.6% 91.6% 28.5% 28.5% 28.5%
Long days to liquidate assuming a 10% decline in 30day average volume
%NAV 27.1% 35.9% 39.9% 42.7% 45.0% 49.7% 50.5% 0.0%
% of Long 53.6% 71.1% 79.1% 84.5% 89.1% 98.4% 100.0% 0.0%
Shorts Days to Liquidate 1 day 2 days 3 days 4 days 5 days 10 days 20 days >20 days
%NAV -31.3% -33.6% -34.4% -34.8% -35.2% -35.5% -35.5% 0.0%
% of Long 88.1% 94.5% 96.7% 98.0% 99.0% 100.0% 28.5% 0.0%
Short days to liquidate assuming a 10% decline in 30day average volume
%NAV -30.8% -33.3% -34.2% -34.6% -35.0% -35.5% -35.5% 0.0%
% of Long 86.7% 93.8% 96.2% 97.5% 98.5% 100.0% 100.0% 0.0%
Source: CurAlea as of 31/07/2017. CurAlea Associates LLC is a provider of portfolio risk and software solutions. Kettle Hill uses CurAlea as its outside risk consultant to provide analysis on the
Fund’s holdings.
45DISCLAIMER
DISCLAIMER

Heptagon Capital Limited, Heptagon Capital LLP and its affiliate companies and its members, officers, employees, agents and advisors disclaim any and all liability
relating to these materials, except to the extent required by applicable law or regulations, including, without limitation, any express or implied representations or
warranties for statements or errors contained in, and omissions from, these materials. Certain assumptions have been made, and/or parameters set, in the
preparation of these materials which have resulted in the returns detailed herein, and no representation or warranty is made that any returns indicated will be
achieved. Changes to assumptions or parameters may have a material impact on the returns detailed. This document should not be copied to any other person
without our express consent. This document should not be considered an offer to buy or sell investments.

Heptagon Capital Limited has issued this communication as investment manager for Heptagon Fund PLC (the “Company”), an umbrella fund with segregated
liability between sub-funds (the “Funds”) and authorised pursuant to the European Communities (Undertakings for Collective Investment in Transferable Securities)
Regulations, 2011, as amended, and is licensed to conduct investment services by the Malta Financial Services Authority. Heptagon Capital LLP is authorised and
regulated in the UK by the Financial Conduct Authority and is the sub-investment manager for a number of the Funds.

The results given in this document are based solely upon historical fund performance as gathered and supplied by Brown Brothers Harriman Fund Administration
Services (Ireland) Limited, the Company’s administrator, Refinitiv and Morningstar. That past performance has not been independently verified by either Heptagon
Capital Limited or Heptagon Capital LLP. It is not intended to predict or depict the future performance of any investment.

The information contained herein is provided for informational purposes only, is not complete, and does not contain certain material information about the Funds,
including important disclosures and risk factors associated with an investment in the Funds. Before making an investment in any Fund, prospective investors are
advised to thoroughly and carefully review the Company’s prospectus (the “Prospectus”) as well as the supplement to the Prospectus for the Fund and the Fund’s
key investor information document with their financial, legal and tax advisors to determine whether an investment is suitable for them. An investment in the Funds
is not suitable for all investors.

The distribution of information contained herein and the sale of shares in the Funds may be subject to legal or regulatory restrictions in certain countries in which
applicants for shares are resident or of which they are citizens. In particular, neither the shares in the Funds nor the Funds themselves have been registered under
any United States ("US") Securities legislation and are not available for purchase by US persons (as defined in the Prospectus).

The Heptagon Kettle Hill US L/S Equity Fund takes sustainability risks into account within the investment process and this is disclosed in accordance with Article 6
requirements of the EU’s Sustainable Finance Disclosure Regulation. However, the Fund does not have as its objective sustainable investment and does not
promote environmental or social characteristics for the purposes of the EU’s Sustainable Finance Disclosure Regulation.

                                                                                                                                                                  47
You can also read


