Heterogeneous rarity patterns drive price dynamics in NFT collections
←
→
Page content transcription
If your browser does not render page correctly, please read the page content below
www.nature.com/scientificreports
OPEN Heterogeneous rarity patterns
drive price dynamics in NFT
collections
Amin Mekacher 1, Alberto Bracci1, Matthieu Nadini 2, Mauro Martino3,
Laura Alessandretti 4, Luca Maria Aiello 5 & Andrea Baronchelli 1,6,7*
We quantify Non Fungible Token (NFT) rarity and investigate how it impacts market behaviour by
analysing a dataset of 3.7M transactions collected between January 2018 and June 2022, involving
1.4M NFTs distributed across 410 collections. First, we consider the rarity of an NFT based on the set
of human-readable attributes it possesses and show that most collections present heterogeneous
rarity patterns, with few rare NFTs and a large number of more common ones. Then, we analyze
market performance and show that, on average, rarer NFTs: (i) sell for higher prices, (ii) are traded less
frequently, (iii) guarantee higher returns on investment, and (iv) are less risky, i.e., less prone to yield
negative returns. We anticipate that these findings will be of interest to researchers as well as NFT
creators, collectors, and traders.
Non Fungible Tokens, or NFTs, are digital titles (tokens) to property, either real or virtual, stored on a blockchain.
They offer a powerful solution to long-standing issues related to the ownership of virtual and physical assets. They
have swiftly revolutionised the art m arket1, the world of c ollectibles2, the gaming i ndustry3, and are promising
to do the same with such sectors as luxury4, fashion5, music6, entertainment7, and real-estate8,9. Throughout
2021, the NFT market grew by more than 61,000%, starting from a monthly sale volume of 8,072,866 USD in
January 2021 to 4,968,834,938 USD in January 2 02210. NFT was Collins Dictionary’s word of the year for 2 02111.
NFT collections are groups of NFTs that share common features, such as visual aspects or the code that gener-
ated them12. They have been a driving force for the booming NFT market9,13. In the prominent case of generative
art, NFTs are associated to (virtual) objects made using a predetermined system, typically an algorithm, that
often includes an element of c hance14. To be concrete, CryptoPunks is a collection of 10,000 unique images of
pixelated human faces algorithmically g enerated15, while Bored Ape Yacht Club contains 10,000 profile pictures
of cartoon apes that are generated by an algorithm16. Their market capitalization is 834M USD and 1.2B USD
as of June 2022, r espectively17.
NFTs in a collection are most often distinguishable from one another. For example, CryptoPunks have a gen-
der (6039 male and 3840 female) and—as for many other collections—a number of traits that distinguish them.
So a punk can have, or not have, a “Top Hat”, a “Red Mohawk”, a “Silver Chain”, or “Wild White Hair” among
other possibilities. Furthermore, while most CryptoPunks are humans, there are also 88 Zombies, 24 Apes, and
9 Aliens in the collection. CryptoPunks are not equivalent according to the market. The most expensive Cryp-
toPunk to date was sold for 23.7 million USD on February 12, 202218, despite the average price of a punk being
“only” 138,179 USD (see a lso19). A similar picture holds for Bored Apes, with the most expensive one traded for
3.4 million USD on October 26, 2 02120, vs an average price of 48,836 USD.
An hypothesis to rationalise these differences in price considers rarity. The heterogeneous distribution
of traits among NFTs make some of them more rare than others (see Fig. 1), and scarcity is attractive for
collectors21–24. However, despite some evidence that rarity and aesthetic preferences do play a role in the case of
CryptoPunks19,25, a comprehensive analysis of the role of rarity on the market of NFTs is still lacking.
In this paper, we carry out a systematic investigation of how the rarity of NFTs impacts their market behav-
iour. We focus on within-collection rarity using the definition proposed in the platform rarity.tools 17. Our
dataset describes the rarity of 410 collections listed on OpenSea, containing a total of 1,479,020 NFTs that were
exchanged 3,775,040 times between January 23, 2018 and June 6, 2022. First, we characterise trait distributions
and investigate how they impact NFT rarity. Then, we analyse transaction data and find that: (i) rarity positively
1
Department of Mathematics, University of London, London EC1V 0HB, UK. 2Elliptic Inc., London, UK. 3IBM
Research, Cambridge, MA, USA. 4Technical University of Denmark, 2800, Kgs. Lyngby, Denmark. 5IT University
of Copenhagen, Copenhagen, Denmark. 6UCL Centre for Blockchain Technologies, University College London,
London WC1E 6BT, UK. 7The Alan Turing Institute, London NW1 2DB, UK. *email: abaronchelli@turing.ac.uk
Scientific Reports | (2022) 12:13890 | https://doi.org/10.1038/s41598-022-17922-5 1
Vol.:(0123456789)www.nature.com/scientificreports/
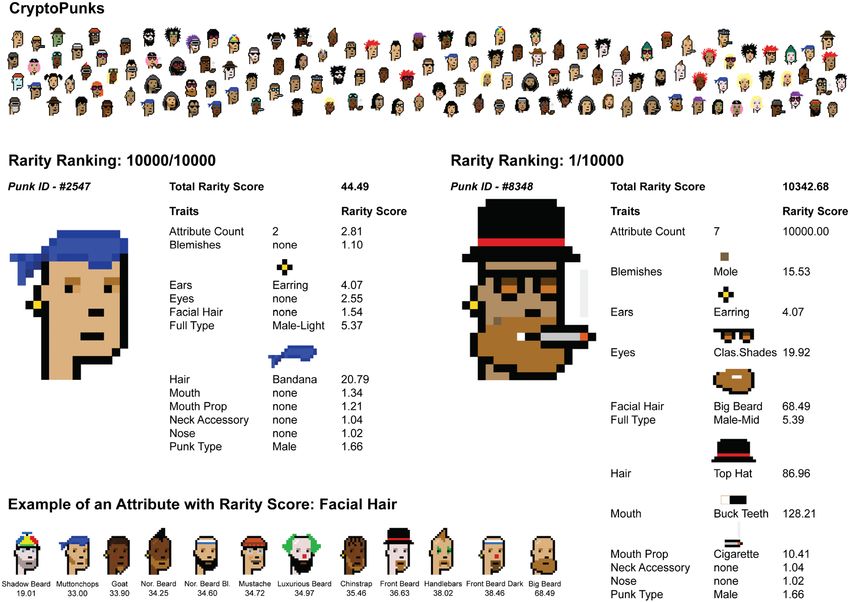
Figure 1. Illustration of rarity in a collection. Demonstration of the visual difference between rare and common
NFTs using the example of CryptoPunks. CryptoPunk #2547 (on the right) is the least rare, as it has traits that
appear frequently in the collection (i.e., the bandanna and the earring). CryptoPunk #8348 is the rarest in the
collection, mostly since it is the only one with seven non-null attributes. Rarity scores are not normalised. After
normalisation, the total rarity score for punk #2547 is zero, while the one for #8348 is 100 (min and max of the
collection, respectively). In the bottom left corner, we show, as an example, the rarity score of traits associated to
the “Facial Hair” attribute.
correlates with NFT prices and return on investments (ROIs), and (ii) negatively correlate with number of sales
and risk quantified as the likelihood of a negative ROI. The breadth of our analysis suggests this market behav-
iour is likely to be genuinely self-organised. At the same time, our results could inform further research aimed
at establishing how to optimally design collections, as well as effective trading strategies for the NFT market.
Our work adds to the relatively small yet rapidly growing body of research on the NFT ecosystem. Previous
studies include an overview of the overall market, trade networks, and visual features of NFTs, and their impact
on price p rediction9, as well as of the underlying technologies, such as the blockchain and the smart contracts,
with a risk assessment26. Other research has focused generally on specific marketplaces or collections, analysing
such issues as the determinants of success of NFT artists27, the role of social media attention28, the creators-
collectors network29, and the financial advantage of experienced u sers30. Along this line, research also suggests
that NFTs have become a promising investment as a fintech a sset31. Other lines of research include the analysis
of illicit transactions connected to NFT t rading32,33 and of their connections with financial indicators34–36. The
metaverse, an NFT submarket which has recently garnered attention both from big tech c ompanies37 and popular
NFT creators38, is another focus of r esearch39,40.
Background, data and methods
Glossary of key terms. NFTs An NFT—or Non Fungible Token—is a unit of data stored in a blockchain
that certifies a digital asset to be unique and not interchangeable. It provides uncontroversial answers to such
questions as who owns, previously owned, and created the NFT, as well as which of the many copies is the origi-
nal. Several types of digital objects can be associated to an NFT including photos, videos, and audio. Crucially,
NFTs can be sold and traded, and are used to commodify digital as well as non-digital objects in different con-
texts, such as art, gaming, music and fashion. Started on E thereum41, today NFTs are available on several other
blockchains.
Attributes and traits Attributes refer to human-readable characteristics of an NFT. In generative art, for
example, they usually relate to visual properties of items. Attributes can take one among several values. For
example, in the CryptoPunks collection, every item has the attribute “type” that can take one among the following
traits: “Male”, “Female”, “Zombie”, “Ape” or “Alien”. CryptoPunks have also attributes that capture the presence
of any accessory, such as earrings or bandanas. For the remainder of this study, we refer to the value taken by
an attribute as the trait.
Scientific Reports | (2022) 12:13890 | https://doi.org/10.1038/s41598-022-17922-5 2
Vol:.(1234567890)www.nature.com/scientificreports/
Figure 2. Characteristics of collections. The probability distribution of (a) the total number of NFTs within the
collection; (b) the total number of attributes in the collection; (c) the total number of traits in the collection.
Collections A collection is a group of NFTs whose associated digital items share common features. When
minting an NFT, a creator can include the corresponding item within a collection. In generative art, for example,
items of a collection are created by the same generative algorithm.
Marketplaces Creators and collectors meet in online marketplaces to trade NFTs. The largest of these markets,
OpenSea42, enables any creator to sell their NFTs and, at the moment of writing, it offers 44 million NFTs43. Other
marketplaces feature a curated selection of creators (e.g., Foundation44, SuperRare45, Nifty Gateway46, Feral File47).
NFTs are auctioned on these marketplaces, where the NFT can be sold to the highest bidder or with a declining
price, depending on the kind of auction. After an NFT is minted on a marketplace—i.e., it is converted into a
digital asset on the blockchain—it can be put up for auction. Typically, the first transaction, from the creator of
the NFT to the first user, is different in nature from the subsequent trades (e.g., the first user is often not able to
select a specific NFT from a collection48).
Dataset. Our dataset includes 3,775,040 sales, taking place on the Ethereum blockchain, of 1,479,020 NFTs
from 410 collections, including 61 of the top 100 collections by sales volume according to C oinMarketCap49.
The list of collections considered in this study can be found in the Supplementary Information. The dataset was
built by considering all collections we could automatically match (by name) between rarity.tools17—a website
dedicated to ranking collectible NFTs, also sometimes called Profile Picture NFT projects (PFP), by rarity—and
the Opensea market. From the latter, we collected the release date, NFT traits and all sales concerning these col-
lections that took place between January 23, 2018 and June 6, 2022. To avoid spurious effects, we only considered
user-to-user transactions, where buyer and sellers are both aware of the precise identity of the traded NFT (i.e.,
we discarded the initial creator-to-user transactions). In the following, we refer to the first user-to-user transac-
tion as “primary” sale, and to all subsequent transactions as “secondary” sales. Where not specified, by “sales” we
consider both primary and secondary sales.
Collections in our dataset have on average 7554 NFTs. There is, however, wide heterogeneity across collec-
tions: the standard deviation of the distribution is 194.64, and the mode is 10,000 NFTs (see Fig. 2a). The number
of attributes in a collection is 11.1 ± 0.91, where the reported error corresponds to the standard deviation of the
distribution (see Fig. 2b). As for the number of traits, the average is equal to 415.1, with a standard deviation of
97.6 (see Fig. 2c). On average, an attribute within a collection has 37.4 different traits. More information about
the algorithms used to assign traits to an NFT can be found in the Supplementary Information.
Rarity. The rarity of a trait is quantified as the fraction of NFTs within a collection having this trait. This
value is indicated on OpenSea’s sale page. For a collection containing N NFTs, the trait rarity score, Rt , for a trait
t shared by r NFTs is defined as:
r
−1
Rt = (1)
N
To quantify the overall rarity of an NFT within a collection, we consider each trait independently and define
the NFT rarity score, RNFT , as the sum of the rarity scores of each one of its traits, that is
RNFT = Rt . (2)
t
In order to compare this score between collections, we then normalize the scores within a collection with a min-
max normalization. For a collection with a maximum and a minimum rarity score Rmax and Rmin respectively,
the normalised rarity score Rnorm is given by Rnorm = 100(R − Rmin )/(Rmax − Rmin ). By doing so, every NFT
ends up with a normalised rarity score between 0 (least rare) and 100 (rarest). All the analyses presented in the
main text of this article are based on the NFT rarity score.
Finally, we also consider the NFT rarity rank, where the rarity rank of an NFT is given by the trait rarity rank
of its rarest trait. This metric will allow us to quantify the effect of a rare trait on the market behaviour of an
NFT, regardless of its other traits. Analyses based on the NFT rarity rank can be found in the Supplementary
Information.
Scientific Reports | (2022) 12:13890 | https://doi.org/10.1038/s41598-022-17922-5 3
Vol.:(0123456789)www.nature.com/scientificreports/
Figure 3. The collectible market boom. 30-day rolling average of the daily number of primary sales (blue line),
secondary sales (orange line) and new buyers (i.e., new wallet addresses buying an NFT for the first time, green
line). Inset: 30-day rolling average of the daily trade volume (in USD).
Figure 4. Cumulative distribution of key market properties across collections. (a) Total number of sales per
collection. (b) Total trade volume per collection. (c) Median sale price per collection. In inset: Distribution of
each market property.
Further information on measuring NFT rarity, including a detailed discussion of the above measures, can
be found i n50.
Results
Market growth. We start by investigating the evolution of NFT sales in our dataset over time. We find that
the interest in the collections remained stable until the end of 2020, then started to gain traction in 2021, espe-
cially in terms of available NFTs on the market (see SI Fig. 1). The number of primary sales grew from an aver-
age of 14 daily sales in January 2021 to 784 sales every day in March 2022, when the market peaked, implying a
percentage growth of 5500% (see Fig. 3). Similarly, secondary sales grew by 110,177%, starting from 9 sales/day
in January 2021 and reaching 9925 sales/day in March 2022. Interestingly, around October 2021, the number of
secondary sales started to exceed the number of primary sales, a trend that still holds at the moment of writing.
This surge in activity led to a growth of daily volume of trades of 18,520% between January 2021 and March 2022
(see Fig. 3 inset), and attracted new users. The number of new buyers increased by 41,755% in 2021. These results
indicate an overall growth of the popularity of NFT collections on OpenSea, both with respect to the size of the
NFT community, and to the total market value.
Different collections contributed to varying extents to the growth of the collectible NFT market. Figure 4
shows the distribution of key market properties across NFT collections: total number of sales per collection
(Fig. 4a), total traded volume per collection (Fig. 4b) and collection items median sale price (Fig. 4c).
Collections are widely heterogeneous with respect to market properties. 25.6% of the collections have gener-
ated less than 1000 sales, whereas 17.1% have generated more than 10,000 (see Fig. 4a). Further, 43.9% of the
collections had a total trade volume below a million dollars, whereas 3.64% generated more than a hundred
million dollars of sales on the marketplace (see Fig. 4b). The success of a collection can also be measured by
looking at the median price at which its NFTs are sold on OpenSea. For 18.3% of the collections, the median
sale price is lower or equal to a hundred dollars, whereas it is higher than a thousand dollars for 12.9% of the
considered collections (see Fig. 4c). These findings indicate that collectibles NFT do not meet the same success
on OpenSea, a claim that is supported by the infamous success stories of a few collections, whereas the others
quickly become a flop on the platform51.
Scientific Reports | (2022) 12:13890 | https://doi.org/10.1038/s41598-022-17922-5 4
Vol:.(1234567890)www.nature.com/scientificreports/
Figure 5. Rare NFTs are scarce within a collection. (a–c) Distribution of the rarity score of the NFTs within
three collections: CryptoPunks (a), Bored Ape Yacht Club (b), and World of Women (c). (d) Violin plot of the
Spearman Rank correlation computed between the rarity score and the number of NFTs with that score. 96% of
the collections have a Spearman rank r ≤ 0 (black dashed lines).
Quantifying rarity. We quantify the distribution of rarity scores for items within the same collection. As an
example, Fig. 5 shows the distribution of rarity for three popular collections, namely CryptoPunks, Bored Ape
Yacht Club, and World of Women.
For CryptoPunks, the median rarity score is 0.82, with only one of the 10,000 CryptoPunks having a rarity
score above 75, whereas 99.7% of the tokens have a rarity score below 10 (see Fig. 5a). Moreover, as most of the
CryptoPunks have a low rarity score, the least rare ones are aggregated into two bins, whereas the rare one occu-
pies the only bin with a high rarity score within the collection. The median rarity score for Bored Ape Yacht Club
is 20.3, and 26 apes (i.e., 0.26% of the collection) have a rarity score above 75. The distribution is skewed towards
lower rarity scores, with 68.2% of the assets with a rarity score below 25, among which 8.23% fall below a rarity
score of 10 (see Fig. 5b). The profile for the World of Women collection is also not as heterogeneous as that of
CryptoPunks; it has a median rarity score of 14.8 and only 24 assets (0.24% of the collection) have a rarity score
above 75. 87.3% of the tokens have a rarity score below 25, and 19.9% of those lie below a rarity score of 10 (see
Fig. 5c). To generalize these observations, we calculated the Spearman rank correlation coefficient between the
rarity bin and the number of NFTs by rarity bin. A negative value of the correlation coefficient indicates that the
higher the rarity score, the lower the supply of NFTs is within the considered collection. Like the three example
collections in Fig. 5a–c, 96% of the collections in our dataset have a Spearman rank r ≤ 0 , as shown in Fig. 5d,
where the violin plot represents the probability distribution of the Spearman rank correlation by collection. We
compare the ability of 6 different statistical distributions, namely the exponential, power-law, uniform, cauchy,
log-normal and levy distributions, to capture the distribution of rarity for each collection, using the Akaike
model selection m ethod52 (see SI for more details). We find that, among the distributions considered, 90% of
the collections are best described by a log-normal distribution (with �µ� = 0.91 ± 0.16, see SI Fig. 2), only 7%
by an exponential, 1% by a uniform function and the rest by heterogeneous distributions such as power-laws or
Levy (for a visualization of a sample of these distributions, see SI Fig. 3).
The same correlation analysis performed using the rarity rank confirms our results (see SI Fig. 4) In the fol-
lowing, we will focus on NFTs rarity score, because this metric takes into account all the traits associated with an
NFT, and is therefore more suitable to quantify NFTs properties and rarity. All the following results are replicated
using trait rarity rank as robustness check (see Supplementary Information section E.1).
Our analysis indicates that the distribution of the rarity within a collection is heterogeneous, thus leading
to a situation where rare NFTs are genuinely scarce on the marketplace. Notice that while this may seem trivial
(“rare items are fewer than common items”), the distribution of traits rarity, and in turn their combination in
single NFTs could in principle generate a wide range of distributions of NFT rarity, including homogeneous ones.
Rarity and market performance. To measure the relationship between rarity and market performance,
we compute the rarity score of each NFT, and we split the assets into quantiles with respect to their rarity score to
analyse collections individually. We then compare the median sale price across quantiles. We are using quantiles
to ensure that NFTs within a collection will be evenly balanced between each bin, as to avoid having a collec-
tion skewing the results in the aggregated analysis, by having all of its NFTs concentrated in a single bin. For the
Scientific Reports | (2022) 12:13890 | https://doi.org/10.1038/s41598-022-17922-5 5
Vol.:(0123456789)www.nature.com/scientificreports/
Figure 6. Rare NFTs have a higher financial value and circulate less on the marketplace. Median sale price
in USD (a–c) and average number of sales (e–g) by rarity quantile (with 20 quantiles considered) for three
collections: CryptoPunks (a, e), Bored Ape Yacht Club (b, f), and World Women (c, g). (d) Median sale price by
rarity quantile (with 100 quantiles considered) considering all collections. Inset: median sale price against the
quantity (100-q), where q is the rarity quantile, in log-log scale (black line) and the corresponding power law fit
(green dashed line). (h) Median number of sales by rarity quantile considering all collections.
individual collections analysis, NFTs are partitioned into twenty quantiles, whereas 100 quantiles are used when
aggregating the collections together.
First, we consider the relation between market behaviour and rarity for three exemplar collections, Cryp-
toPunks, Bored Ape Yacht Club, and World of Women (see Fig. 6a–c). We observe that the median sale price at
which NFTs are auctioned is relatively constant for the most common NFTs in each collection (rarity quantile
smaller than 10), and then increase sharply for the rarest NFTs (rarity quantile larger than 10, see Fig. 6a–c).
These findings are robust, and are observed also when we consider NFTs in all collections (see Fig. 6d). We
notice that the median sale price is relatively flat for the 50% least rare NFTs, before increasing by 195% for the
10% rarest NFTs. More strikingly, the median sale price for the 90% least rare NFTs is equal to 298 ± 3.2 USD,
and rises to 1254 USD for the 1% rarest NFTs. Focusing on the top 10% rarest NFTs, the relationship between
the median sale price p and the quantity (100-q), where q is the rarity quantile, is well described by a power law
p ∼ (100 − q)α with exponent α = −0.55 (see Fig. 6 inset). This result indicates a strong relationship between
NFT rarity and median sale price.
On the other side, we find that rare NFTs are not sold as frequently as common ones on the marketplaces.
By looking at the individual collections, we see that the average number of sales decreases as we increase the
rarity of the NFTs we are considering (see Fig. 6e–g). Regarding the average number of sales, by aggregating all
collections together, we find that the number of sales decreases for rarer NFTs. In particular, the 1% least rare
NFTs are sold, on average, 10.8% more than the 1% rarest ones (see Fig. 6h).
In order to check that this behaviour holds when considering a shorter time span within OpenSea’s lifetime,
we performed the same analysis by considering only sales happening during the third quarter of 2021 (see SI
Fig. 9) and the fourth quarter as well (see SI Fig. 11). Our findings are also robust by considering the sale price
in ETH rather than in USD (see SI Fig. 7), and by discarding the rarest and least rare NFTs from each collection
(see SI Fig. 13). Moreover, we notice a similar pattern when quantifying the rarity of the NFTs with the NFT
rarity rank instead of the NFT rarity score (see SI Fig. 5).
Rarity and return on investment. NFTs can be purchased and later put on sale again on the marketplace.
An NFT owner is free to set an initial price to an auction, and to transfer the ownership of the NFT to the high-
est bidder. As such, NFTs which have been minted years ago, such as the CryptoPunks, can still be purchased
on OpenSea. The results shown in Fig. 6 indicate that, within a collection, the rarest NFTs are typically sold at a
higher absolute price than the least rare ones on the market. However, this fact does not necessarily imply that
the return on investment of secondary sales is positive, as it does not take into account the price at which the
asset was initially purchased before being auctioned again. To study whether the correlation between rarity and
price strengthens as a token keeps being exchanged on the market, we computed the return R of the kth sale of
an NFT as:
P(k) − P(k − 1)
R= , (3)
P(k − 1)
where P(k) is the price that was paid for the NFT for its kth sale. A positive return indicates that the NFT was sold
at a higher price than the one it was bought for, whereas a negative return represents a financial loss for the seller.
Figure 7a shows the median return computed when aggregating all collections by rarity quantile. We find
that the rarest NFTs have a much higher median return, whereas the value is almost constant in the first half of
the curve. Focusing on the top 10% rarest NFTs, we observe that the relationship between the quantity (100-q),
Scientific Reports | (2022) 12:13890 | https://doi.org/10.1038/s41598-022-17922-5 6
Vol:.(1234567890)www.nature.com/scientificreports/
Figure 7. High rarity leads to higher returns, and a lower chance of a negative return. (a) Median return in
USD by rarity quantile. Inset: median return against the quantity (100-q), where q is the rarity quantile in log-
log scale (black line) and the corresponding power law fit (green dashed line). (b) Fraction of sales with negative
return in USD by rarity quantile.
where q is the rarity quantile, and the median return R is well described by a power law R ∼ (100 − q)α, with an
exponent α = −0.29 (see Fig. 7 inset). The median return is relatively flat around 0.24 ± 0.001 for the 50% least
rare NFTs, thus indicating no noticeable advantage for an NFT to be one of the least rare assets of the collection
or an average one in terms of rarity, whereas the median return grows by 105% within the top 10% rarest NFTs.
Finally, we study the relation between NFT rarity and the probability to generate negative returns. We observe
that, on average, rarer NFTs are less likely to generate negative returns (see Fig. 7b). The fraction of sales generat-
ing negative returns is equal to 34.6 ± 0.58% for the 50% least rare NFTs, but drops from 30.5% to 22.9% within
the top 10% rarest NFTs, i.e., a decrease of 24.9%. These results also hold by only considering the sales happening
during a shorter a shorter time period, such as the third quarter of 2021 (see SI Fig. 10) and the fourth quarter
(see SI Fig. 12). The same analysis has been performed by considering the sale prices in ETH (see SI Fig. 8) and
by discarding the rarest and least rare NFTs of every collection (see SI Fig. 14). These results are also robust when
using the NFT rarity rank to measure the rarity of an NFT rather than the rarity score (see SI Fig. 6).
Discussion. We have quantified rarity in 410 NFT collections and analysed its effect on market performance.
Rarity is a fundamental feature of NFTs belonging to a collection because (i) it allows users to categorise NFTs
on the traditionally market-relevant axis of scarcity and (ii) it is based on human-readable, easy to identify, traits
that creators assign to NFTs. We have found that the distribution of rarity is heterogeneous throughout the vast
majority of collections. We have shown that rarity is positively correlated with the sale price and negatively cor-
related with the number of sales of an NFT, with the effect being stronger for the top 10% rare NFTs. Last, we
have shown how rarity is associated with higher return of investment and lower probability of yielding negative
returns in secondary sales.
The finding that most rarity distributions are heavily heterogeneous, with few very rare NFTs, is interesting
since in principle more homogeneous distributions would be possible. The ubiquitous nature of this pattern may
indicate either that creators deliberately choose heterogeneous distributions (design perspective) or that het-
erogeneous distributions help make a collection successful and therefore are dominant in our sample of actively
traded distributions (evolutionary perspective). While information on the rationale behind rarity distributions
is hard to r etrieve53, the design and evolutionary explanations could have fuelled one another over time, with
creators embedding rarity out of imitation of successful pre-existent collections. In this perspective, our results
could help to further improve the design of NFT collections.
From the point of view of trading, it is important to highlight that our results concern genuinely emerging
properties of the NFT market, since we only considered user-to-user sales. In doing so, we discarded the very first
creator-to-user sales, which are often based on lotteries that prevent users to select what NFT to buy48. We found
that while the impact of rarity is particularly strong for—and among—the rarest NFTs, which are thus genuinely
non-fungible according to the market, its influence propagates to a large number of somehow rare NFTs (see
Fig. 6g, inset and Fig. 7a, inset). Most common NFTs, on the other hand, appear to behave more uniformly in
the market, which appears to consider them essentially “fungible”. Overall, we anticipate that our results in this
context may help inform the decisions of users interested in the financial aspects of NFTs.
Our study has limitations that future work could address. First, our dataset is limited to collections available
on Opensea, the biggest NFT market, and sold on the Ethereum blockchain. A natural extension would cover
other platforms (potentially on other blockchains) and different types of NFTs, assessing whether rarity has the
same effects on other kinds of NFTs such as those related to gaming and the metaverse. Second, we used the rar-
ity score to quantify the rarity of an NFT. While this method does take into account every trait associated with
an NFT, it does not consider possible combined effects stemming from the combination of multiple traits (e.g.,
two common traits for a collection might be present together in just one NFT, making it very rare). Future work
could assess whether such second-order effects do play a role on the market performance of NFTs. Third, we
considered traits as they are encoded in the NFT metadata and reported on rarity.tools, limiting the analysis to
collections where such metadata are available and consistently recorded. Future work making use of computer
vision techniques to extract human readable attributes from visual information of NFTs would yield to larger
datasets and assess whether also less “official” visual traits, potentially shared by NFTs in multiple collections
and where previously developed metrics might help54,55, might play a role on the NFT market. Finally, while this
Scientific Reports | (2022) 12:13890 | https://doi.org/10.1038/s41598-022-17922-5 7
Vol.:(0123456789)www.nature.com/scientificreports/
work has focused on how rarity affects NFT market success, a natural extension of the work should focus on
how buyers behave with respect to rarity.
Data availability
Data downloaded from the OpenSea API is available at https://osf.io/7w9r6/.
Received: 8 May 2022; Accepted: 2 August 2022
References
1. Will NFTs transform the art world? Are they even art? accessed 14 April 2022; https://www.washingtonpost.com/arts-entertainm
ent/2021/12/18/nft-art-faq/ (2021).
2. What’s an NFT? Behind the boom for digital collectibles, accessed 14 April 2022; https://www.nbcnews.com/tech/tech-news/
nft-boom-digital-collectibles-rcna430 (2021).
3. Between axie infinity and ghost recon, why should anyone trust gaming NFTs? accessed 14 April 2022; https://www.forbes.com/
sites/paultassi/2022/04/09/between-axie-infinity-and-ghost-recon-why-should-anyone-trust-gaming-nfts/?sh=587efb4061ca
(2022).
4. Luxury sees billions in Rolex, Hermes and Gucci NFTs, accessed 11 April 2022; https://www.bloomberg.com/opinion/articles/
2021-12-17/luxury-brands-from-rolex-to-gucci-see-billions-in-metaverse-avatar-nft-economy (2022).
5. NFTs, metaverse and GameFi are changing up the fashion business in 2022, accessed 11 April 2022; https://www.f orbes.com/s ites/
joseph deace tis/2 021/1 2/2 2/n
fts-m
etave rse-a nd-g amefi-a re-c hangi ng-u
p-t he-f ashio
n-b
usine ss-i n-2 022/?s h=2 44f0d 983c3 1 (2022).
6. Spotify draws up plans to join NFT digital collectibles craze, accessed 3 April 2022; https://www.ft.com/content/9e77bf41-5814-
4c18-96f6-f800f6b41216 (2022).
7. Hollywood’s NFT gold rush: Behind the hope and hype, accessed 11 April 2022; https://v ariet y.c om/2 021/d igita l/n
ews/h ollyw ood-
nft-entertainment-gold-rush-1235108296/ (2021).
8. NFTs and the future of commercial real estate, accessed 11 April 2022; https://www.forbes.com/sites/forbesbusinesscouncil/2022/
02/16/nfts-and-the-future-of-commercial-real-estate/?sh=2baba7299bac (2022).
9. Nadini, M. et al. Mapping the NFT revolution: Market trends, trade networks, and visual features. Sci. Rep. 11(1), 1–11 (2021).
10. Dune analytics, accessed 22 June 2022; https://dune.xyz/rchen8/opensea (2022).
11. NFT beats Cheugy to be Collins Dictionary’s word of the year, accessed 15 March 2022; https://www.theguardian.com/books/
2021/nov/24/nft-is-collins-dictionary-word-of-the-year (2021).
12. How to create an NFT collection with a smart contract, accessed 19 April 2022; https://geekfl are.com/finance/create-nft-colle
ction-with-a-smart-contract/ (2022).
13. Bored apes and cryptopunks help jolt NFT market to over 21,000% growth and \$17.6 billion in sales last year, accessed 17 March
2022; https://fortune.com/2022/03/10/bored-apes-cryptopunks-jolt-nft-market-to-billions-in-sales/ (2022).
14. Generative art, accessed 28 March 2022; https://www.tate.org.uk/art/art-terms/g/generative-art (2022).
15. CryptoPunks, accessed 1 April 2022; https://www.larvalabs.com/cryptopunks (2017).
16. Bored Ape Yacht Club, accessed 25 March 2022; https://boredapeyachtclub.com/#/ (2021).
17. rarity.tools, accessed 30 June 2022; https://rarity.tools.
18. Highest-ever CryptoPunk sale nets \$24 million, accessed 19 March 2022; https://www.theblockcrypto.com/linked/134139/highe
st-ever-cryptopunk-sale-nets-24-million (2022).
19. Schaar, Luisa & Kampakis, Stylianos. Non-fungible tokens as an alternative investment: Evidence from cryptopunks. J. Br. Block-
chain Assoc. 5, 31949 (2022).
20. Rare Bored Ape Yacht Club NFT Sells for Record \$3.4 Million USD, accessed 19 March 2022; https://hypebeast.com/2021/10/
bored-ape-yacht-club-nft-3-4-million-record-sothebys-metaverse (2021).
21. Koford, K. & Tschoegl, A. E. The market value of rarity. J. Econ. Behav. Org. 34(3), 445–457 (1998).
22. Lee, Y. Measuring the impact of rarity on price: Evidence from NBA top shot. SSRN 3906231 (2021).
23. Hughes, J. E. Demand for rarity: Evidence from a collectible good. Downloaded from (Year: 2021) (2020).
24. Ghazi, S. & Schneider, M. Preference for scarcity. SSRN (2021).
25. Kong, D.-R. & Lin, T.-C. Alternative investments in the fintech era: The risk and return of non-fungible token (NFT). SSRN 3914085
(2021).
26. Wang, Q., Li, R., Wang, Q. & Chen, S. Non-fungible token (NFT): Overview, evaluation, opportunities and challenges. arXiv
preprint arXiv:2105.07447 (2021).
27. Vasan, K., Janosov, M. & Barabási, A.-L. Quantifying NFT-driven networks in crypto art. Sci. Rep. 12, 02 (2022).
28. Kapoor, A., Guhathakurta, D., Mathur, M., Yadav, R., Gupta, M., & Kumaraguru, P. Tweetboost: Influence of social media on NFT
valuation (2022).
29. Franceschet, M. Hits hits art. Blockchain Res. Appl. 2(4), 100038 (2021).
30. Oh, S., Rosen, S. & Zhang, A. L. Investor experience matters: Evidence from generative art collections on the blockchain. SSRN
4042901 (2022).
31. Bao, H. & Roubaud, D. Recent development in fintech: Non-fungible token (2021).
32. von Wachter, V., Jensen, J. R., Regner, F. & Ross, O. NFT wash trading: Quantifying suspicious behaviour in NFT markets, in
Financial Cryptography and Data Security. FC 2022 International Workshops (2021).
33. Pelechrinis, K., Liu, X., Krishnamurthy, P., & Babay, A. Spotting anomalous trades in NFT markets: The case of NBA TopShot.
arXiv preprint arXiv:2202.04013 (2022).
34. Ante, L. The non-fungible token (NFT) market and its relationship with bitcoin and Ethereum. SSRN 3861106 (2021).
35. Borri, N., Liu, Y., & Tsyvinski, A. The economics of non-fungible tokens. SSRN (2022).
36. Aharon, D. Y. & Demir, E. NFTs and asset class spillovers: Lessons from the period around the COVID-19 pandemic. Finance Res.
Lett. 47, 102515 (2021).
37. Mark Zuckerberg is betting Facebook’s future on the metaverse, accessed 19 March 2022; https://www.theverge.com/22588022/
mark-zuckerberg-facebook-ceo-metaverse-interview (2021).
38. Bored Ape Yacht Club creator raises \$450 million to build an NFT metaverse, accessed 23 March 2022; https://www.theverge.
com/2022/3/22/22991272/yuga-labs-seed-funding-a16z-bored-ape-yacht-club-bayc-metaverse-other-side (2022).
39. Ynag, Q., Zhao, Y., Huang, H., & Zheng, Z. Fusing blockchain and AI with metaverse: A survey. arXiv preprint arXiv:2201.03201
(2022).
40. Lee, L.-H., Lin, Z., Hu, R., Gong, Z., Kumar, A., Li, T., Li, S., & Hui, P. When creators meet the metaverse: A survey on computational
arts. arXiv preprint arXiv:2111.13486 (2021).
41. ERC721—the NFT standard—ethhub, accessed 19 April 2022; https://docs.ethhub.io/built-on-ethereum/erc-token-standards/
erc721/.
42. OpenSea, accessed 3 July 2022; https://opensea.io/.
Scientific Reports | (2022) 12:13890 | https://doi.org/10.1038/s41598-022-17922-5 8
Vol:.(1234567890)www.nature.com/scientificreports/
43. OpenSea Assets, accessed 3 April 2022; https://opensea.io/assets.
44. Foundation, accessed 25 March 2022; https://foundation.app/.
45. SuperRare, accessed 25 March 2022; https://superrare.com/.
46. Nifty gateway, accessed 2 April 2022; https://niftygateway.com/.
47. Feral file, accessed 2 April 2022; https://feralfile.com/exhibitions.
48. Buying NFTs during presales and public mints: Things you should know, accessed 15 April 2022; https://w ww.c oinde sk.c om/l earn/
buying-nfts-during-presales-and-public-mints-things-you-should-know/ (2022).
49. NFT collections listed by sales volume | coinmarketcap, accessed 18 June 2022; https://coinmarketcap.com/nft/collections/.
50. rarity.tools. Ranking Rarity: Understanding Rarity Calculation Methods, accessed 20 March 2022; https://raritytools.medium.
com/ranking-rarity-understanding-rarity-calculation-methods-86ceaeb9b98c (2021).
51. How azukis suddenly became the world’s best-selling NFT collection, accessed 20 April 2022; https://www.forbes.com/sites/jeffk
auflin/2022/02/14/how-azukis-suddenly-became-the-worlds-best-selling-nft-collection/?sh=5e6aff 5a5cbe (2022).
52. Wagenmakers, E.-J. & Farrell, S. AIC model selection using Akaike weights. Psychon. Bull. Rev. 11(1), 192–196 (2004).
53. The original cryptopunk, accessed 4 April 2022; https://a ndrew schrb r.m
edium.c om/t he-o
rigin
al-c rypto
punk-a 85210 1a03e d (2021).
54. Rabinowitz, D. Seven forms of rarity. Biological aspects of rare plant conservation (1981).
55. Violle, C. et al. Functional rarity: The ecology of outliers. Trends Ecol. Evol. 32(5), 356–367 (2017).
Acknowledgements
The research was partly supported by The Alan Turing Institute. L.M.A. acknowledges the support from the
Carlsberg Foundation through the COCOONS project (CF21-0432).
Author contributions
A.M., A.Br., M.N., L.A., M.M., L.M.A., and A.Ba. designed the study. A.M. carried out the data collection. A.M.
and A.Br. performed the measurements. A.M., A.Br., M.N., L.A., M.M., L.M.A., and A.Ba. analysed the data,
discussed the results, and contributed to the final manuscript.
Competing interests
The authors declare no competing interests.
Additional information
Supplementary Information The online version contains supplementary material available at https://doi.org/
10.1038/s41598-022-17922-5.
Correspondence and requests for materials should be addressed to A.B.
Reprints and permissions information is available at www.nature.com/reprints.
Publisher’s note Springer Nature remains neutral with regard to jurisdictional claims in published maps and
institutional affiliations.
Open Access This article is licensed under a Creative Commons Attribution 4.0 International
License, which permits use, sharing, adaptation, distribution and reproduction in any medium or
format, as long as you give appropriate credit to the original author(s) and the source, provide a link to the
Creative Commons licence, and indicate if changes were made. The images or other third party material in this
article are included in the article’s Creative Commons licence, unless indicated otherwise in a credit line to the
material. If material is not included in the article’s Creative Commons licence and your intended use is not
permitted by statutory regulation or exceeds the permitted use, you will need to obtain permission directly from
the copyright holder. To view a copy of this licence, visit http://creativecommons.org/licenses/by/4.0/.
© The Author(s) 2022, corrected publication 2022
Scientific Reports | (2022) 12:13890 | https://doi.org/10.1038/s41598-022-17922-5 9
Vol.:(0123456789)You can also read