HHS Public Access Author manuscript Nature. Author manuscript; available in PMC 2022 June 09 - CDC stacks
←
→
Page content transcription
If your browser does not render page correctly, please read the page content below
HHS Public Access
                                 Author manuscript
                                 Nature. Author manuscript; available in PMC 2022 June 09.
Author Manuscript

                    Published in final edited form as:
                     Nature. 2021 December ; 600(7890): 675–679. doi:10.1038/s41586-021-04064-3.

                    The power of genetic diversity in genome-wide association
                    studies of lipids
                    A full list of authors and affiliations appears at the end of the article.

                    Abstract
                         Elevated blood lipid levels are heritable risk factors of cardiovascular disease with varying
Author Manuscript

                         prevalence worldwide due to differing dietary patterns and medication use1. Despite advances in
                         prevention and treatment, particularly through the lowering of low-density lipoprotein cholesterol
                         levels2, heart disease remains the leading cause of death worldwide3. Genome-wide association
                         studies (GWAS) of blood lipid levels have led to important biological and clinical insights, as well
                         as new drug targets, for cardiovascular disease. However, most previous GWAS4–23 have been
                         conducted in European ancestry populations and may have missed genetic variants contributing
                         to lipid level variation in other ancestry groups due to differences in allele frequencies, effect

                    Correspondence and requests for materials should be addressed to Cristen Willer, cristen@umich.edu, or Themistocles L. Assimes,
                    tassimes@stanford.edu.
                    †These authors jointly supervised this work
                    #Present Address: Genentech, 1 DNA Way, South San Francisco, CA 94080
                    A full list of consortia members can be found in the supplementary information
Author Manuscript

                    Author Contributions
                    S.L.C., K-H.H.W., S.K., G.J.M.Z., S.R. contributed equally to this work (as co-second authors). All authors reviewed the manuscript.
                    Consortium management: G.M.P., P.N., T.L.A., M.B., S.K., C.J.W. Study design, interpretation of results, and drafting of manuscript:
                    S.E.G., S.L.C., K-H.H.W., S.K., G.J.M.Z., S.R., I.S., I.N., E.M., K.L.M., T.M.F., J.N.H., S.K., M.B., P.N., G.M.P., C.D.B., A.P.M.,
                    Y.V.S., P.D., T.L.A., C.J.W. Primary meta-analysis and quality control: S.E.G., S.V., T.W.W., A.E.L. Polygenic score analysis and
                    development: S.E.G., S.L.C., K-H.H.W., S.K., M.Y.H., S.H., A.N., A.C., A.R.B., K.E., A.V., B.T., H.C.M., K.A.H., C.N.R., S.H.,
                    M.R., R.C.T., D.A.vH., G.T., M.Y., B-J.K. Individual study genetic analysis: S.E.G., S.K., S.V., A.E.L., K.L.M., G.M.P., P.D., C.J.W.,
                    Q.H., D.K., X.Z., G.T., A.H., D.F.G., H.H., I.O., M.A., S.S., C.T., M.K., W.Z., B.M.B., H.R., S.E.R., A.S.H., Y.V., Q.F., E.A.R., T.L.,
                    J.A.P., S.A.P., J.H., F.G., Y.B., J.E.M., A.C., K.L., I.Y.M., G.H., A.R., J.D.F., W.Z., D.R.W., C.T., H.H., M.G., A.M., M.R.B., W.Z.,
                    K.Y., E.M.S., A.P., S.G., X.Y., J.L., J.Z., F.M., H.J., K.Y., C.M., A.P., J.H., G.W., A.R.W., Y.J., Z.G., S.H., R.E.M., J.C., M.A., J.Y.,
                    A.M., H.R.W., J.R., J.B., L.L.K., A.G., M.S., R.N., C.S., E.F., A.F.M., P.M., M.W., S.T., N.S., L.T.M., B.H.T., M.M., L.Z., J.H., B.Y.,
                    A.P., A.K., C.L., L.F., M.S., T.E.G., J.P.B., E.W.D., J.M.Z., J.S.M., C.F., H.C., J.A.B., M.F.F., M.K.W., M.P., M.M., P.C., N.V., J.W.B.,
                    J.E., R.L.K., R.C.S., K.L., N.R.Z., P.L., M.E.K., G.E.D., S.H., D.D.I., H.I., J.Y., J.L., H.L.L., J.M., B.S., M.A., L.J.S., M.C., C.W.,
                    M.N., A.W., N.H., X.S., R.X., A.H., J.C.F., V.L., M.A., A.U.J., M.R.I., C.O., H.K., S.R., P.R.T., L.A., R.D., L.A.L., X.C., G.P., L.L.,
                    M.P., J.L., X.L., E.T., F.T., C.N.S., A.L., S.B., S.C.W., Y.W., W.B.W., T.N., D.R., Y.S., Y.H., S.C., F.L., J.Y., K.A.K., M.G., M.B.,
                    K.M., L.F.B., J.A.S., P.H., A.F., E.H., M.L., C.X., J.Z., M.C., S.V., P.J.v., N.P., B.E.C., J.L., S.v., K.C., S.W., M.E.Z., J.L., H.C., M.N.,
                    S.F., L.S., N.W.R., C.A.W., S.L., J.W., C.C., L.L., K.N., G.C., H.V., B.H., O.G., Q.C., M.O.O., J.v., X.L., K.S., N.T., J.S., R.D.J.,
                    A.P.R., L.W.M., Z.C., L.L., H.M.H., K.L.Y., T.K., J.T., J.C.B., G.N.N., L.J.L., H.L., M.A.N., O.T.R., S.I., S.H.W., C.P.N., H.C., S.J.,
                    T.N., F.A., H.N., P.S.B., I.K., P.K., T.G., T.K., K.B., D.d., G.d., E.K., H.H.A., M.I., X.Z., F.W.A., A.O.K., J.W.B., X.S., L.S.R., O.P.,
Author Manuscript

                    T.H., P.M., A.W.H., M.K., L.P., C.B., A.T., Y.C., C.E.P., T.A.M., W.L., A.F., C.O., D.M., Y.C., H.L., J.Y., W.K., S.R., J.W., I.M.H.,
                    K.J.S., H.V., G.H., M.K.E., A.B.Z., O.P., G.P., I.E.H., S.R., K.P., A.J.O., H.S., G.B., R.S., H.S., Y.E.C., S.B., G.D., T.T., S.L.K., N.K.,
                    M.B.S., G.G., B.J., C.A.B., P.K.J., D.A.B., P.L.D., X.L., V.M., M.B., M.J.C., P.B.M., X.G., M.C., J.B.J., N.J.S., D.I.C., J.K., P.P., T.T.,
                    C.A.A., L.S.A., S.A.B., H.d., A.R.W., R.K., J.W., W.Z., A.I.d., D.B., A.C., J.G.W., L.L., C.H., A.E.N., Y.M.G., J.F.W., B.P., H.K.,
                    J.A., R.J.S., D.C.R., D.K.A., M.W., H.A.K., G.R.C., C.S.Y., J.M.M., T.T., C.A., C.G.V., L.O., M.F., E.T., R.M.v., T.L., N.C., M.Y.,
                    J.L., D.F.R., A.M., F.K., K.J., M.I.M., C.N.P., V.V., C.H., E.S., C.M.v., F.L., J.Q., H.H., X.L., W.M., E.J.P., M.C., V.G., J.T., G.L.,
                    L.M.t., P.J.E., D.J.R., S.M.D., M.K., M.K., P.v., T.D.S., R.J.L., M.A.P., B.M.P., I.B., P.P.P., K.C., S.R., E.W., H.H., S.F.G., L.A.K.,
                    J.d., M.L., F.K., D.G., J.E., H.S., P.W.F., A.L., J.W.J., A.V.K., M.M., M.J., Z.K., F.C., D.O.M., K.W., H.W., D.P.S., N.G., P.S., N.P.,
                    J.I.R., T.M.D., F.K., M.J.N., N.J.T., C.C., T.W., C.K., C.S., A.P., C.G., A.T.H., N.L.P., P.K.M., D.I.B., E.J.d., L.A.C., J.B.v., M.G.,
                    P.G., W.H., Y.K., Y.T., N.J.W., C.L., E.Z., J.K., M.L., E.I., G.A., J.C.C., J.S.K., P.S.d., A.C.M., K.E.N., M.D., P.K., N.G.M., J.B.W.,
                    S.A., D.S., R.G.W., M.V.H., C.B., B.H.S., A.E.J., A.B., J.E.B., P.M.R., D.I.C., C.K., W.W., G.P.J., B.N., M.H., M.D.R., P.J., V.S.,
                    K.H., B.Å., M.K., Y.K., Y.O., Y.M., U.T., K.S., Y.H., J.A.L., D.R., P.S.T., K.C., K.C., C.J.O., J.M.G., P.W.
                    Code Availability
                    EasyQC: www.genepi-regensburg.de/easyqc;
                    Raremetal: https://github.com/SailajaVeda/raremetal
Graham et al.                                                                                              Page 2

                             sizes, and linkage-disequilibrium (LD) patterns24. Here we conduct a multi-ancestry genome-wide
Author Manuscript

                             genetic discovery meta-analysis of lipid levels in ~1.65 million individuals, including 350,000
                             of non-European ancestries. We quantify the gain in studying non-European ancestries and
                             provide evidence to support expanding recruitment into new ancestries even with relatively smaller
                             sample sizes. We find that increasing diversity rather than studying additional European ancestry
                             individuals results in substantial improvements in fine-mapping functional variants and portability
                             of polygenic prediction (evaluated in N~295,000 from 6 ancestries), with modest gains in the
                             number of discovered loci and ancestry-specific variants. As GWAS expands its emphasis beyond
                             identifying genes and fundamental biology towards using genetic variants for preventive and
                             precision medicine25, we anticipate that increased participant diversity will lead to more accurate
                             and equitable26 application of polygenic scores in clinical practice.

                                       The Global Lipids Genetics Consortium aggregated GWAS results from 1,654,960
Author Manuscript

                                       individuals from 201 primary studies representing five genetic ancestry groups: Admixed
                                       African or African (AdmAFR, N=99.4k, 6.0% of sample), East Asian (EAS, N=146.5k,
                                       8.9%), European (EUR, N=1.32m, 79.8%), Hispanic (HIS, N=48.1k, 2.9%), and South
                                       Asian (SAS, N=41.0k, 2.5%) (Table 1, Supplementary Table 1, Supplementary Figure
                                       1). We performed GWAS for five blood lipid traits: low-density lipoprotein cholesterol
                                       (LDL-C), high-density lipoprotein cholesterol (HDL-C), triglycerides (TG), total cholesterol
                                       (TC), and non-high-density lipoprotein cholesterol (nonHDL-C). Of the 91 million variants
                                       imputed from the Haplotype Reference Consortium or 1000 Genomes Phase 3 that
                                       successfully passed variant-level QC, 52 million variants were present in at least two cohorts
                                       and had sufficient minor allele counts (> 30 in the meta-analysis) to be evaluated as a
                                       potential index variant.
Author Manuscript

                       Ancestry-specific genetic discovery
                                       We first quantified the number of genome-wide significant loci identified in at least
                                       one of the five ancestry-specific meta-analyses. We found 773 lipid-associated genomic
                                       regions containing 1,765 distinct index variants that reached genome-wide significance
                                       (p-value < 5x10⁻⁸, ±500 kb, Supplementary Tables 2–3, Supplementary Figures 2–3) for
                                       at least one ancestry group and lipid trait. Of these regions, 237 were novel based on
                                       the most-significant index variant in each region being >500 kb from variants previously
                                       reported as associated with any of the five lipid traits4–23,27. Of these loci, 76% were
                                       identified only in the European ancestry-specific analyses (N~1.3m, 80% of sample).
                                       Of the non-European ancestries, the African ancestry GWAS (N~99k, primarily African
                                       American) identified more ancestry-specific loci (15 unique to AdmAFR) than any other
                                       non-European ancestry group (six loci unique to EAS, six to HIS, one to SAS). The
Author Manuscript

                                       difference is likely attributable to allele frequencies being most different between African
                                       and European ancestry populations (Figure 1a–d) and to African populations having greater
                                       genetic diversity28.

                       Trans-ancestry genetic discovery
                                       We next performed trans-ancestry meta-analyses using the meta-regression approach
                                       implemented in MR-MEGA30 to account for heterogeneity in variant effect sizes on lipids

                                               Nature. Author manuscript; available in PMC 2022 June 09.
Graham et al.                                                                                            Page 3

                                    between ancestry groups. A total of 1,750 index variants at 923 loci (±500 kb regions)
Author Manuscript

                                    reached genome-wide significance for at least one lipid trait. These included 168 regions
                                    not identified by ancestry-specific analysis, 120 (71%) of which were novel (Supplementary
                                    Tables 4–5, Supplementary Figure 4, Extended Data Figure 1). Almost all (98%) index
                                    variants from the ancestry-specific analysis remained significant (p-value1m). For the genome-wide significant variants
                                    discovered in each ancestry, we estimated the proportion of ancestry-enriched variants by
                                    enumerating the number of other ancestries with sufficient power to detect association
                                    (range 0 to 4). We estimated the power for discovery of each variant by assuming an
                                    equivalent discovery sample size in the other ancestries, fixed effect size, and observed
                                    allele frequencies from the other ancestries (Figure 1f). To allow for comparison at similar
                                    sample sizes across ancestry groups, we selected European ancestry index variants identified
                                    from a meta-analysis of ~100,000 individuals subsampled from the present study. African
                                    ancestry index-variants were most ancestry-enriched, with only 61% of index variants
                                    demonstrating sufficient power in at least one other ancestry group (equal N, power>80%
Author Manuscript

                                    to reach alpha=5x10⁻⁸), likely due to population-enriched allele frequencies. In comparison,
                                    88% of South Asian index variants had estimated power >80% in at least one other ancestry.

                                    Finally, we found that both the number of identified variants and the mean observed
                                    chi-squared values from genome-wide lipid association tests were approximately linearly
                                    related to meta-analysis sample size across ancestries (Supplementary Table 6, Extended
                                    Data Figure 2). However, in the European ancestry group the incremental increase in either
                                    the number of loci or chi-squared value was slightly attenuated at the largest sample sizes.
                                    Taken together, these results suggest that once sufficiently well-powered GWAS sample
                                    sizes are reached within a given ancestry group, assembling large sample sizes of other
                                    under-represented groups will modestly enhance variant discovery relative to increasing the
                                    sample size of the dominant ancestry.
Author Manuscript

                       Comparison of effects across ancestries
                                    Differences in association signals across ancestries despite similar sample sizes could
                                    be due to variation in allele frequencies and/or effect sizes. This could reflect differing
                                    patterns of LD with the underlying causal variant or an interaction with an environmental
                                    risk factor whose prevalence varies by ancestry and/or geography. We found that effect
                                    size estimates of individual variants were largely similar based on pairwise comparison

                                            Nature. Author manuscript; available in PMC 2022 June 09.
Graham et al.                                                                                             Page 4

                                    between ancestries (r2=0.93 for variants with p-value0.05, Supplementary Figures 7 and 8). We tested for differences in genetic correlation
                                    between Admixed African and European ancestries in the UK Biobank and Million Veteran
                                    Program (MVP) using bivariate GREML30,31 as the Popcorn method does not account for
                                    long-range LD in admixed populations. Genetic correlation between Admixed African and
                                    European ancestries for HDL-C (r=0.84) was not significantly different from 1 in the UK
                                    Biobank (possibly due to relatively small numbers of African ancestry individuals), while
                                    correlations for the other traits ranged from 0.52-0.60 in UK Biobank and 0.47-0.69 in MVP
                                    (Supplementary Table 8). These results indicate moderately high correlation in lipid effect
                                    sizes across ancestry groups when considering all genome-wide variants.
Author Manuscript

                                    Of the 2,286 variants that reached genome-wide significance in the trans-ancestry meta-
                                    analysis across all five lipid traits, 159 (7%) showed significant heterogeneity of effect size
                                    due to ancestry (p-value90% posterior
                                    probability of being the causal variant at a locus in the trans-ancestry meta-analysis, 56
                                    (14%) were missense variants, 7 (2%) were splice-region variants, and 4 (1%) were stop-
                                    gain variants (CD36, HBB, ANGPTL8, PDE3B). (Supplementary Tables 10–12).

                                    The median number of variants in 99% credible sets from European ancestry analysis was
                                    13; this was reduced to 8 in the trans-ancestry analysis. Of 1,486 association signals, 825
                                    (56%) had reduced credible set size in the trans-ancestry analysis. At these 825 loci, the
                                    number of variants in the trans-ancestry credible sets were reduced by 40% relative to the
Author Manuscript

                                    minimum credible set size in either Admixed African (the most genetically diverse group)
                                    or European ancestry analyses (Extended Data Figure 4). We estimate that increasing the
                                    sample size of European ancestry samples to that of the trans-ancestry analysis would yield
                                    a 20% reduction in credible set size, approximately half of the 40% reduction observed
                                    in trans-ancestry analysis. This suggests that sample size differences alone do not explain
                                    the reduction, rather differences in LD patterns and effect sizes across ancestries likely
                                    contribute to the improved fine-mapping (Supplementary Note). For example, rs900776,

                                            Nature. Author manuscript; available in PMC 2022 June 09.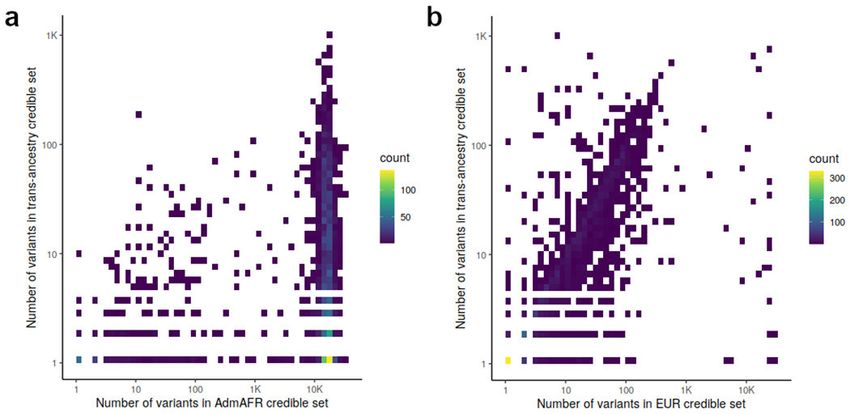
Graham et al. Page 5
an intronic variant in the DMTN region with many high LD variants in the European
Author Manuscript
ancestry group, has a posterior probability of being causal of 0.86 in the African ancestry
derived credible sets, >0.99 in the trans-ancestry analysis, but only 0.51 in the European
ancestry-specific analysis (Figure 2).
Trans-ancestry PRS are most predictive
We evaluated the potential of polygenic risk scores (PRS, sometimes also called polygenic
scores or PGS) to predict elevated LDL-C, a major causal risk factor of CAD, in diverse
ancestry groups. We created three non-overlapping datasets to separately: i) perform
ancestry-specific or trans-ancestry GWAS to estimate variant effect sizes, ii) optimize risk
score parameters, and iii) evaluate the utility of the resulting scores. For each ancestry-
specific or trans-ancestry GWAS we created multiple polygenic score weights -- either
genome-wide with PRS-CS32 or using pruning and thresholding to select independent
Author Manuscript
variants. We tested each score in the optimizing dataset, which was matched for ancestry
to the GWAS (AdmAFR, EAS, EUR, SAS, ALL from UK biobank or HIS from Michigan
Genomics Initiative (MGI), Extended Data Figures 5 and 6, Supplementary Tables 13–15).
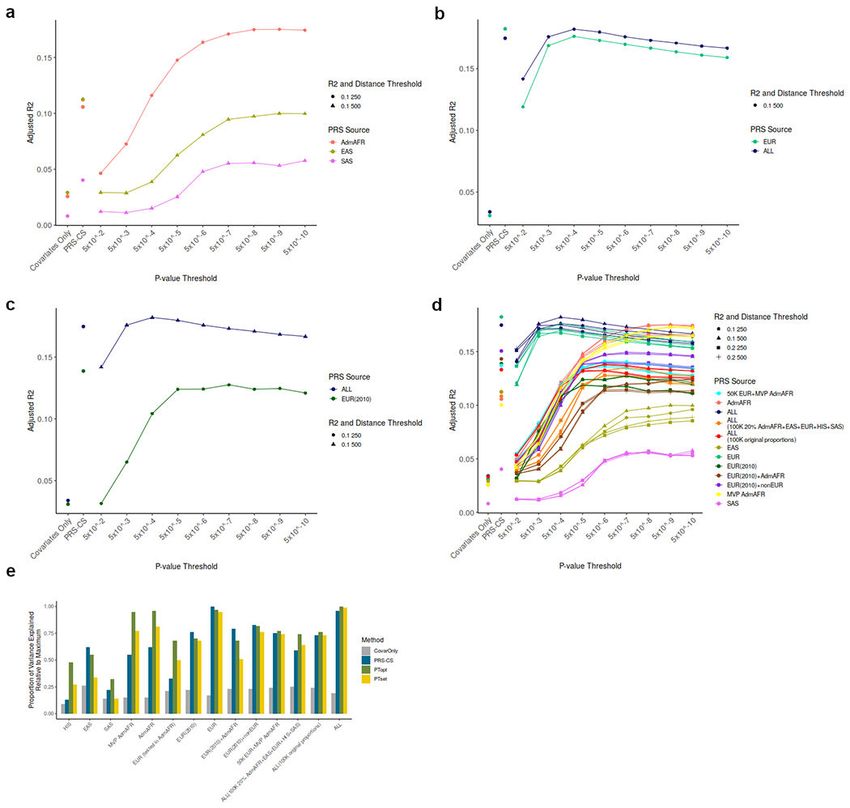
The top-performing score from each GWAS was selected: PRS-CS for East Asian ancestry,
European ancestry, and European ancestry 2010 scores from a previous GLGC GWAS4,
and an optimized pruning and threshold-based score for all others. We then evaluated the
polygenic scores in 8 cohorts of individuals (N=295,577, Supplementary Table 16), not
included in the discovery GWAS, from 6 ancestral groups: East Asian (146,477), European
American (85,571), African American (21,730), African (2,452 East Africa, 4,972 South
Africa, 7,309 West Africa), South Asian (15,242), Hispanic American (7,669), and Asian
American (4,155).
Author Manuscript
The polygenic score developed from trans-ancestry meta-analysis consistently showed the
best or near-best performance in each group tested, with improved or comparable prediction
relative to ancestry-matched scores (adjusted R2 ~ 0.10-0.16, Figure 3, Supplementary Table
17, Extended Data Figure 7). This observation was especially evident for ancestries with
smaller GWAS sample sizes, as was the case for HIS and SAS. For African Americans
in MGI and MVP, polygenic prediction was similar for individuals with different levels
of recent African ancestry admixture (Extended Data Figure 8) and reached the level
of prediction observed for European ancestry individuals from the same dataset. The
increase in LDL-C per each standard deviation increase in the polygenic score was
also similar between ancestry groups in MVP: 13.2±0.22 mg/dL for African American,
8.9±0.47 mg/dL for Asian (EAS/SAS), 10.5±0.10 mg/dL for European, and 10.6±0.32
mg/dL for Hispanic ancestry individuals. We repeated the evaluation of trans-ancestry vs
Author Manuscript
single-ancestry polygenic scores with a set GWAS with sample size of ~100k individuals
and with fixed methodology; results were consistent with those from the full dataset (Figure
3b, Supplementary Figure 9). Thus, polygenic prediction for LDL-C in all ancestries appears
to benefit the most from adding samples of diverse ancestries once relatively large numbers
of European ancestry individuals have already been included. Additional studies are needed
to determine if this applies to other phenotypes with different genetic architectures and
heritabilities.
Nature. Author manuscript; available in PMC 2022 June 09.
Graham et al.                                                                                            Page 6

                       Discussion
Author Manuscript

                                    Genome-wide discovery for blood lipid traits based on ~1.65 million individuals from five
                                    ancestry groups confirmed that the contributions of common genetic variation to blood lipids
                                    are largely similar across diverse populations. First, we found that the number of significant
                                    loci relative to sample size was similar within each ancestry group, and approximately
                                    linearly related to sample size, with a small increase in ancestry-specific variants observed
                                    in African ancestry cohorts relative to the others. Second, we demonstrated that inclusion
                                    of additional ancestries through trans-ancestry fine-mapping reduces the set of candidate
                                    causal variants in credible sets and does so more rapidly than in single-ancestry analysis.
                                    Trans-ancestry GWAS should therefore facilitate identification of effector genes at GWAS
                                    loci and allow for accelerated biological insight and identification of potential drug targets.
                                    Third, we found that a polygenic score derived from ~88k African ancestry and ~830k
                                    European ancestry individuals was correlated with observed lipid levels among individuals
Author Manuscript

                                    with admixed African ancestry as well as among individuals with European ancestry.
                                    We hypothesize that the inclusion of African ancestry individuals in the GWAS yields
                                    improvement in polygenic prediction performance through the general fine-mapping of
                                    loci and the improved prioritization of trans-ancestry causal variants. Fourth, and perhaps
                                    most important, the trans-ancestry score was generally most informative across all major
                                    population groups examined. This provides useful information for other genetic discovery
                                    efforts and investigations of the utility of the polygenic scores in diverse populations.

                                    Generalizability of these findings regarding portability of polygenic scores from the trans-
                                    ancestry meta-analysis to other traits may depend on the heritability, degree of polygenicity,
                                    level of genetic correlation, allele frequencies of causal variants across ancestry groups,
                                    gene-environment interactions, and representation of diverse populations in the GWAS33,34.
Author Manuscript

                                    While many traits show a high degree of shared genetic correlation across ancestries31,35,36
                                    others have distinct genetic variants with large effects that are more common in specific
                                    ancestry groups33 which may limit the utility of trans-ancestry polygenic scores for
                                    particular phenotypes in some ancestries.

                                    The benefits from genetic discovery efforts as GWAS sample sizes increase will likely not
                                    be measured just by the number of loci discovered. Rather, the focus will increasingly
                                    turn to improving our understanding of the biology at established loci, identifying
                                    potential therapeutic targets, and efficiently identifying individuals at high-risk of adverse
                                    health outcomes across population groups without exacerbating existing health disparities.
                                    Considering the results presented here, and those of related studies37–39, we believe future
                                    genetic studies will benefit substantially from meta-analysis across participants of diverse
Author Manuscript

                                    ancestries. Further gains in the depth and number of sequenced individuals of diverse
                                    ancestries40,41 may additionally improve discovery of novel variants and loci in diverse
                                    cohorts, particularly variants absent from arrays and imputation reference panels. Our results
                                    suggest that diversifying the populations under study, rather than simply increasing the
                                    sample size, is now the single most efficient approach to achieving these goals, at least
                                    for blood lipids and likely for tightly related downstream adverse health outcomes such as
                                    cardiovascular disease. However, if costs for recruitment of diverse populations are higher
                                    than recruitment of individuals from previously studied ancestry groups, and total number

                                            Nature. Author manuscript; available in PMC 2022 June 09.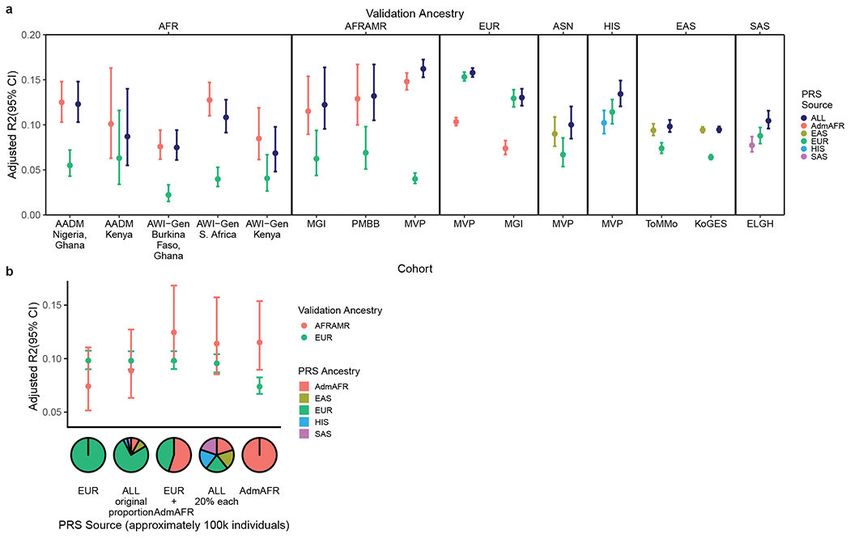
Graham et al.                                                                                           Page 7

                                    of genome-wide significant index variants is the goal, then continued low-cost recruitment
Author Manuscript

                                    of majority ancestry groups is expected to still provide some benefit. Taken together, our
                                    results also strongly support ongoing and future large-scale recruitment efforts targeted
                                    at the enrollment and DNA collection of non-European ancestry participants. Geneticists
                                    and those responsible for cohort development must continue diversifying genetic discovery
                                    datasets, while increasing sample size in a cost-effective manner, to ensure genetic studies
                                    reduce rather than exacerbate existing health inequities across race, ancestry, geographic
                                    region, and nationality.

                       Methods:
                       Cohort level analysis
                                    Each cohort contributed GWAS summary statistics for HDL-C, LDL-C, nonHDL-C, TC and
                                    TG, imputation quality statistics, and analysis metrics for quality control (QC), following
Author Manuscript

                                    a detailed analysis plan (Supplementary File 1). Briefly, we requested that each cohort
                                    perform imputation to 1000 Genomes Phase 3 (1KGP3), with European ancestry cohorts
                                    additionally imputing with the Haplotype Reference Consortium (HRC) panel using the
                                    Michigan Imputation Server (https://imputationserver.sph.umich.edu/index.html#!) which
                                    uses Minimac software42. Detailed pre-imputation QC guidelines were provided; these
                                    included removing samples with call rate < 95%, samples with heterozygosity > median
                                    + 3(interquartile range), ancestry outliers from principal component analysis within each
                                    ancestry group, and variants deviating from Hardy-Weinberg equilibrium (p-value < 10−6)
                                    or with variant call rate < 98%. Analyses were carried out separately by ancestry group
                                    and were additionally stratified by cases and controls where appropriate (i.e. for a disease-
                                    focused cohort such as CAD). Residuals were generated separately in males and females
                                    adjusting for age, age2, principal components of ancestry, and any necessary study-specific
Author Manuscript

                                    covariates. Triglyceride levels were natural-log transformed before generating residuals.
                                    Inverse normalization was then done on the residual values. Individuals on cholesterol
                                    lowering medication had their pre-medication levels43 approximated by dividing the LDL-C
                                    value by 0.7 and the TC value by 0.8. Association analysis of the residuals for the majority
                                    of cohorts was carried out using a linear mixed-model approach in rvtests or with other
                                    similar software including BOLT-LMM44, SAIGE45, or deCode association software.

                       Quality Control
                                    Each input file was assessed for quality control using the EasyQC software46 (www.genepi-
                                    regensburg.de/easyqc). We generated QQ plots by minor allele frequency (MAF) bins,
                                    assessed trends in standard errors relative to sample size for each cohort, and checked MAF
                                    of submitted variants relative to their expected value based on the imputation reference
Author Manuscript

                                    panel. In addition, we checked that each cohort reproduced the expected direction of effect
                                    at most known loci relative to the cohort sample size. Cohorts identified to have issues with
                                    the submitted files were contacted and corrected files were submitted or the cohort was
                                    excluded from meta-analysis. Results from either sex-stratified analysis or sex-combined
                                    analysis with sex as a covariate were used. During the QC process, within each cohort
                                    we removed poorly imputed variants (info score or r2 < 0.3), variants deviating from Hardy-
                                    Weinberg Equilibrium (HWE p-value < 10−8, except for MVP which used HWE p-value

                                            Nature. Author manuscript; available in PMC 2022 June 09.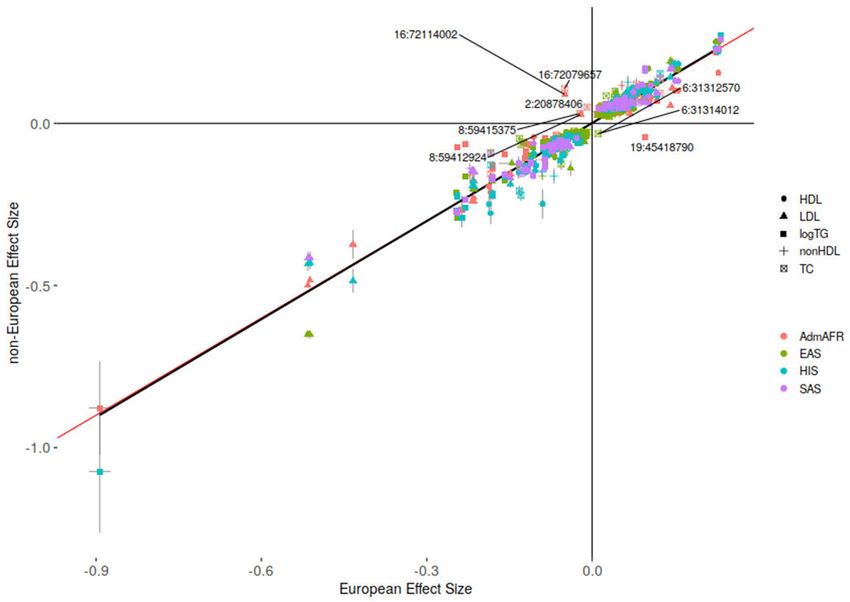
Graham et al.                                                                                           Page 8

                                    < 10−20), and variants with minor allele count < 3. An imputation info score threshold of
Author Manuscript

                                    0.3 was selected to balance the inclusion of variants across diverse studies while removing
                                    poorly imputed variants. Summary statistics were then genomic-control (GC) corrected
                                    using the λGC value calculated from the median p-value of variants with MAF > 0.5%. To
                                    capture as many variants as possible, summary statistics from cohorts that had submitted
                                    both HRC and 1KGP3 imputed files were joined, selecting variants imputed from HRC
                                    where both imputed versions of a variant existed. For variants imputed by both panels, we
                                    observed that variants imputed from the HRC panel resulted in a higher imputation info
                                    score for 94% of variants when compared to the imputation info score from 1KGP3.

                       Meta-analysis
                                    Ancestry-specific meta-analysis was performed using RAREMETAL47 (https://github.com/
                                    SailajaVeda/raremetal). Trans-ancestry meta-analysis was performed using MR-MEGA48
Author Manuscript

                                    with 5 principal components of ancestry. The choice of 5 principal components was made
                                    after comparing the λGC values across minor allele frequency bins from meta-analysis of
                                    HDL-C with MR-MEGA using from 2 up to 10 principal components. In addition, fixed-
                                    effects meta-analysis was carried out with METAL49 to calculate effect sizes for use in the
                                    creation of polygenic scores. Study-level principal components were plotted for each cohort
                                    by ancestry group to verify that the reported ancestry for each cohort was as expected.
                                    Following meta-analysis, we identified loci based on a genome-wide significance threshold
                                    of 5x10⁻⁸ after GC correction using the λGC value calculated from the median p-value
                                    of variants with MAF > 0.5%. The choice of double-GC correction was made to be most
                                    conservative and to minimize potential false-positive findings. Observed λGC values were
                                    within the expected range for similarly sized studies and are included in Supplementary
                                    Tables 2 and 4. Variants with a cumulative minor allele count ≤ 30 and those found in
Author Manuscript

                                    a single study were excluded from index variant selection. Index variants were identified
                                    following an iterative procedure starting with the most significant variant and grouping
                                    the surrounding region into a locus based on the larger of either ± 500 kb or ± 0.25
                                    cM. cM positions were interpolated using the genetic map distributed with Eagle v2.3.2
                                    (genetic_map_hg19_withX.txt)50. Variants were annotated using WGSA51 including the
                                    summary of each variant from SnpEff52 and the closest genes for intergenic variants from
                                    ANNOVAR53. Annotation of variants as known or novel was done based on manual review
                                    of previously published variants and with variants reported in the GWAS catalog27 for any
                                    of the studied lipid traits (accessed May 2020, provided as Supplementary Table 18). For
                                    comparison between ancestries and lipid traits, index variants were grouped into genomic
                                    regions starting with the most significantly associated variant and grouping all surrounding
                                    index variants within ± 500 kb into a single region.
Author Manuscript

                                    Power to detect association within each ancestry was determined using the effect size and
                                    sample size of the variant within the original discovery ancestry group and the observed
                                    allele frequency from the other ancestry groups with alpha set to 5x10⁻⁸. We excluded
                                    variants that were only successfully imputed in a single ancestry group to account for
                                    imputation panel differences between groups (ie. Haplotype Reference Consortium for
                                    European ancestry individuals and 1000 Genomes for other ancestries). Variants that were
                                    successfully imputed in 2 or more ancestries were assumed to have zero power in any

                                            Nature. Author manuscript; available in PMC 2022 June 09.
Graham et al.                                                                                             Page 9

                                    other ancestry where the variant was not successfully imputed. The proportion of variance
                                    explained by each variant was estimated as 2β2(1-f)f where β is the effect size from METAL
Author Manuscript

                                    and f is the effect allele frequency (Supplementary Table 19). The proportion of variance
                                    explained within each ancestry was estimated using the trans-ancestry effect size from
                                    METAL with the ancestry-specific allele frequency. Coverage of the genome by associated
                                    genetic regions was calculated using BEDTools54 for the regions defined by the minimum
                                    and maximum position within each locus having p-value < 5x10⁻⁸.

                       Conditional analysis
                                    Approximate conditional analysis was performed using rareGWAMA55 to identify index
                                    variants that were shadows of nearby, more significant associations. LD reference
                                    populations were taken from UK Biobank specific to Admixed African, European (subset of
                                    40,000), or South Asian ancestry individuals or from the 1000 Genomes project (1KGP3)
Author Manuscript

                                    for East Asian or Hispanic ancestry individuals. Conditional analysis was carried out
                                    using the individual cohort level summary statistics as was done for meta-analysis with
                                    RAREMETAL. rareGWAMA requires imputation quality scores which were set to 1 for
                                    all variants that had previously passed quality control (pre-filtered at imputation info/r2 >
                                    0.3). The European ancestry subset of UK Biobank was used as the reference population
                                    for the conditional analysis of the trans-ancestry meta-analysis (~80% European ancestry).
                                    Stepwise conditional analysis was performed sequentially for the index variants within each
                                    chromosome ranked by most to least significant. Index variants were then flagged as not
                                    independent from other more significant variants if the absolute value of the ratio of the
                                    original effect size to the effect size after conditional analysis was greater than the 95th
                                    percentile of all values (Supplementary Figure 10). This threshold was selected to remove
                                    variants whose effects were driven by nearby, more strongly associated variants in LD. This
Author Manuscript

                                    corresponded to a ratio of original to conditional effect size of 1.6 for ancestry-specific
                                    conditional analysis and a ratio of 1.7 for the trans-ancestry conditional analysis. The effect
                                    sizes from meta-analysis with METAL were used for comparison with the trans-ancestry
                                    conditional analysis results. Variants flagged as non-independent were excluded from the
                                    summary results in the manuscript and are flagged as non-independent in Supplementary
                                    Tables 3 and 5.

                       Genetic correlation
                                    Popcorn29 was used to assess the degree of correlation in effect sizes between ancestry
                                    groups for each of the lipid traits with 1000 Genomes phase 3 as the reference LD
                                    panel. Only variants with MAF > 0.01 in each ancestry individually were included in
                                    the comparison. Both the genetic effect and genetic impact models were tested. Bivariate
Author Manuscript

                                    GREML from GCTA was used to calculate the genetic correlation between unrelated
                                    Admixed Africans and a subset of white British individuals in the UK Biobank following the
                                    method of Guo et al30,31. HapMap3 variants with MAF > 0.01 in each ancestry were used
                                    to construct the genetic relationship matrix (GRM) with the allele frequencies standardized
                                    in each population. Individuals with genetic relatedness > 0.05 were removed. A total of up
                                    to 5,575 AdmAfr and 38,668 white British individuals from UK Biobank were included in
                                    the analysis of each trait after removal of related individuals. The measured lipid traits were
                                    corrected for medication use and were inverse-normalized after correction for age, sex, and

                                             Nature. Author manuscript; available in PMC 2022 June 09.
Graham et al. Page 10
batch. Principal components 1-20 constructed from the GRM were included as covariates in
Author Manuscript
the calculation of genetic correlation. Analysis within the Million Veteran Program included
24,502 European ancestry and 21,950 African American unrelated individuals. Maximum
measured values were used for LDL-C, TC, and triglycerides and minimum values for
HDL-C. Lipid traits were inverse-normalized after correction for age and sex with principal
components 1-20 included as covariates in the calculation of genetic correlation.
Credible sets
Credible sets of potentially causal variants were generated for each of the loci identified
in the trans-ancestry meta-analysis. We determined 99% credible sets of variants that
encompassed the causal variant with 99% posterior probability. Regions for construction
of credible sets were defined as the ± 500 kb region around each index variant. Bayes
factors56,57 (BF) for each variant in the ancestry-specific meta-analysis were approximated
Author Manuscript
by:
β2
BF ≈ exp 0.5 − log NAS
SE2
where β and SE are the effect sizes and standard errors from the RAREMETAL meta-
analysis, and NAS is the ancestry-specific sample size. A full derivation is included in the
Supplementary Methods. To account for the difference in sample sizes between ancestry
groups, we additionally approximated the Bayes factors after adjustment for the total trans-
ancestry sample size for each trait (NTE) relative to the ancestry-specific sample size for that
trait using the following equation:
β2NT E
Author Manuscript
BF ≈ exp 0.5 − log NT E
SE2NAS
Credible sets for the trans-ancestry meta-analysis were generated using the Bayes factors
as output by MR-MEGA. The credible sets within each region were generated by ranking
all variants by Bayes factor and calculating the number of variants required to reach a
cumulative probability of 99%. In addition, we calculated credible sets in the same manner
using the European ancestry and trans-ancestry meta-analysis results but including only
the set of variants present in the AdmAFR meta-analysis. To summarize the size of the
credible sets across the 5 lipid traits examined, we identified the set of independent index
variants from the trans-ancestry meta-analysis after grouping variants based on LD. For
each ± 500kb region centered around the most-significantly associated index variant for
Author Manuscript
any trait, we determined the pairwise LD between all index variants in this region using
LDpair58 with all reference populations (1000 Genomes AFR, AMR, EAS, EUR, and SAS)
included. We considered variants to be independent if they were outside of this region, had
LD r2 < 0.7, or were not available in the LDpair reference populations. Variants within the
credible sets were annotated with SnpEff52 using WGSA51 and with VEP59. The number
of variants in LD with an index variant was determined using LDproxy58 (Supplementary
Table 20). Protein numbering was taken from dbSNP60. eQTL colocalization was performed
Nature. Author manuscript; available in PMC 2022 June 09.Graham et al. Page 11
using coloc61 version 3.2.1 with R version 3.4.3 using the default parameters. Results from
GTEx V862 were compared with the GWAS signals in the region defined by the larger of
Author Manuscript
±0.25cM or ±500kb surrounding each index variant. The eQTL and GWAS signals (based
on p-values from MR-MEGA) were considered to be colocalized if PP3 + PP4 ≥ 0.8 and if
PP4/(PP3+PP4) > 0.9, where PP3 is the probability of two independent causal variants while
PP4 is the probability of a single, shared causal variant.
LDL-C polygenic scores
Weights for the LDL-C polygenic scores were derived from beta estimates generated
from each of the ancestry-specific meta-analyses and from the trans-ancestry results using
METAL. Additional meta-analyses were carried out using the 2010 Global Lipids Genetics
Consortium LDL-C meta-analysis results4 in combination with the i) Admixed African or ii)
Admixed African, East Asian, Hispanic, and South Asian ancestry results from the present
Author Manuscript
meta-analysis for comparison. Furthermore, we performed a meta-analysis of European
ancestry cohorts randomly selected to reach a total sample size near 100K, 200K, or 400K
to understand the role of increasing European ancestry sample size and the influence of
imputation panel. In addition, we tested possible methods for improving performance of
European ancestry derived scores in African ancestry individuals by separately fitting the
European ancestry polygenic scores in the UK Biobank Admixed African ancestry subset to
determine the best set of risk score parameters (various pruning and thresholding parameters
or PRS-CS, Supplementary Note).
We generated polygenic score weights using both: i) significant variants only (at a variety
of p-value thresholds) and ii) using genome-wide methods. Meta-analysis results were
first filtered to variants present in UK Biobank, MGI, and MVP with imputation info
score > 0.3. Pruning and thresholding was performed in PLINK63 with ancestry-matched
Author Manuscript
subsets of UK Biobank individuals (AdmAFR N=7,324, EUR N=40,000, SAS N=7,193,
trans-ancestry: N=10,000 (80% EUR, 15% AdmAFR, 5% SAS)) or 1KGP3 (HIS N=347 ,
EAS N=504) used for LD reference. We additionally tested 1000 Genomes phase 3 with
all populations included as the LD reference panel for the trans-ancestry score (results not
shown), which gave very similar results to those of the UK Biobank trans-ancestry reference
set originally selected for its larger sample size. P-value thresholds (after GC correction)
of 5x10⁻¹⁰, 5x10⁻⁹, 5x10⁻⁸, 5x10⁻⁷, 5x10⁻⁶, 5x10⁻⁵, 5x10⁻⁴, 5x10⁻³, and 5x10⁻² were
tested with distance thresholds of 250 and 500 kb and LD r2 thresholds of 0.1 and 0.2.
Polygenic score weights were also generated using PRS-CS32 with the LD reference panels
for African, East Asian, and European ancestry populations from 1000 Genomes provided
by the developers. PRS-CS LD reference panels for the other ancestries were generated
using 1000 Genomes following the same protocol as provided by the PRS-CS authors32.
Author Manuscript
This included removing variants with MAF ≤ 0.01, ambiguous A/T or G/C variants, and
restricting to variants included in HapMap3. Pairwise LD matrices within pre-defined LD
blocks64 (using European LDetect blocks for Hispanic and trans-ancestry LD calculations
and Asian blocks for South Asian) were then calculated using PLINK and converted to
HDF5 format.
Nature. Author manuscript; available in PMC 2022 June 09.Graham et al. Page 12
For each individual in the testing cohorts, polygenic scores were calculated as the sum of
Author Manuscript
the dosages multiplied by the given weight at each variant. UK Biobank individuals not
present in datasets used to generate the summary statistics (either Admixed African, white
British, both Admixed African and white British, East Asian, South Asian, or all individuals
excluding South Asian) were used to select the best performing Admixed African, European,
Admixed African+European, East Asian, South Asian, and trans-ancestry polygenic scores,
respectively. UK Biobank South Asian ancestry individuals were included in the trans-
ancestry risk score weights but excluded from the UK Biobank trans-ancestry testing
set due to an initial focus on comparing predictions among European and African
ancestry individuals. Sample sizes of the ancestry groups in UK Biobank used to test
PRS performance included: AdmAFR N=6,863; EAS N=1,441; EUR N=389,158; SAS
N=6,814; ALL=461,918. The best performing Hispanic ancestry polygenic score weights
were selected based on performance in Hispanic ancestry individuals in the Michigan
Genomics Initiative dataset. Model fit was assessed by the adjusted R2 of a linear model
Author Manuscript
for LDL-C value at initial assessment adjusted for cholesterol medication (divided by 0.7
to estimate pre-medication levels) with sex, batch, age at initial assessment, and PCs1-4
as covariates (Supplementary Tables 21–23). Python and R were used for analysis of PRS
models.
The best performing polygenic score in each ancestry group was then tested in the
validation cohorts: the Michigan Genomics Initiative (EUR N=17,190; AFRAMR N=1,341),
East London Genes and Health65 (ELGH; SAS N=15,242), Tohoku Medical Megabank
Community Cohort Study (ToMMo; EAS N=28,217), Korean Genome and Epidemiology
Study66 (KoGES; EAS N=118,260), Penn Medicine BioBank (PMBB; AFRAMR=2,138),
Africa America Diabetes Mellitus (AADM; 3,566 West AFR; 707 East AFR), Africa
Wits-INDEPTH partnership for Genomic Studies (AWI-Gen; 1,744 East AFR; 4,972 South
Author Manuscript
AFR; 3,744 West AFR) and Million Veteran Program participants not included in the
discovery meta-analysis (MVP; EUR N=68,381; AFRAMR N=18,251; EAS/SAS N=4,155;
HIS N=7,669). Adjusted R2 values were reported for each cohort and ancestry group, with
95% confidence intervals for the adjusted R2 values calculated using bootstrapping. Within
each cohort, covariates used were: MGI- sex, batch, PC1-4, and birth year; PMBB- birth
year, sex, and PC1-4; ELGH- age, sex, and PC1-10; MVP- sex, PC1-4, birth year, and mean
age; ToMMo-sex, age, recruitment method, and PC1-20 (only participants from Miyagi
Prefecture were included); KoGES-age, sex, and recruitment area, AADM-age, sex, PC1-3,
AWI-Gen East Africa- age, sex, PC1-6, AWI-Gen South Africa- age, sex, PC1-6, and AWI-
Gen West Africa- age, sex, and PC1-4. The type of LDL-C value used in the model varied
depending on the measurements selected by each cohort. Mean LDL-C values were used for
MGI, MVP and PMBB, maximum LDL-C values for ELGH, and baseline measurements
Author Manuscript
for AADM, AWI-Gen, ToMMo and KoGES. A descriptive summary of each validation
cohort is included in Supplementary Table 16. African admixture for MGI was calculated
using all African ancestry individuals in 1000 Genomes with ADMIXTURE v1.367. African
admixture for MVP was calculated using the YRI and LWK African ancestry individuals in
1000 Genomes.
Nature. Author manuscript; available in PMC 2022 June 09.Graham et al. Page 13
Extended Data
Author Manuscript
Author Manuscript
Author Manuscript
Author Manuscript
Extended Data Figure 1: Effect sizes of identified index variants from trans-ancestry meta-
analysis
Index variants associated with a) HDL cholesterol, b) LDL cholesterol, c) triglycerides,
d) nonHDL cholesterol and e) total cholesterol include both common variants of small to
moderate effect and low frequency variants of moderate to large effect.
Nature. Author manuscript; available in PMC 2022 June 09.Graham et al. Page 14
Author Manuscript
Author Manuscript
Author Manuscript
Extended Data Figure 2: Comparison of the number of index variants by sample size
a) Comparison of the number of index variants reaching genome-wide significance (p <
5x10⁻⁸) from meta-analysis of LDL-C in each ancestry group. A meta-analysis of five
random subsets of European cohorts selected to reach sample sizes of approximately
100,000, 200,000, 400,000, 600,000, or 800,000 individuals is also shown.
b) Comparison of chi-squared values from meta-analysis of LDL-C for each possible
combination of ancestry groups (without genomic-control correction) for variants with
minor allele frequency (MAF) ≥ 5%. The colored lines indicate a linear regression model of
Author Manuscript
all meta-analyses for a specific ancestry (eg. all analyses including European individuals).
c) Comparison of chi-squared values from meta-analysis of LDL-C for variants with MAF ≤
5%.
d) Comparison of chi-squared valued for variants with MAF ≥ 5% for LDL-C without
genomic-control correction in a meta-analysis of all European cohorts as well as five subsets
selected to reach sample sizes of approximately 100,000, 200,000, 400,000, 600,000, or
800,000 individuals.
Nature. Author manuscript; available in PMC 2022 June 09.Graham et al. Page 15
Author Manuscript
Author Manuscript
Author Manuscript
Extended Data Figure 3: Effect sizes by ancestry for unique index variants from ancestry-
specific meta-analysis
Comparison of effect sizes and standard errors for variants reaching genome-wide
significance (p-value < 5x10⁻⁸ as given by RAREMETAL) in both ancestry groups. Variants
with discordant directions of effect between ancestries are labeled by chromosome and
position (build 37). Association results for all index variants are given in Supplementary
Table 3. The red line depicts an equivalent European ancestry and non-European ancestry
effect size while the black line depicts a linear regression model. R2=0.93
Author Manuscript
Nature. Author manuscript; available in PMC 2022 June 09.Graham et al. Page 16
Author Manuscript
Author Manuscript
Extended Data Figure 4: Comparison of credible set size
The number of variants in the 99% credible sets for each association signal are compared
between a) Admixed African ancestry and trans-ancestry analysis and b) European ancestry
and trans-ancestry analysis
Author Manuscript
Author Manuscript
Nature. Author manuscript; available in PMC 2022 June 09.Graham et al. Page 17
Author Manuscript
Author Manuscript
Author Manuscript
Extended Data Figure 5: Overview of LDL-C polygenic score generation and validation
Author Manuscript
Polygenic scores were calculated separately in each ancestry group or in all ancestries
combined using either pruning and thresholding or PRS-CS. The polygenic scores were
then taken forward for testing in ancestry-matched participants followed by validation in
independent data sets.
Nature. Author manuscript; available in PMC 2022 June 09.Graham et al. Page 18
Author Manuscript
Author Manuscript
Author Manuscript
Extended Data Figure 6: Optimal polygenic score threshold by ancestry group for either PRS-CS
or pruning and thresholding based LDL-C polygenic scores
Adjusted R2 estimated upon testing in UK Biobank ancestry-matched participants (not
Author Manuscript
included in GWAS summary statistics).
a. Admixed African, East Asian and South Asian ancestry polygenic scores
b. European and trans-ancestry polygenic scores
c. European ancestry (GLGC 2010) and trans-ancestry polygenic scores
d. All polygenic scores across all thresholds used for score construction
Nature. Author manuscript; available in PMC 2022 June 09.Graham et al. Page 19
e. Comparison of adjusted R2 across ancestry groups relative to the maximum
Author Manuscript
for covariates alone, polygenic scores from PRS-CS or polygenic scores from
pruning and thresholding
Author Manuscript
Author Manuscript
Author Manuscript
Extended Data Figure 7: Comparison of PRS performance by admixture quartile
We divided the testing cohorts into quartiles by proportion of African ancestry and estimated
the performance of the PRS separately within each quartile in a) the Michigan Genomics
Initiative (N = 1,341) and b) in the Million Veteran Program (N = 18,251). Error bars
represent 95% confidence intervals.
Nature. Author manuscript; available in PMC 2022 June 09.Graham et al. Page 20
Author Manuscript
Author Manuscript
Author Manuscript
Extended Data Figure 8: Improvement in PRS performance in African Americans when starting
with ancestry-mismatched European ancestry scores by updating weights, updating variant lists,
or updating both variants and weights to be ancestry-matched.
By comparison to the gold-standard performance of the trans-ancestry-derived PRS in
African Americans (adjusted R2 = 0.12), a European ancestry derived score capture only
47% of the variance explained by the trans-ancestry PRS. When LD and association
information from the target population is used to optimize the list of variants for inclusion
in the PRS, but with ancestry-mismatched weights from European ancestry GWAS, the
variance explained reaches 71% of the gold standard. If the PRS variant list selected in
Author Manuscript
European ancestry individuals were genotyped in the target population, and PRS weights
were updated using a GWAS from the target population, the variance explained reached
87% of the gold standard. Finally, deriving both the marker list and weights from the
target population (single-ancestry GWAS) explained 94% of the variance relative to the
gold-standard trans-ancestry PRS.
Nature. Author manuscript; available in PMC 2022 June 09.Graham et al. Page 21
Supplementary Material
Author Manuscript
Refer to Web version on PubMed Central for supplementary material.
Authors
Sarah E Graham1, Shoa L Clarke2,3, Kuan-Han H Wu4, Stavroula Kanoni5,
Greg JM Zajac6, Shweta Ramdas7, Ida Surakka1, Ioanna Ntalla8, Sailaja
Vedantam9,10, Thomas W Winkler11, Adam E Locke12, Eirini Marouli5, Mi
Yeong Hwang13, Sohee Han13, Akira Narita14, Ananyo Choudhury15, Amy R
Bentley16, Kenneth Ekoru16, Anurag Verma17, Bhavi Trivedi18, Hilary C Martin19,
Karen A Hunt18, Qin Hui20,21, Derek Klarin22,23,24, Xiang Zhu25,26,27,28, Gudmar
Thorleifsson29, Anna Helgadottir29, Daniel F Gudbjartsson29,30, Hilma Holm29,
Isleifur Olafsson31, Masato Akiyama32,33, Saori Sakaue34,32,35, Chikashi Terao36,
Author Manuscript
Masahiro Kanai37,38,39, Wei Zhou40,41,42, Ben M Brumpton43,44,45, Humaira
Rasheed43,44, Sanni E Ruotsalainen46, Aki S Havulinna46,47, Yogasudha Veturi48,
QiPing Feng49, Elisabeth A Rosenthal50, Todd Lingren51, Jennifer Allen Pacheco52,
Sarah A Pendergrass53, Jeffrey Haessler54, Franco Giulianini55, Yuki Bradford48,
Jason E Miller48, Archie Campbell56,57, Kuang Lin58, Iona Y Millwood58,59, George
Hindy60, Asif Rasheed61, Jessica D Faul62, Wei Zhao63, David R Weir62, Constance
Turman64, Hongyan Huang64, Mariaelisa Graff65, Anubha Mahajan66,#, Michael R
Brown67, Weihua Zhang68,69,70, Ketian Yu71, Ellen M Schmidt71, Anita Pandit71,
Stefan Gustafsson72, Xianyong Yin73, Jian’an Luan74, Jing-Hua Zhao75, Fumihiko
Matsuda76, Hye-Mi Jang13, Kyungheon Yoon13, Carolina Medina-Gomez77,78,
Achilleas Pitsillides79, Jouke Jan Hottenga80,81, Gonneke Willemsen80,82, Andrew
R Wood83, Yingji Ji83, Zishan Gao84,85,86, Simon Haworth87,88, Ruth E Mitchell87,89,
Author Manuscript
Jin Fang Chai90, Mette Aadahl91, Jie Yao92, Ani Manichaikul93, Helen R
Warren94,95, Julia Ramirez94, Jette Bork-Jensen96, Line L Kårhus91, Anuj Goel97,98,
Maria Sabater-Lleal99,100, Raymond Noordam101, Carlo Sidore102, Edoardo
Fiorillo103, Aaron F McDaid104,105, Pedro Marques-Vidal106, Matthias Wielscher107,
Stella Trompet108,109, Naveed Sattar110, Line T Møllehave91, Betina H Thuesen91,
Matthias Munz111, Lingyao Zeng112,113, Jianfeng Huang114, Bin Yang114, Alaitz
Poveda115, Azra Kurbasic115, Claudia Lamina116, Lukas Forer116, Markus
Scholz117,118, Tessel E. Galesloot119, Jonathan P. Bradfield120, E Warwick Daw121,
Joseph M Zmuda122, Jonathan S Mitchell123, Christian Fuchsberger123, Henry
Christensen124, Jennifer A Brody125, Mary F Feitosa121, Mary K Wojczynski121,
Michael Preuss126, Massimo Mangino127,128, Paraskevi Christofidou127, Niek
Verweij129, Jan W Benjamins129, Jorgen Engmann130,131, Rachel L Kember132,
Author Manuscript
Roderick C Slieker133,134, Ken Sin Lo135, Nuno R Zilhao136, Phuong Le137,
Marcus E Kleber138,139, Graciela E Delgado138, Shaofeng Huo140, Daisuke D
Ikeda141, Hiroyuki Iha141, Jian Yang142,143, Jun Liu144, Hampton L Leonard145,146,
Jonathan Marten147, Börge Schmidt148, Marina Arendt148,149, Laura J Smyth150,
Marisa Cañadas-Garre150, Chaolong Wang151,152, Masahiro Nakatochi153, Andrew
Wong154, Nina Hutri-Kähönen155,156, Xueling Sim90, Rui Xia157, Alicia Huerta-
Chagoya158, Juan Carlos Fernandez-Lopez159, Valeriya Lyssenko160,161, Meraj
Ahmed162, Anne U Jackson6, Marguerite R Irvin163, Christopher Oldmeadow164,
Nature. Author manuscript; available in PMC 2022 June 09.Graham et al. Page 22
Han-Na Kim165,166, Seungho Ryu167,168, Paul RHJ Timmers169,147, Liubov
Arbeeva170, Rajkumar Dorajoo152, Leslie A Lange171, Xiaoran Chai172,173, Gauri
Author Manuscript
Prasad174,175, Laura Lorés-Motta176, Marc Pauper176, Jirong Long177, Xiaohui
Li92, Elizabeth Theusch178, Fumihiko Takeuchi179, Cassandra N Spracklen180,181,
Anu Loukola46, Sailalitha Bollepalli46, Sophie C Warner182,183, Ya Xing Wang184,
Wen B. Wei185, Teresa Nutile186, Daniela Ruggiero186,187, Yun Ju Sung188, Yi-
Jen Hung189, Shufeng Chen114, Fangchao Liu114, Jingyun Yang190,191, Katherine
A Kentistou169, Mathias Gorski11,192, Marco Brumat193, Karina Meidtner194,195,
Lawrence F Bielak196, Jennifer A Smith196,62, Prashantha Hebbar197, Aliki-Eleni
Farmaki198,199, Edith Hofer200,201, Maoxuan Lin202, Chao Xue1, Jifeng Zhang1,
Maria Pina Concas203, Simona Vaccargiu204, Peter J van der Most205, Niina
Pitkänen206,207, Brian E Cade208,209, Jiwon Lee208, Sander W. van der Laan210,
Kumaraswamy Naidu Chitrala211, Stefan Weiss212, Martina E Zimmermann11,
Jong Young Lee213, Hyeok Sun Choi214, Maria Nethander215,216, Sandra
Author Manuscript
Freitag-Wolf217, Lorraine Southam218,219, Nigel W Rayner220,221,222,218, Carol
A Wang223, Shih-Yi Lin224,225,226, Jun-Sing Wang227,228, Christian Couture229,
Leo-Pekka Lyytikäinen230,231, Kjell Nikus232,233, Gabriel Cuellar-Partida234, Henrik
Vestergaard235, Bertha Hildalgo236, Olga Giannakopoulou5, Qiuyin Cai177, Morgan
O Obura237, Jessica van Setten238, Xiaoyin Li239, Karen Schwander240, Natalie
Terzikhan241, Jae Hun Shin214, Rebecca D Jackson242, Alexander P Reiner243,
Lisa Warsinger Martin244, Zhengming Chen245,246, Liming Li247, Heather M
Highland65, Kristin L Young65, Takahisa Kawaguchi76, Joachim Thiery248,118,
Joshua C Bis125, Girish N. Nadkarni126, Lenore J Launer249, Huaixing Li140,
Mike A Nalls145,146, Olli T Raitakari250,251,252, Sahoko Ichihara253, Sarah H
Wild254, Christopher P Nelson182,183, Harry Campbell169, Susanne Jäger194,195,
Toru Nabika255, Fahd Al-Mulla256, Harri Niinikoski257,258, Peter S Braund182,183,
Author Manuscript
Ivana Kolcic259, Peter Kovacs260, Tota Giardoglou261, Tomohiro Katsuya262,263,
Konain Fatima Bhatti5, Dominique de Kleijn264, Gert J. de Borst264, Eung
Kweon Kim265, Hieab H.H. Adams241,266, M. Arfan Ikram241, Xiaofeng Zhu239,
Folkert W Asselbergs238, Adriaan O Kraaijeveld238, Joline WJ Beulens133,267,
Xiao-Ou Shu177, Loukianos S Rallidis268, Oluf Pedersen96, Torben Hansen96,
Paul Mitchell269, Alex W Hewitt270,271, Mika Kähönen272,273, Louis Pérusse229,274,
Claude Bouchard275, Anke Tönjes276, Yii-Der Ida Chen92, Craig E Pennell223,
Trevor A Mori277, Wolfgang Lieb278, Andre Franke279, Claes Ohlsson280,281,
Dan Mellström280,282, Yoon Shin Cho214, Hyejin Lee283, Jian-Min Yuan284,285,
Woon-Puay Koh286,287, Sang Youl Rhee288, Jeong-Taek Woo288, Iris M Heid11,
Klaus J Stark11, Henry Völzke289, Georg Homuth212, Michele K Evans290, Alan
B Zonderman290, Ozren Polasek259, Gerard Pasterkamp210, Imo E Hoefer210,
Author Manuscript
Susan Redline208,209, Katja Pahkala206,207,291, Albertine J Oldehinkel292, Harold
Snieder205, Ginevra Biino293, Reinhold Schmidt200, Helena Schmidt294, Y
Eugene Chen1, Stefania Bandinelli295, George Dedoussis198, Thangavel Alphonse
Thanaraj256, Sharon LR Kardia196, Norihiro Kato179, Matthias B Schulze194,195,296,
Giorgia Girotto193,297, Bettina Jung298, Carsten A Böger298,299,300, Peter K
Joshi169, David A Bennett190,191, Philip L De Jager301,302, Xiangfeng Lu114,
Vasiliki Mamakou303,304, Morris Brown305,95, Mark J Caulfield94,95, Patricia
Nature. Author manuscript; available in PMC 2022 June 09.You can also read