Highly-Accessible Catalysts for Durable High-Power Performance - FC144
←
→
Page content transcription
If your browser does not render page correctly, please read the page content below
FC144

 Highly-Accessible Catalysts for
 Durable High-Power Performance

 Anusorn Kongkanand (PI)
 General Motors, Fuel Cell Activities

 June 7, 2017

This presentation does not contain any proprietary, confidential, or otherwise restricted information
Overview
 Barriers
 Timeline • B. Cost
• Project start date: 1 Apr 2016 – Decrease amount of precious metals.
 • A. Durability
• Project end date: 30 Jun 2019
 – Improve kinetic activity and high current
• Percent complete: 12.2% density performance
 • C. Performance
 – Achieve and maintain high current densities
 at acceptably-high voltages
 Budget
 Partners
• Total Funding Spent as of 2/28/17:
 $0.5M • Subcontractors:
 – 3M Company Not signed
• Total DOE Project Value: – Carnegie Mellon University Signed 3/2017

 $4.59M – Cornell University Signed 4/2017
 – Drexel University Not signed
• Cost Share: 21.7% – NREL Signed 8/2016

 • Project lead: GM

 2
Relevance: Challenge: Local Transport Losses Mass-transport Voltage Losses Cathode mgPt/cm2 0.9 PtCo, 0.20 PtCo, 0.10 1.75 A/cm2 on a 0.10 PtCo, 0.05 mgPt/cm2 cathode 0.8 O2 Voltage (V) 0.7 Lower Pt loading O2 through Ionomer/Pt Interface H+ and O2 through Carbon 0.6 Micropores O2 H+, O2 0.5 O2 ionomer H2/air, 94°C, 250/250 kPaabs,out, 65/65% RHin, st=1.5/2 - - - - - 0.4 - - 0 0.5 1 1.5 2 Pt Current Density (A/cm²) carbon FC087 Dealloyed PtCo and PtNi met Catalyst Targets but not MEA Targets. Large performance loss at high-current density is observed on low-Pt cathodes due to higher flux of O2 and proton per a given Pt area. The ‘local transport resistance’ dominates the mass transport related loss (purple) at HCD on low-Pt electrode. Likely a sum of H+ and O2 resistance at ionomer/Pt interface and in carbon micropores. Want to reduce apparent RPt from ~25 s/cm to
Relevance: Targets and Status DOE PtCo/HSC-a PtCo/HSC-e PtCo/HSC-f Project Metric Units 2020 Target 2016 2017-1 2017-2 Target 2 PGM total loading (both electrodes) mg/cm 0.125 0.125 0.088 0.44 Loss in catalytic (mass) activity % loss 0-40% 40% TBD 0.3 Power at rated power (150kPa, 94°C) W/cm2 0.80 0.89 0.93 >1.0 - Power at rated power (250kPa, 94°C) W/cm2 1.01 1.19 1.26 - >1.1 Must meet Q/ΔT 8 or >0.67 V at 94°C PGM utilization (250kPa, 94°C) kW/gPGM 8.1 9.5 14.3 - >9.1 mV loss at Catalyst cycling (0.6-1.0V, 30k cycles) 30 20 TBD 500 >500 TBD 0.67 V at 94°C) and Pt-loading targets. 6 Maintain high kinetic mass activities. 4 Project period 2013 2014 2015 2016 2017 2018 2019 2020 Mitigate catalyst HCD degradation. Year 2.2x kW/gPGM vs preproject by reducing resistance in micropores.
Approach: Basic Approaches: Will Succeed if At Least One Works Improve O2 Transport with New Carbon Support GM/CMU/ Cornell/NREL Use low-loaded-electrode (
Approach:
 Milestones and Go/No Go
TASK 1 - Development of Highly-Accessible Pt Catalysts
Go/No-go criteria: >1.0 W/cm2, >8 kWrated/gPt, and Q/ΔT 0.44 A/mgPGM, 1.1 W/cm2, >9.1 kWrated/gPt, and Q/ΔT
Collaborations: Project Team General Motors (industry) Overall project guidance, synthesis and testing of catalysts. 3M Company (industry) – Dr. Andrew Haug Not signed Selection and pre-fuel-cell evaluation of ionomer candidates. Not signed Drexel University (university) – Prof. Joshua Snyder Selection and pre-fuel-cell evaluation of ionic liquid candidates. Incorporation strategy of IL into MEA. Cornell University (university) – Prof. David Muller and Prof. Héctor Abruña TEM and tomography. Signed 4/2017 Synthesis of intermetallic alloys. Carnegie Mellon University (university) – Prof. Shawn Litster Signed 3/2017 Modeling and X-ray tomography. Signed 8/2016 National Renewable Energy Lab (federal) – Dr. K.C. Neyerlin Support N-doping, MEA fabrication and diagnostics. Non-funded Partners 6 catalyst suppliers (industry) Provide benchmark and experimental samples. Idea exchange. Argonne National Lab (federal) – Drs. Ross Andrews, Nancy Kariuki, Debbie Myers SAXS measurement at APS (beamline 9ID), Contract No. DE-AC02-06CH11357. 7
Responses to Last Year AMR Reviewers’ Comments • “catalyst development should be stressed, not just its integration and electrode layer performance”, “does not seem appropriate for a catalysis development project” First, note that the project is under “Catalysts and Electrodes” section. Therefore, it should be no surprise that there is a significant level of electrode evaluation. DOE and the community realize it is the electrode performance that matters after all. Additionally, Catalyst Targets had been met but Electrode Targets had not. That being said it can be seen in this update that there is a significant catalyst-level work, as every new carbon support requires a different approach in making a good catalyst. • “hard to see what the new development is” “new materials and diagnostics” Please see Summary for key achievements. • “needs to … resolve the issues of stability of Co” “how to optimize the physicochemical properties of nanoparticles for activity and stability” Although we cannot entirely prevent cobalt from dissolving, this year we studied the Pt and Co dissolution and deposition rate, and the impact of cobalt on performance. They will help us more intelligently design and operate the fuel cell. • “stability of ionic liquid is unclear” This remains an issue of interest and we will address this in near future. We should also note that the project achievement does not rely on a successful implementation of ionic liquid alone. • “a catalyst manufacturer should be included in the initial stage of the project” Indeed, OEM privilege allows us to involve several catalyst suppliers (non-funded) while protecting their confidentiality. 8
Technical Accomplishment: Carbon Support Development: Methodology Development Flow Carbon Surface Area BET Supplier carbon Macropore size Porosimetry Surface modification Porous carbon Micropore BJH Pt/carbon Graphitization Raman Co impregnation, heat treatment HSC MSC GrCB/GrCNT PtCo/carbon Ketjen, Acetylene, Vulcan, Graphitized CB, CNT, Graphene, Engineered carbon, Mesoporous carbon, etc. Acid treat, other modification Final catalyst Porous carbon Solid carbon Ink making, electrode coating/ design HSC MSC (Vulcan) (Not our focus) Electrode Attempt to find carbon with good balance of high surface area, porosity, and graphitization. Porous vs solid carbon is one focus. For every carbon type, adjustments of procedure must be made. No one fits all. High Pt dispersion Good O2/proton transport Collaborate with support and catalyst suppliers at High ORR activity Better stability several stages. Easy to make good alloy 9
Technical Accomplishment: Carbon Support Development: Pt/C Local O2 resistance and ORR Activity Pore Size Distribution of Carbon Powder MEA differential cell tests of Pt supported on different carbons BET-BJH 20 5 cm single cells 0.5 2 2.0 KB AB AB Vu 1.8 Local Resistance (s/cm) 20 wt% Pt/C ORR Activity (A/mgPt) 0.4 1.6 15 Vads, ml/gcarbon, 77K 1.4 0.3 1.2 HSC-a 10 1.0 HSC-c 0.2 0.8 GrC-e 5 0.6 0.1 0.4 0.2 MSC-a 0 0 0.0 1 10 100 Pore diameter, nm Differential cell tests for ‘local O2 resistance’ and ‘ORR mass activity’ have shown to be reliable predictors for MEA performance. Porosity measurement on ‘final electrode’ does not give good correlation with MEA performance. Rather, the pore size distribution on carbon or catalyst powder gives better correlation. Want less micropores (5-50 nm), confirming resistance local to Pt particles. ORR activity drops 3-fold if all small pores are removed. Likely because of ionomer poisoning effect. Unless Ionomer-Pt interaction is solved, may not want an all solid carbon. Want small pores but with good accessibility. See back-up slides for more details on carbon characterization 10
Technical Accomplishment: New PtCo/HSC Surpassed High-Power Targets 31% Increase in Power over Baseline PtCo 124% Increase in PGM Utilization PtCo/HSC-f, 2017, 0.06 mg-Pt/cm2 over pre-project 0.85 PtCo/HSC-e, 2017, 0.10 mg-Pt/cm2 16 PtCo/HSC-a, 2016, 0.10 mg-Pt/cm2 HSC-type, 150kPa PtCo/MSC-a, 2017, 0.10 mg-Pt/cm2 HSC-type, 250kPa (0.025, 0.063) 14 MSC-type, 150kPa Power (kW/gPGM) MSC-type, 250kPa Voltage (V) 12 0.75 Ca Pt loading 10 (0.025, 0.10) Project target 250kPa Heat rejection limit, 0.67 V (mgPt/cm2) (0.025, 0.10) 31% 0.063 8 DOE target 150kPa 0.65 0.10 6 (0.050, 0.10) Average of >3 MEAs, standard deviation < 20 mV Q/ΔT = 1.45 (0.67 V at 94°C) 0.10 4 H2/air, 250 kPa, 94°C, 65%RHin, stoich 1.5/2 50 cm2 single cells 0.10 2013 2014 2015 2016 2017 2018 2019 2020 0.55 0 0.5 1 1.5 2 Year Current Density (A/cm²) Large improvement at high current density (HCD) with new HSC, thanks to more accessible pores, hence lower local transport 31% Increase in Power Density resistance. 1.3 Surpassed DOE kW/gPGM target by a large margin (10.6 vs 8). Power Density (W/cm2) 1.2 Project target 250kPa Sent to NREL for validation. 1.1 DOE target 150kPa 1 Approaching Power Density 150kPa target, but to achieve this, 0.9 need advancement in other areas: ORR activity, GDL/plate O2 transport, 0.8 and membrane resistance. Electrode transport alone not enough. Q/ΔT = 1.45 (0.67 V at 94°C) 0.7 2013 2014 2015 2016 2017 2018 2019 2020 Solid carbon performance (gray symbols on right plots) suffers from Year lower ORR activity and alloy quality, consistent with Pt/C results. 11 Gray symbols: best PtCo/Solid carbon
Technical Accomplishment: Accelerated Stability Tests on Pt Catalyst AST Representing normal operation (0.60-0.95 V, 6 s/cycle, 30,000 cycles) H2/air, 94°C, 250/250 kPaabs,out, 65/65% RHin, st=1.5/2 100 0.6 BOL 90 0.5 ORR Mass Activity 80 ECSA (m2/gPt) 70 0.4 Voltage 10k (A/mgPt) 60 30k 50 0.3 40 30 0.2 20 0.1 50 cm2 single cells 10 0 0 Current Density HSC-a HSC-b HSC-c MSC-a GrC-b GrC-e HSC-a HSC-b HSC-c MSC-a GrC-b GrC-e Support AST Representing lots of very unusual operation (1.0-1.5 V, 0.5 V/s, 5,000 cycles) 0.8 5000 BOL 100 500 0.7 Voltage at 1.5 A/cm2 (V) 0.6 42 mV loss 0.5 0.4 0.3 50 cm2 single cells 0.2 H2/air, 80°C, 150 kPaabs,out, 40% RHin, st=1.5/1.8 0.1 0 HSC-a HSC-c MSC-a GrC-b GrC-c HSC shows better initial ECSA, ORR activity, and fuel cell performance. In Catalyst-AST, retention of ORR activity and fuel cell performance were better for HSC. Similar trend with PtCo. In Support-AST, most carbons failed miserably. HSC degraded the fastest. GrC-e surprisingly held up close to target (42 vs
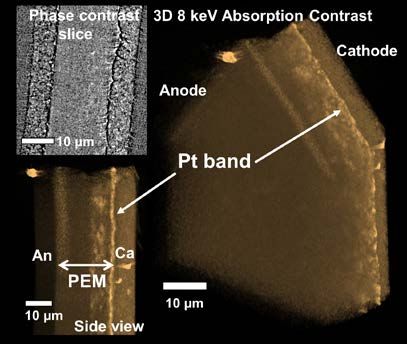
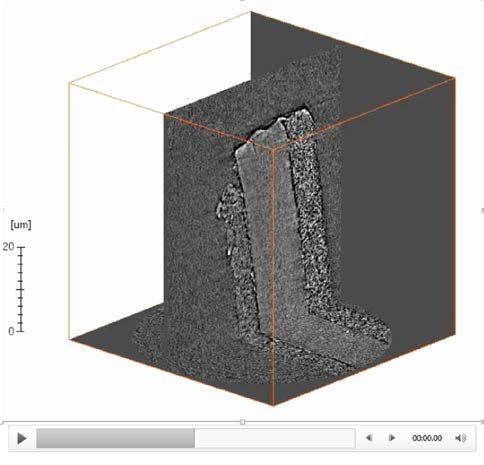
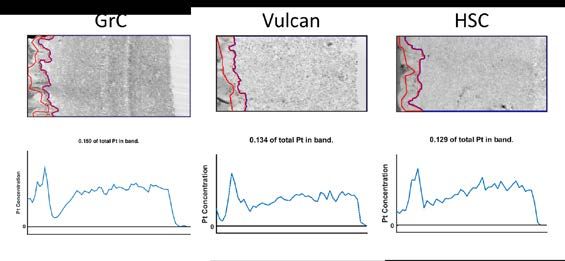
Technical Accomplishment: Postmortem Analyses TEM X-CT SAXS EPMA Pt Band by TEM and EPMA ICP 20 Pt and Co Depletion in Cathode by TEM Redeposited Pt in 15 membrane, % cathode PEM 10 PEM 5 EPMA TEM-EDS cathode 0 Pt/HSC Pt/V Pt/GrC-b PtCo/HSC Pt Depletion in Cathode by X-CT Zernike phase contrast Pt band Pt/V Fresh cathode Pt depletion Carbon type has negligible effect on how Pt degrades at a macroscopic scale. Expected as Pt dissolution and migration dominate, not coalescence. Will be using these data to refine degradation model. 13
Technical Accomplishment: PtCo Particles Coalesced Less on HSC Support PtCo/HSC after AST PtCo/Vu after AST 27% vs 39% drop in ECSA 4533 vs 3320 m2/gPt This work Xin et al. Nano Lett. (2012), 490. Pt losses at the macroscopic level (formation of Pt band, changes in Pt amount across the electrode thickness) are similar among different carbon supports. However, at microscopic level, EELS composition maps show that coalesced (multi-core) PtCo particles appear rarely on HSC carbon support compared to Vulcan carbon support. The high surface area and confining pores of HSC appear to suppress particle coalescence. Agrees with electrochemical results. May not want an all solid carbon. Want small pores but with good accessibility. 14
Technical Accomplishment: New Capability: Quantify Inside & Outside Pt Particles CO Stripping in MEA CO stripping in MEA was found to give a good correlation with cryo-STEM results for determining the location of Pt (inside and outside of carbon particles) This can become a simple routine measurement for every MEA sample. 15 Padgett et al. (2017) submitted.
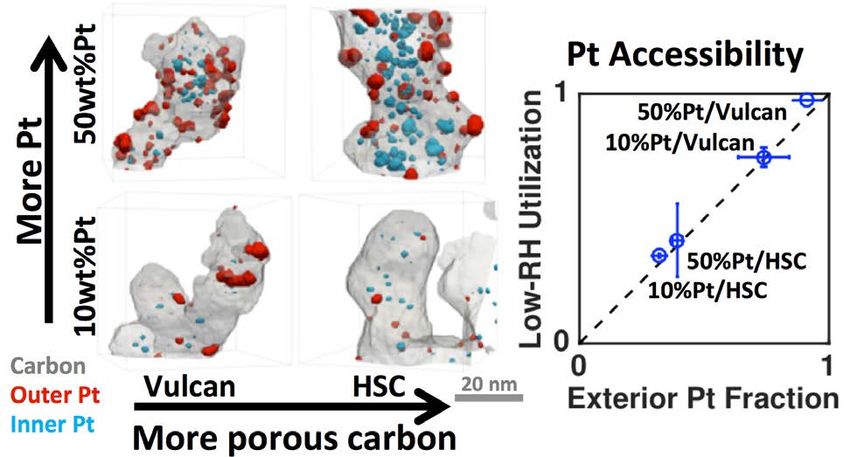
Technical Accomplishment: Pt Location as HSC Catalyst Ages Local Catalyst Site Electrochemical Pt Utilization 1.2 1 Pt Utilization 0.8 30k 10k 0.6 BOL 0.4 0.2 Pt/HSC-a 0 0 20 40 60 80 100 RH (%) Pt2+ concentration Transport and surface reactions • Oxide coverage & oxygen reduction • H+ & O2 transport • Pt & Co dissolution and transport • Pt redeposition Pt utilization appears to improve after AST for Pt and PtCo on HSCs, suggesting increase in the fraction of outer Pt particles. Being studied by TEM tomography (Cornell) and modeling (CMU). Preliminary simulation at CMU suggests the confined morphology of pore filled water and ionomer may play a role as well as the difference in particle size distribution of outer vs inner particles. 16
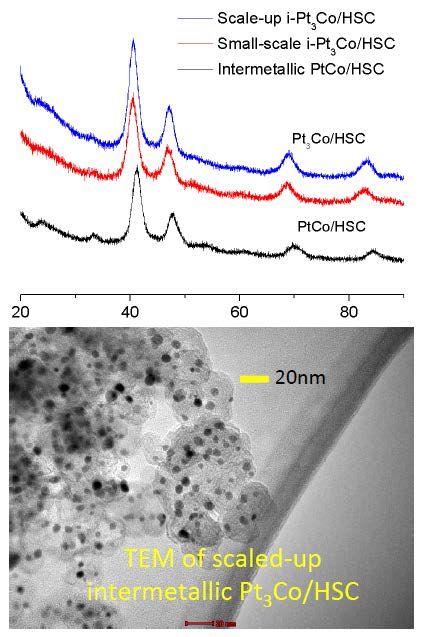
Technical Accomplishment: Improving ECSA and Stability with Intermetallic PtCo XRD of intermetallic Pt3Co and PtCo superlattice Scaled-up i-Pt3Co/HSC Small-batch i-Pt3Co/HSC Small-batch i-PtCo/HSC 2θ (°) RDE mass activity of 0.65 A/mgPt for intermetallic-Pt3Co/HSC. Developed procedure for scale up. Achieved equivalent ordered crystalline quality and RDE activity in scaled up samples. Developed chloride-free catalyst and scaled up to 3 grams. To be tested in MEA at GM as soon as contract is signed. 17
Technical Accomplishment: Ionic Liquid Boosts ORR Activity RDE MEA 0.8 Ionic Liquid IL ORR Mass Activity (A/mgPt) 0.7 0.6 0.5 0.4 IL 0.3 wt.% IL 0.2 7 0 4 0.1 0 Pt/V PtCo/HSC Pt/V Confirmed ORR activity boost with preferred PtCo/HSC catalyst in RDE. Scaled up IL-composite catalyst synthesis to >1 gram batch size. So far, in MEA observed 1.3x improvement in ORR activity with 7 wt% IL, smaller than RDE (2-3x). MEA may require much higher IL loading than RDE. Next Develop method to quantify IL in electrode. Optimize IL loading, implement on PtCo, investigate the operating condition sensitivity and electrode stability. Qualification of different IL chemistries including aprotic formulations and assessment of their half-cell ORR activity. 18
Technical Accomplishment:
 Ionomer Screening
 Proton Conductivity
 y
 O2 Permeability
 1
 90%RH

 50%RH

 25%RH
 Corrected Conductivity (S/cm)

 0.1

 0.01 50% RH

 PFSA
 PFIA
 PFSA
 0.001
 400 500 600 700 800 900 1000 1100 20% RH
 EW

 q 3M PFSA and PFIA ionomers with EW of ~700, 800, 1000 were studied for their O2 permeability and
 proton conductivity.
 q O2 permeability reduces as EW increases.
 q PFIA doesn’t seem to follow this trend. Raises the question of the backbone vs. sidechain contributions
 to O2 permeability.
 q Ionomer coated Pt RDE is being studied for ionomer-Pt interaction.
 q MEAs with different ionomers and Pt loadings were prepared and shipped to NREL and GM.
 q MEA diagnostics focusing on local O2 transport are being done at NREL in collaboration with FCPAD.
 GM will then integrate with other MEA components.

 19
Technical Accomplishment: Quantifying Pt and Co Losses Potential Hold Cycling, LPL Cycling, UPL >60 hr >50k cycles >50k cycles PtCo GDE immersed in 0.5 H2SO4. Dissolved Pt and Co were monitored under a number of potentiodynamic and potentiostatic conditions. Rate parameters and model are being developed to estimate degradation rates. 20
Technical Accomplishment: Effects of Dissolved Cobalt: Design Guideline Cobalt distribution across MEA Simulated V Loss 0.10 V Loss to Undoped Electrode anode membrane cathode 0.09 1 20% H2/air, 80°C, 150 kPa, stoich 1.5/1.8, 40% RHinlet Proton site occupied by Co2+ 0.9 2 A/cm2 0.08 0.8 [Co2+] = 5% 0.07 0.7 0.06 1.5 15% [Co2+] (V) 0.6 0.05 10% 8% 0.5 0.04 0.4 5% 1 0.03 0.3 0.02 3% 0.2 0.5 0.01 0.1 0.1 H2/air, 80°C, 150 kPa, stoich 1.5/1.8, 40% RHinlet 0.00 0 0.8 1 1.2 1.4 1.6 1.8 2 0 5 10 15 20 25 30 35 Distance from anode DM/CL interface (μm) Current Density (A/cm2) Addition of analytical equation to simulate cobalt behavior in the electrodes to further resolve the voltage losses. Simulated various conditions to determine allowable Provide guidelines for determining: Operating condition: T, RH, P, current density. cobalt amount for a given criteria to provide guideline Co/Pt ratio for MEA design. (e.g. 0.1 mgPt/cm2 Pt3Co will be 3-8% [Co2+]) Pt loading Transient and dynamic operation strategy Still several fundamental questions left unanswered regarding observed higher-than-expected proton resistivity and unaccounted-for water transport. 21
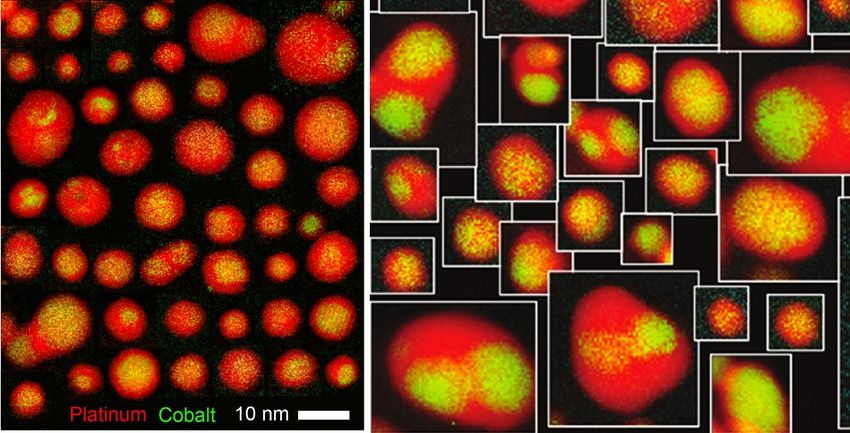
Technical Accomplishment: New Capability: MEA Preparation from mg of Catalyst a) b) a) 60 SOA USC VF funnel 50 ECSA (m2/gPt) ultrasonic 40 nozzle GDL sand core filter 30 vacuum 20 10 collecting bottle 0 GDL 0 10k 30k b) 0.5 SOA USC VF Mass Activity (A/mgPt) 0.4 0.3 0.2 0.1 0 0 10k 30k Number of voltage cycles Developed two procedures to coat fuel cell electrodes from 30 mg of catalyst powder (same amount as an RDE ink). Observed reasonable coating quality and fuel cell performance. Expedite learning cycles. No scale-up required. 22 Yarlagadda et al. (2017) submitted.
Future Work: Future Work until 6/2017 7/2017 ~ 6/2018 Select ~3 support candidates for PtCo Optimize PtCo deposition on selected carbons. integration in the 2nd year. Most likely one with Better PSD, alloy quality and smaller particle size. the best performance, one with the best Evaluate durability. durability, and one with a balanced Implement intermetallic alloy if proven beneficial. performance. Integrate/Evaluate ionomer/ionic liquid. Focus on Evaluate activity/stability of intermetallic PtCo in stability. MEA. Study local transport losses, using MEA Study the loading/stability of ionic liquid in MEA. diagnostics, tomography, and modeling. Develop nano-mesostructure performance Develop cobalt fundamental model and PtCo model for baseline PtCo/HSC. Identify dissolution model. Explore methods to visualize understanding gaps for cobalt model. Co2+ distribution during operation. Voltage Loss Update model with advanced ionomer/ionic liquid ηlocal-Pt 0.01 V at 2 A/cm2 properties. Further HCD advance relies on ORR activity ηORR See back-up slide 0.37 V Any proposed future work is subject to change based on funding levels. 23
Summary Differential cell tests for ‘local resistance’ and ‘ORR mass activity’ have shown to be reliable predictors for MEA performance. Catalysts with high carbon surface area and large amount of micropore (e.g. HSC) tend to have higher ORR activity, higher stability under normal operation, but also higher local transport loss. Made significant progress in reducing resistance in carbon micropores (RO2micro, RH+micro) while maintaining high ORR activity. Will/can these be as durable as baseline PtCo/HSC? Promising early results with intermetallic PtCo and ionic liquid. Expect faster progress once subcontracts are signed. Improved understanding of the performance tolerance to dissolved cobalt. 2.2x kW/gPGM New Key Capabilities 30% less Pt MEA preparation from small amount of catalyst powder 12 New in-situ MEA diagnostics Q/ΔT = 1.45 (0.67 V at 94°C) Power (kW/gPGM) Pt-ionomer interaction by CO displacement 10 Pt location by CO stripping DOE target 150kPa Co2+ model and MEA design guideline 8 Model with nano/meso morphology consideration 6 Project period 4 6 articles, 18 talks (5 invited), 1 patent application 2013 2014 2015 2016 2017 2018 2019 2020 Year 24
Acknowledgements
DOE 3M
 – Greg Kleen (Program Manager) – Dr. Andrew Haug (sub-PI)
 – Bahman Habibzadeh (Technology Manager) – Matthew Lindell
 – Shaun Onorato – Tyler Matthews
General Motors Carnegie Mellon University
 – Aida Rodrigues, Yevita Brown, Charles Gough – Prof. Shawn Litster (sub-PI)
 (Contract Managers) – Shohei Ogawa
 – Venkata Yarlagadda – Jonathan Braaten
 – Michael K. Carpenter Cornell University
 – Yun Cai – Prof. David A. Muller (sub-PI)
 – Thomas E. Moylan – Prof. Héctor Abruña
 – Joseph M. Ziegelbauer – Elliot Padgett
 – Ratandeep Singh Kukreja – Barnaby Levin
 – Taylor Garrick (Univ South Carolina) – Yin Xiong
 – Wenbin Gu – Yao Yang
 – Srikanth Arisetty Drexel University
 – Roland Koestner – Prof. Joshua Snyder (sub-PI)
 – Cristin L. Keary – Yawei Li
 – Qiang Li and team NREL
 – Peter Harvey and team – Dr. K.C. Neyerlin (sub-PI)
 – Sonam Patel, Kathryn Stevick and team – Jason Christ
 – Tim Fuller – Shaun Alia
 – Shruti Gondikar – Jason Zack
 – Mohammed Atwan – Shyam Kocha
 – Nagappan Ramaswamy – Bryan Pivovar
 – Dave Masten ANL / APS
 – Swami Kumaraguru – Dr. Deborah J. Myers
 – Craig Gittleman – Dr. Nancy N. Kariuki
 – Mark F. Mathias – Dr. Ross N. Andrews (beamline 9ID)
Technical Back-Up Slides

 26
Technical Accomplishment: Carbon Support Development: Pt/C Catalyst Powder and Electrode Properties Powder Electrode Pt Surface Electrode Pore Avg pore Pt Loading ECSA accessibility Carbon type area thickness volume, 2 size (nm) (mg/cm2) (m2/gPt) under dry (m /gC) (μm) ml/gC condition HSC-a, Ketjen EC300J 780 7.9 0.056 7.6 ± 0.5 2.9 81 ± 1.4 35% HSC-b, Acetylene Black 770 6.7 0.061 8.8 ± 0.9 3.1 80 ± 5.0 49% HSC-c, Acetylene Black 750 7.0 0.063 9.0 ± 0.4 3.1 58.5 ± 0.7 52% HSC-d 800 0.048 6.1 ± 0.7 2.7 73.3 ± 4.1 42% HSC-e 800 0.060 7.0 ± 0.7 2.4 48.7 ± 1.5 61% MSC-a, Vulcan XC72 230 13.6 0.062 5.6 ± 0.5 1.8 67.5 ± 4.9 95% GrC-a 170 25.4 0.062 6.6 ± 0.5 2.2 52 ± 0 97% GrC-b 150 0.065 7.4 ± 0.3 2.3 66.5 ± 2.1 92% GrC-e 80 14.6 0.064 4.9 ± 0.2 1.4 61 ± 1.0 98% CNT-a 1000 0.060 7.3 ± 1.1 2.5 54.5 ± 0.7 Porosity measurement on ‘final electrode’ does not give good correlation with MEA performance. Rather, the pore size distribution on carbon or catalyst powder gives better correlation. Want less micropores (5-50 nm), confirming resistance local to Pt particles. 27
Technical Accomplishment:
 Fuel Cell Performance at Different Conditions
 94°C, 250 kPa 94°C, 150 kPa
 0.9 0.9
 PtCo/HSC-f, 2017, 0.06 mg-Pt/cm2 PtCo/HSC-f, 2017, 0.06 mg-Pt/cm2
 PtCo/HSC-e, 2017, 0.10 mg-Pt/cm2
 PtCo/HSC-e, 2017, 0.10 mg-Pt/cm2
 0.8 PtCo/HSC-a, 2016, 0.10 mg-Pt/cm2 0.8
 PtCo/MSC-a, 2017, 0.10 mg-Pt/cm2 PtCo/HSC-a, 2016, 0.10 mg-Pt/cm2

 Voltage (V)
 Voltage (V)

 0.7 0.7

 Heat rejection limit, 0.67 V
 0.6 0.6

 0.5 0.5

 H2/air, 250 kPa, 94°C, 65%RHin, stoich 1.5/2 H2/air, 150 kPa, 94°C, 70%RHin, stoich 2/2.5
 0.4 0.4
 0 0.5 1 1.5 2 0 0.5 1 1.5 2
 Current Density (A/cm²) Current Density (A/cm²)

 80°C, 150 kPa (DOE)
DOE heat rejection requirement (Q/ΔT)

 ×(1.25 − 9:;
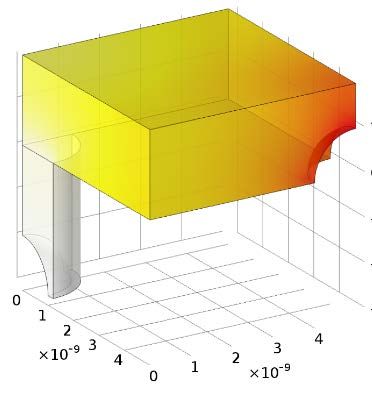
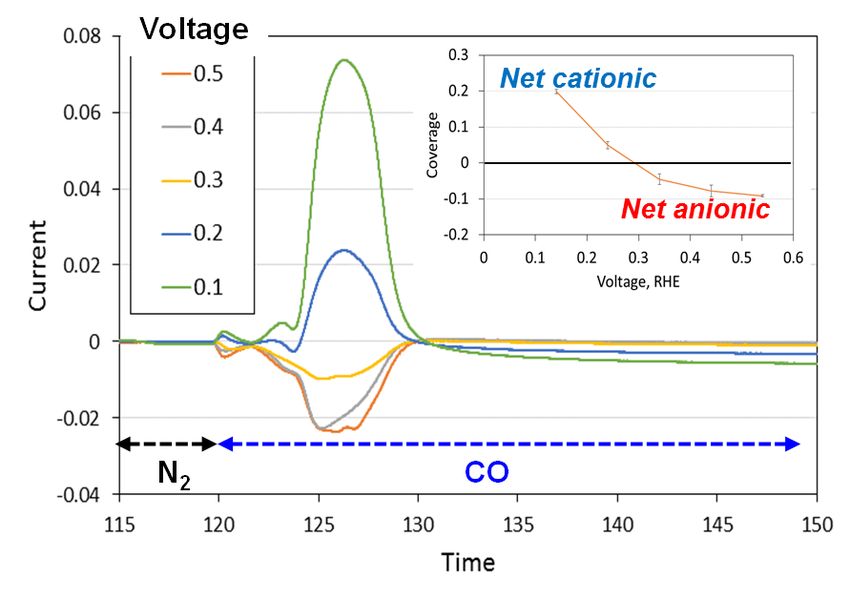
Technical Accomplishment: Pt-Electrolyte Interaction: Measuring Ionomer Coverage in-situ CO displacement 1.9 20 Nomalized ORR Activity and Pt–C + CO → Pt–CO + C+ + e− Ionomer Charge Coverage 1.6 15 Local O2 Transport (s/cm) Pt–A + CO + e− → Pt–CO + A− qdisplacement = qfree charge - qinitial 1.3 10 A— A— 1 5 CO CO CO CO CO CO A A CO, e— Wet Dry Wet Dry Wet 0.7 0 Pt 0 1 2 3 4 Test Time (days) MEA Current-Time Response as CO is Introduced Followed original concept used by Clavilier and Feliu on single crystals [J. Electroanal. Chem. (1992) 489]. Validated on poly-Pt and Pt/C, then developed into in-situ MEA diagnostic. Enable quantification of adsorbed species in MEA in the potential range of 0.1-0.55 V. Demonstrated that CO displacement charge (ionomer adsorption) correlates with fuel cell performance. Will be used to quantify adsorption behavior of different type of ionomers, and any changes as they are aged. Kongkanand et al. ECS Trans. (2016) 75, 25. 29 Garrick et al. J. Electrochem. Soc. (2016) 164, F60.
Future work: Further Improvement at High Power 0.8 Voltage Loss Contributors 0.1 mgPt/cm2 1.7 at 2 A/cm2 (0.1 mgPt/cm2) 0.75 1.6 ηACL ηΩ,memb+contact ηlocal-Pt 0.06 V 0.7 0.01 V Voltage (V) 1.5 Q/ΔTi ηO2,CCL Local transport ORR activity 0.00 V 0.65 1.4 ηO2,GDL+plate 0.02 V 0.6 SOA PtCo/HSC ηORR 1.3 Model 10 s/cm 0.37 V Model 0 s/cm ηproton, CCL Model 10 s/cm, 2x ORR 0.55 1.2 0.01 1.2 1.4 1.6 1.8 2 2.2 Current Density (A/cm²) 0.10 mgPt/cm2 PtCo/HSC: H2/air, 94°C, 250/250 kPaabs,out, 65/65% RHin, st=1.5/2 For a 0.1 mgPt/cm2 cathode, most gain is obtained with local-Pt resistance of 10 s/cm. For lower Pt loading, more gain from local transport can be obtained. Must also work on other issues. Within ‘catalyst & electrode’, ORR activity is the largest. In this project, ordered intermetallic alloy and ionic liquid are promising approaches. 30 Any proposed future work is subject to change based on funding levels.
FC087 2011-2014
 Exceptional Durability of ORR Activity with Dealloyed
 PtNi/HSC and PtCo/HSC

 Energy Environ. Sci., 2014.
 DOE Final Report, 2014. https://www.osti.gov/scitech/biblio/1262711

• Meeting DOE ORR durability in MEA. Validated at multiple sites.
• Durable ORR kinetic in stack testing.
• Need thicker Pt shell for MEA stability (>4ML). Optimization point is very different from RDE.

 31
You can also read