Housing and Mortgage Market Review

Page created by Edith Hayes
 
CONTINUE READING
Housing and Mortgage Market Review
Housing and Mortgage
Market Review
HaMMR – Issue 2-2022

          I N TH I S I S S U E

  Catching up on an Eventful

                                                 Catching up on an Eventful
  First Quarter ........................... 1
  Are Demographics Destiny? .... 8
  Donuts in Housing Aren’t
  Just a Realtor Treat................ 14        First Quarter
                                                 by Parker Ross,
  Housing and Mortgage
                                                 Senior Vice President, Chief Economist, Arch Capital Services LLC
  Market Indicators .................. 18
  State Housing and
  Demographic Trends ............ 24             The housing market entered 2022 on solid footing with demand far outstripping

  Housing and Demographic                        supply, near record-low mortgage rates and double-digit home-price growth.
  Trends for the 100 Largest
  MSAs .................................... 26   Housing market outlooks from the beginning of the year, including our own,
                                                 generally expected interest rates to gradually trend higher and home-price
           CONTRIBUTORS
                                                 appreciation to slow. At the time, given demographic and work-from-home
                Parker Ross
                                                 tailwinds, as well as the strong economic backdrop, it was difficult to pinpoint
          Senior Vice President
            Chief Economist                      what could slow the market’s momentum outside of the building headwind of
        Arch Capital Services LLC                affordability constraints. However, as the year has progressed, new risks began to
             Marisa Rawling                      emerge that exacerbated some of the pre-existing upward pressure on inflation
    Senior Manager, Content Team                 and interest rates.
  Arch Mortgage Insurance Company

         Tomaseena Auzenne                       First, the Russian invasion of Ukraine resulted in severe disruptions to food and
      Senior Multimedia Designer                 commodity production as well as supply chains more generally. Next, a significant
  Arch Mortgage Insurance Company
                                                 COVID-19 outbreak in China resulted in some of the pandemic’s most extensive
                                                 lockdowns to date in critical port cities. Both events have lifted actual and expected
                                                 inflation and in turn prompted a more aggressive response from the Federal
                                                 Reserve (the Fed).

                                                                                                                     (continued on page 3)

                                                                                                  Arch Mortgage Insurance Company | 1
Housing and Mortgage Market Review
Catching up on an Eventful First Quarter (continued from page 1)
Already, the upper bound of the target range for the federal funds rate has been lifted to 1%, which was roughly where
markets at the start of the year expected it to be by the end of 2022. Markets now expect the Fed to lift its policy rate near
3% by year-end, which would be the most aggressive hiking cycle in decades. Given the sharp increase in rate hike and
inflation expectations, 10-year U.S. Treasury yields have roughly doubled from about 1.5% at the end of 2021 to around 3%
in May.

Mortgage rates have climbed higher even more rapidly. The 30-year fixed-rate mortgage started the year at 3.11%,
according to Freddie Mac’s Primary Mortgage Market Survey (PMMS), right in line with the 2021 annual average and not
far removed from the record-low 2021 average of 2.96%. However, mortgage rates have since furiously increased to the
highest level since 2009 — up 69%, or 216 basis points (bps), to 5.27% as of May 5 and up 78% from one year prior, by far the
largest relative annual increase on record (Figure 1).

Figure 1: 30-Year Fixed-Rate Mortgage History

20                                                                                                                                                100%
                                                                  30-Year Fixed-Rate Mortgage (y/y, rhs)        30-Year Fixed-Rate Mortgage (%)
18
                                                                                                                                                  80%

16
                                                                                                                                                  60%
14

12                                                                                                                                                40%

10                                                                                                                                                20%

 8
                                                                                                                                                  0%
 6

                                                                                                                                                  -20%
 4
     Sources: Freddie Mac Primary Mortgage Market Survey (PMMS)/Arch MI
 2                                                                                                                                                -40%
 May-72       May-77     May-82      May-87       May-92      May-97         May-02          May-07          May-12        May-17       May-22

From a longer historical standpoint, prevailing mortgage rates remain low even in the 5% range, but the pace of the
increase certainly provides a “sticker shock” for potential buyers calculating their hypothetical mortgage payments. Using
the March median sale price of an existing home ($375,300), and assuming a 10% down payment, the typical monthly
mortgage payment is up nearly $430 or 30% based on the year-to-date rise in mortgage rates alone. From a year ago
and accounting for the change in the median home price, the monthly mortgage payment is up nearly $620 or 49%. Early
1980, when the federal funds rate had been hiked to more than 19% from around 10% the year prior, is the only period
in history where the combined impact of rising home prices and mortgage rates briefly exceeded the current episode
(Figure 2).

                                                                                                                                  (continued on page 4)

                                                                                                           Arch Mortgage Insurance Company | 3
Housing and Mortgage Market Review

Catching up on an Eventful First Quarter (continued from page 3)
Figure 2: Year-over-Year Change in Mortgage Payment Due to Home Prices and Mortgage Rates

75%                                                                                                                                                         75%
                                                                                        Rate Impact             Price Impact            Combined Impact

50%                                                                                                                                                         50%

25%                                                                                                                                                         25%

 0%                                                                                                                                                         0%

-25%                                                                                                                                                    -25%
   May-72         May-77           May-82     May-87        May-92      May-97        May-02          May-07        May-12          May-17         May-22

   Sources: Freddie Mac PMMS/Arch MI

Home-price growth also surprisingly reaccelerated early this year, as the Standard & Poor’s (S&P) Case-Shiller U.S.
National House Price Index climbed to 21.2% year-over-year through March, up from 18.8% through the end of 2021 and
setting a new record high (Figure 3).

Figure 3: Year-over-Year Home-Price Growth

25%
                FHFA All-Transactions HPI      FHFA Purchase Only HPI      S&P/Case-Shiller U.S. National HPI          S&P/Case-Shiller 20-City Composite
20%

15%

10%

 5%

 0%

 -5%

-10%

-15%

-20%

-25%
       Mar-02       Mar-04           Mar-06    Mar-08         Mar-10     Mar-12         Mar-14          Mar-16         Mar-18         Mar-20          Mar-22
   Sources: FHFA/S&P/Case-Shiller

4 | Arch Mortgage Insurance Company
Housing and Mortgage Market Review
Rate-lock periods have likely protected most homebuyers       There will of course be regional divergences in terms of
from sharply higher rates through the first quarter of 2022   both price and demand trends and one theme worth
and we accordingly expect to see the impact of higher         bearing in mind is the “donut effect” — essentially the
rates begin to materialize over the summer. Additionally,     shift in homebuyer preferences from core city centers to
some of the recent acceleration in home-price growth          suburban and exurban areas. This shift in preferences
was likely related to buyers attempting to secure a home      is likely to continue, as moving further away from core
ahead of rising rates. Although we expect the rapid           job centers — basically enduring a longer commute for
deterioration in affordability to slow home sales and price   more affordable housing — is one of the simplest ways
growth over the remainder of the year, a strong labor         for potential homebuyers to offset some of the rise in
market, attractive demographics and the persistency of        homeownership costs. The predominance of hybrid work
work-from-home flexibility suggest demand will remain         models for office-using jobs limits the burden of longer
rather robust in the years ahead.                             commutes as workers typically only need to go into the
                                                              office a few days per week.

                                                                                                    (continued on page 6)

                                                                                     Arch Mortgage Insurance Company | 5
Housing and Mortgage Market Review

Catching up on an Eventful First Quarter (continued from page 5)
Aside from structural factors driving our near-to-medium          mortgage rate for current homeowners is in the low 3%
term housing outlook, a near-record-low level of homes for        range and thus home sellers would need to finance their
sale suggest that home-price growth will remain positive          new home at a much higher prevailing rate. One caveat to
going forward. The stock of existing homes for sale ended         the second point is that retirees, whose numbers are on the
2021 at about 1 million units (seasonally adjusted) and           upswing, are generally less rate-sensitive as they typically
remains around that level in April. It would take 2.1 months      are able to purchase homes with cash from the sale of a
to sell the current inventory of homes for sale at the current    prior home or retirement savings.
pace of sales (5.61 million seasonally adjusted annualized
rate), up slightly from 2.0 months at the end of 2021 but still   The new-home construction market is unlikely to help
well shy of the roughly five months’ supply representative        alleviate the broader housing shortage this year as
of a balanced market. Starkly stated, the inventory of            homebuilders continue to face numerous challenges.
homes available for sale would need nearly 1.2 million            Labor and material shortages remain top concerns for
additional units to reach a balanced state, more than             builders while balancing their ever-growing backlog
double the current level.                                         of uncompleted inventory (Figure 4). So far, builders
                                                                  have been able to pass on rising costs to homebuyers
As we mentioned above, higher rates should lead to a              with few signs that cancellation rates are about to head
moderation in the pace of home sales, which should also           meaningfully higher. The months’ supply of completed new
allow inventory levels to gradually rise over the year.           homes is just 2.8 months as of April, well below the typical
Two potential headwinds for this scenario include 1) the          pre-pandemic balanced market average of roughly 4
negative feedback loop of potential home sellers being            months. Much like with existing homes, some easing of
reluctant to list their homes due to the limited inventory of     demand will help bring the new-home sales market back
homes they could purchase and 2) the fact that the typical        toward balance by the end of year.

6 | Arch Mortgage Insurance Company
Housing and Mortgage Market Review
Figure 4: New Construction Activity by Stage of Construction

2,300                                                                                                                                                          1,700
                                         New Housing Units Completed (12m total, 000s)            New Housing Units under Construction (000s, saar, rhs)
2,100
                                                                                                                                                               1,500
1,900
                                                                                                                                                               1,300
1,700

1,500                                                                                                                                                          1,100

1,300
                                                                                                                                                               900

1,100
                                                                                                                                                               700
 900

                                                                                                                                                               500
 700

 500                                                                                                                                                           300
   Mar-72       Mar-77      Mar-82        Mar-87          Mar-92         Mar-97          Mar-02       Mar-07          Mar-12          Mar-17          Mar-22

   Sources: U.S. Census Bureau/Arch MI

Overall, the housing market is well-positioned to weather the headwinds building on the horizon, given structurally sound
underlying demand and responsible underwriting standards. Although we do expect some easing on the demand side,
this would be beneficial to the long-term health of the market and bring some balance, allowing supply to begin catching
up to demand.

                                                                                                                Arch Mortgage Insurance Company | 7
Housing and Mortgage Market Review

Are Demographics Destiny?
A question that we often get is “how much was housing                                 retirement age is around 62 years old, we looked at the
demand pulled forward by the pandemic?” The                                           number of people turning 66 each year to allow for some
question alludes to a hypothesis that the recent surge in                             settling-in time between typical retirement age and
homebuying was temporary and that the pace of sales                                   a home-sale transaction.
will soon slump to below the pre-pandemic pace as
                                                                                      According to the National Association of REALTORS®
buyers who would have otherwise purchased a home
                                                                                      (NAR), half of homebuyers over the age of 66 cited
in 2022 instead made their move during the pandemic.
                                                                                      either moving closer to friends or family, downsizing or
Based on our analysis, we find that there was only
                                                                                      retirement as the primary reason for their home purchase
a modest amount of demand pulled forward by the
                                                                                      in 2021, compared to 5% or less citing the same reasons
pandemic.
                                                                                      for homebuyers under the age of 40. Instead, more than
To answer this question, we first need to establish an                                half of under-40 homebuyers cited either a desire to own
underlying, sustainable level of demand that isn’t                                    their home, a life event (e.g., marriage, birth of a child) or
impacted by cyclical or market factors. When thinking                                 a job relocation as the primary reason for buying a home.
about a sustainable level of demand for existing homes,                               This age group includes most first-time homebuyers, who
it is important to consider long-term trends that would                               are typically in their young 30s. As a proxy to capture this
prompt 1) a current homeowner to sell a home and 2) a                                 key demographic, we considered the number of people
renter to become a first-time homebuyer.                                              turning 33 each year.

As a proxy for the first category, we suggest                                         Looking first at the younger of these two key age groups
considering the demographic with the highest share of                                 for existing home sales, we see that the 33-year-old
homeownership approaching a big life event: recent                                    cohort was generally trending down after peaking in
retirees. The homeownership rate for households headed                                the mid-1990s to a trough around 2007–2009 (Figure 5).
by someone over the age of 65 averaged nearly 80%                                     Since bottoming around the peak of the housing crisis, the
over the past year, so any recent retirees looking to move                            33-year-old cohort has surged higher and just reached
would likely prompt a home sale. While the average                                    4.5 million in 2021, matching the prior peak from the mid-

Figure 5: Historical and Projected Key Age Cohort

               66-Year-Old Population (000s)           Projection: 66-Year-Old Population (000s)
5,500
               33-Year-Old Population (000s)           Projection: 33-Year-Old Population (000s)
5,000

4,500

4,000

3,500

3,000

2,500

2,000

1,500
        1980    1985     1990       1995       2000   2005     2010       2015      2020      2025   2030   2035   2040   2045    2050   2055    2060

        Sources: U.S. Census Bureau/Arch MI

8 | Arch Mortgage Insurance Company
Housing and Mortgage Market Review
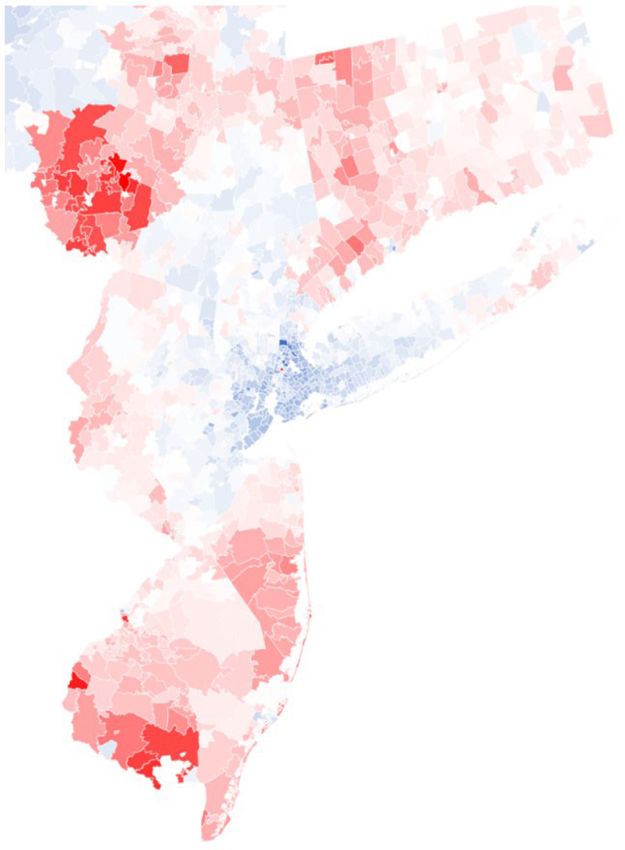
1990s. Going forward, the number of Millennials turning 33 each year is expected to continue climbing and stabilize in the
high 4 million to low 5 million range.

At the other end of the spectrum, the 66-year-old cohort was relatively small in comparison to the 33-year-old cohort
from 1980 through the early 2000s. Then, the Boomer generation started to reach retirement age en masse in the late
2000s, climbing from roughly 2 million just before the housing crisis to a peak of 3.8 million in 2021. The number of Boomers
reaching retirement age should rise a bit further to the low 4 million range over the next decade, then moderate a bit the
next decade until Millennials arrive in even greater numbers 30 years down the road.

Now that we’ve laid out the demographic backdrop for two key homebuyer groups, another fundamental driver of
existing home sales — and new-home sales for that matter — is the number of people choosing to own a home instead
of renting. Changes in tenure preferences over time is captured by the homeownership rate, which is simply the share
of total households that are owner-occupied. The homeownership rate had climbed from the low 60% range in the early
1990s to a peak of roughly 69% in 2005 just before the housing crisis (Figure 6) as homeownership was made more
accessible by extremely loose mortgage credit standards.

Figure 6: U.S. Homeownership Rate History

70
          U.S. Homeownership Rate (%, NSA)        U.S. Homeownership Rate (%, 4-qtr. avg.)
69

68

67

66

65

64

63

62
Mar-67        Mar-72       Mar-77        Mar-82   Mar-87         Mar-92          Mar-97      Mar-02   Mar-07   Mar-12     Mar-17      Mar-22

Sources: U.S. Census Bureau/Arch MI

As the housing crisis unfolded, mortgage credit tightened quickly, drying up much of the artificial demand created by
the previously loose standards and the homeownership rate declined, almost as rapidly as it had climbed, to a trough
of about 63% by 2016. In the years since, homeownership has experienced a rebound back to just over 65% as of 1Q22,
driven primarily by the two demographic groups we covered above: first-time homebuyers and retirees. Since the trough
in 2016, homeownership has climbed by nearly 4 percentage points among households headed by someone under the
age of 35, about 3 percentage points for the 35–44 cohort, and a bit under 1 percentage point for the 65-and-over cohort
(Figure 7).

                                                                                                                        (continued on page 10)

                                                                                                       Arch Mortgage Insurance Company | 9
Housing and Mortgage Market Review

Are Demographics Destiny? (continued from page 9)
Figure 7: U.S. Homeownership Rate History by Age Cohort

                                    6
                                             Peak-to-Trough           Trough-to-Current      Current vs. Peak
                                    4
% POINT CHANGE IN HOMEOWNERSIHP

                                    2

                                    0

                                   -2

                                   -4

                                   -6

                                   -8

                                  -10

                                  -12
Figure 8: Fundamental Demand Model for Single-Family Existing Home Sales

 7,000
             Single-Family Existing Home Sales (000s, saar)            Model Projection          Historical Demographic Home Sales Model

 6,000

 5,000

 4,000

 3,000

 2,000

 1,000
    Dec-65   Dec-70       Dec-75       Dec-80      Dec-85     Dec-90     Dec-95      Dec-00   Dec-05    Dec-10      Dec-15      Dec-20     Dec-25    Dec-30

                                                                                                                Sources: NAR/U.S. Census Bureau/Arch MI

Interestingly, this simple model suggests that fundamental drivers of single-family existing home sales were already on
the upswing, just as the pandemic arrived. In fact, the model estimate in 1Q20 was within about 30,000 sales, or 0.6%
of total single-family existing home sales. Despite the volatility over the course of the pandemic, the model estimate
was again within about 14,000 sales, or 0.3% of the actual level of sales in 1Q22. In the two years since the pandemic
started, cumulative single-family existing home sales (roughly 10.6 million) have exceeded the fundamental model by
only 250,000, or 2.4%. Stated simply, this suggests that there was only a modest amount of fundamental demand pulled
forward by the pandemic.

Going forward, these fundamentals also suggest that demand for existing homes should remain elevated as Millennials
continue to enter their prime first-time homebuying years and Boomers reaching retirement age continue to trend higher,
even without any further gains in the homeownership rate (which we held flat for illustrative purposes in the projection
below). In fact, the supportive demographic trends from both generations are converging right as the homeownership
rate has seemingly entered a renewed upward trend over the past five years or so.
                                                                                                                                       (continued on page 12)

                                                                                                             Arch Mortgage Insurance Company | 11
Housing and Mortgage Market Review

Are Demographics Destiny? (continued from page 11)
Will Higher Rates Cause the End of the Housing Boom?

The model doesn’t explain all of the variation in sales activity by design and doesn’t account for much of the volatility
around the late 1970s/early 1980s as well as the rise and fall around the mid-2000s housing crisis. This makes sense as
other factors caused housing activity to become detached from fundamentals in these periods. Some of these other
factors, to name a few, could include interest rates, labor market conditions and recent home-price trends.

Taking these in reverse order, it would be reasonable to assume that periods of strong home-price appreciation could
encourage existing homeowners to take advantage of their increased home equity and trade up to a larger home
or better neighborhood. At the other extreme, during periods of outright price declines it would be reasonable for
homeowners to wait out bad market conditions to further pay down principal and hope for a rebound in prices down the
road.

Labor market conditions are fairly self-explanatory: If the economy has entered a recession and unemployment is rising,
there should be less housing turnover and vice versa. Interest rates are more interesting — we could simply consider the
prevailing 30-year fixed-rate mortgage, which presumably would weigh on sales when rising and vice versa. However,
an important consideration is also the difference between the rates that existing homeowners have on their mortgages
and the prevailing 30-year fixed-rate mortgage. Presumably, when the prevailing mortgage rate is meaningfully higher
than the rate most homeowners are paying, as it is now (Figure 9), there should be fewer homeowners looking to sell.

Figure 9: Effective Outstanding Mortgage Rate vs. Prevailing 30-Year Fixed-Rate Mortgage

 20
                                                                      Effective Outstanding Mortgage Rate (%)                 30-Year Fixed-Rate Mortgage (%)
                                                                      Outstanding vs. Prevailing Mortgage Rate (%)
 15

 10
                                                                                                                                            2Q22 Estimate

  5

  0

 -5

-10
  Jun-77       Jun-82         Jun-87        Jun-92         Jun-97             Jun-02            Jun-07               Jun-12           Jun-17           Jun-22
 Sources: U.S. Bureau of Economic Analysis/Freddie Mac PMMS/Arch MI

To illustrate the impact these cyclical factors could have on home sales, we added three variables to the fundamental
demand model: annual home-price appreciation, the national unemployment rate and the difference between rates on
existing homeowner mortgages and the prevailing 30-year mortgage rate. The results were significant and consistent
with the logic described above, explaining more than 90% of the variation in single-family existing home sales shown by
the dotted line in Figure 10 on page 13.

12 | Arch Mortgage Insurance Company
Figure 10: Single-Family Existing Home Sales Model: Fundamental Plus Home Prices, Unemployment
and Rates

            Single-Family Existing Home Sales (000s, saar)        Model @ 5% FRM30            Model @ 4% FRM30            Model @ 3% FRM30
7,000
            Fundamental Model with Cyclical Factors           Fundamental Model
6,000

5,000

4,000

3,000

2,000
                                                                        Sources: NAR/FHFA/Freddie Mac PMMS/U.S. Census Bureau/BEA/BLS/Arch MI
1,000
   Dec-65   Dec-70      Dec-75       Dec-80       Dec-85     Dec-90    Dec-95     Dec-00   Dec-05    Dec-10      Dec-15   Dec-20    Dec-25   Dec-30

The estimated impact of the demographic factors from                              we previously mentioned would need to be added to the
the fundamental model remained roughly unchanged.                                 inventory of existing homes for sale to bring the market
With the cyclical factors added, we also see that every                           back into balance.
percentage point of home-price appreciation typically
                                                                                  Going forward, with prevailing mortgage rates now
boosts the pace of single-family existing home sales
                                                                                  well above 5% and the average effective outstanding
by about 90,000; every percentage-point increase in
                                                                                  mortgage rate closer to 3.3%, the model suggests the
unemployment typically subtracts about 80,000 from the
                                                                                  difference of 200 bps should slow sales by roughly
pace of sales and about 180,000 fewer sales typically
                                                                                  360,000. This is quite the swing from 4Q21, when the
occur for every percentage point that prevailing mortgage
                                                                                  prevailing mortgage rate averaged 3.1% and the average
rates exceed the rate on outstanding mortgages.
                                                                                  outstanding rate was 3.4%. The impact of the increase in
The impact of home-price appreciation implies a                                   rates on home sales can be seen in the shift from the light-
somewhat circular process, whereby stronger price                                 blue line in Figure 9, which reflects the model output with
growth creates stronger home sales, which in turn creates                         a 3% mortgage rate going forward, compared to the gray
stronger price growth, but statistical evidence suggests                          line, which reflects the model output with a 5% mortgage
there is indeed some self-reinforcing causality. This circular                    rate going forward.
feedback loop is effectively a representation of the
                                                                                  Even more meaningful going forward is the expected
momentum that can take hold in the housing market.
                                                                                  slowdown in home-price appreciation, which if it were
Comparing the model results with actual sales activity, it                        to slow by 10 percentage points, or from 20% year-over-
is readily apparent that implied demand far exceeded                              year to 10%, would cool home sales by about 800,000.
actual home sales. This is reflective of the shortage of                          As mentioned above, demographic fundamentals point
homes for sale, which has limited actual sales activity and                       to stronger demand going forward (green dashed line on
resulted in extreme competition for the homes brought to                          Figure 9), which offsets some of these building headwinds.
the market. In fact, the model implied demand exceeded                            Putting all these factors together suggests that demand
actual activity by roughly 1.2 million sales over the course                      should cool going forward, but that sales should stabilize
of the pandemic, about the same number of homes that                              at a level somewhat above the pre-pandemic pace.

                                                                                                         Arch Mortgage Insurance Company | 13
Housing and Mortgage Market Review

                             Donuts in Housing Aren’t Just a Realtor Treat
                             We have now established that the fundamental drivers of housing demand look positive
                             for the near-term outlook, but this robust demand is obviously not evenly distributed across
                             the nation. This was true prior to the pandemic and even more so now as the pandemic
                             has suddenly increased the flexibility for most office workers to work from home several
                             days per week or even full-time. With limited and lagged data available on population
                             and migration trends, we turn to a simple metric to evaluate where demand has most
                             outpaced supply since the beginning of the pandemic: home prices.

                             Boston Cream or Cronut?

                             While home prices and interest rates have surged, potential homebuyers have had few
                             measures to keep their housing costs within budget other than buying a smaller home
                             or buying further away from job centers. The increased flexibility to work from home and
                             limit commuting days has made the latter option more attractive since the onset of the
                             pandemic. As suburban and exurban locales generally offer lower prices per square foot
                             than city centers, potential homebuyers making this tradeoff can achieve their desire for
                             more space by tolerating a longer commute for a few days per week. The hollowing out
                             of demand for core city centers and increase in demand for the outer regions surrounding
                             them has been dubbed the “donut effect.”

14 | Arch Mortgage Insurance Company
To assess this potential donut effect, or the impact of                                                       “mid” bucket, and the “low” bucket captures all ZIP codes
this newfound work-from-home flexibility, we evaluated                                                        below the 50th percentile.
the home-price appreciation (HPA) before and after the
                                                                                                              Lastly, to reflect the impact of commuting, we considered
onset of the pandemic across ZIP codes based on Zillow’s
                                                                                                              the share of workers in each ZIP code whose typical
Home Value Index (ZHVI).1 The ZHVI is a smoothed,
                                                                                                              commute exceeds 30 minutes according to the 2020
seasonally adjusted measure of the typical home value
                                                                                                              American Community Survey 5-Year Estimates. To segment
and market changes across a given region and housing
                                                                                                              the ZIP codes into buckets of commuting intensity, we
type. It reflects the typical value for homes in the 35th to
                                                                                                              simply created five ranges for the share of households
65th percentile range. We defined pre-pandemic price
                                                                                                              with typical commutes longer than 30 minutes: 0–20%,
growth as the average annual change in home prices
                                                                                                              20–40%, 40–60%, 60–80% and 80–100%.
from December 2016 through December 2019 and the
post-pandemic price growth as the average annualized                                                          A look at the average annual home-price growth across
change from December 2019 through March 2022. We                                                              ZIP codes during the pre-pandemic period reveals
evaluated nearly 25,000 ZIP codes with data available                                                         very little variation by population density or commuting
during both periods.                                                                                          intensity bucket (Figure 11). This was a relatively stable
                                                                                                              period for the housing market, with home prices steadily
For classifying ZIP codes, we leveraged the same
                                                                                                              increasing by about 5% per year for most ZIP codes, with
definition as those detailed in Stanford University’s
                                                                                                              only ZIP codes in high-population-density buckets with
publication, “The donut effect: How COVID-19 shapes
                                                                                                              20–40% and 80–100% of workers commuting longer than
real estate.”2 ZIP code density buckets are accordingly
                                                                                                              30 minutes averaging more than 6% home-price growth
segmented with the top 10 percentile by population
                                                                                                              per year.
density (population/land area in each ZIP code) assigned
to the “high” bucket, the 50th to 90th percentile to the

Figure 11: Pre-Pandemic Average Annual Home-Price Growth by ZIP Code

                                      10%
    PRE-PANDEMIC AVERAGE ANNUAL HPA

                                                                                                                                         % of Households Commuting 30+ Minutes

                                      8%                                                                                                        80%–100%             20%-40%
                                                                                                                                                60%-80%              0%-20%
                                                                                                                                                40%-60%
                                      6%

                                      4%

                                      2%

                                      0%
                                                               High                                            Mid                                     Low

                                      Sources: Zillow/U.S. Census Bureau/Arch MI                        POPULATION DENSITY

1
    https://www.zillow.com/research/zhvi-user-guide/
2
    https://siepr.stanford.edu/publications/policy-brief/donut-effect-how-covid-19-shapes-real-estate                                                      (continued on page 16)

                                                                                                                                    Arch Mortgage Insurance Company | 15
Housing and Mortgage Market Review

Donuts in Housing Aren’t Just a Realtor Treat (continued from page 15)
Looking at the post-pandemic period, typical home-price growth remained positive across all of the ZIP code buckets
we evaluated. However, home-price growth was strongest in the mid- and low-population-density ZIP codes with the
greatest share of workers who have longer than 30-minute commutes, as well as high-population-density ZIP codes with
fewer workers commuting longer than 30 minutes (Figure 12).

Figure 12: Post-Pandemic Average Annual Home-Price Growth by ZIP Code

                                   14%                                                                % of Households Commuting 30+ Minutes
POST-PANDEMIC AVERAGE ANNUAL HPA

                                                                                                             80%–100%             20%-40%
                                   12%
                                                                                                             60%-80%              0%-20%
                                                                                                             40%-60%
                                   10%

                                   8%

                                   6%

                                   4%

                                   2%

                                   0%
                                                             High                      Mid                          Low

                                   Sources: Zillow/U.S. Census Bureau/Arch MI   POPULATION DENSITY

Considering the difference in home-price growth between the pre- and post-pandemic periods provides a clearer picture
of the impact of the pandemic on homebuyer preferences regarding population density and commuting. Although home-
price growth accelerated in 90% of ZIP codes, the acceleration was concentrated in mid-population-density ZIP codes
with a higher share of workers with long commutes (Figure 13). Interestingly, home-price growth decelerated sharply for
the typical high-population-density ZIP codes with a high share of workers who have longer than 30-minute commutes.

Figure 13: Pre vs. Post-Pandemic Average Annual Home Price Growth by ZIP Code

                                      10%
                                                                                                      % of Households Commuting 30+ Minutes
                                         8%
                                                                                                             80%–100%            20%-40%
PRE VS. POST-PANDEMIC
 AVERAGE ANNUAL HPA

                                         6%                                                                  60%-80%             0%-20%
                                                                                                             40%-60%
                                         4%

                                         2%

                                         0%

                                         -2%

                                         -4%
                                                                High                     Mid                         Low

                                   Sources: Zillow/U.S. Census Bureau/Arch MI    POPULATION DENSITY

16 | Arch Mortgage Insurance Company
The change from generally consistent home-price growth across ZIP codes pre-pandemic to a sharp acceleration in
home-price growth for less dense ZIP codes with longer commutes and sharp deceleration for high-density ZIP codes
with longer commutes is evidence of a stark change in homebuyer preferences. The “donut effect” is even more apparent
when viewing the change in home-price appreciation on maps of major metro regions such as New York (Figure 14),
Boston (Figure 15) and San Francisco (Figure 16).

We are likely still in the early stages of this shift in homebuyer preferences as the limited inventory has undoubtedly
dissuaded some potential homebuyers from making the move out of dense urban areas. Given the still rapidly changing
environment for hybrid and remote work and a still-constrained housing inventory, we plan to closely monitor these trends
going forward for any indications of a reversal.

Figure 14: New York Regional Donut Effect                        Figure 15: Boston Regional Donut Effect

                                                                                                       PRE VS. POST-PANDEMIC HPA
                                                                                                          20%

                                                                                                           0%

                                                                                                          -4%

                                PRE VS. POST-PANDEMIC HPA
                                   27%

                                    6%
                                                                 Figure 16: S
                                                                             an Francisco Regional Donut Effect
                                  -14%

                                                                 PRE VS. POST-PANDEMIC
                                                                 AVERAGE HPA
    Sources: Zillow/Arch MI
                                                                    34%

                                                                    11%

                                                                   -11%

                                                                                         Arch Mortgage Insurance Company | 17
Housing and Mortgage Market Review

                                 Housing and Mortgage Market Indicators

                                 Y E A R - O V E R -Y E A R P E R C E N TA G E C H A N G E I N H O M E P R I C E S

25%                                                                                                 National home prices have re-
                                                                                                    accelerated after slowing from last
20%                                                                                                 summer’s record pace. Home-price
                                                                                                    growth in Q1 2022 was strong across all
15%
                                                                                                    three indices, with the Federal Housing
                                                                                                    Finance Agency (FHFA) Purchase-Only
10%
                                                                                                    Index up 19.0% year-over-year — topping
5%                                                                                                  the previous record of 18.6% from Q3 2021.
                                                                                                    While these home-price indicators differ
0%                                                                                                  in methodologies and data sources (the
                                                                                                    FHFA only uses GSE loans, while the Case-
 -5%
                                                                                                    Shiller index includes many jumbo and
-10%                                                                                                other types of loans), they all reflect record
                                                                                                    year-over-year price gains for the quarter.
-15%                                                                                                Sources: S&P Case-Shiller/FHFA/Moody’s
  Dec-01 Dec-03 Dec-05 Dec-07 Dec-09 Dec-11 Dec-13 Dec-15 Dec-17 Dec-19 Dec-21                      Analytics/Arch MI

            FHFA All Transactions HPI
            FHFA Purchase Only HPI
            S&P/Case-Shiller U.S. National HPI

                                         M B A M O R T G A G E P U R C H A S E A P P L I C AT I O N I N D E X

160                                                                                                 As of May 2022, mortgage purchase
                                                                                                    applications are down 13%
150                                                                                                 compared with a year ago, and
                                                                                                    down 12% from May 2019 levels
140
                                                                                                    amid the increase in mortgage
130                                                                                                 rates. The rise in mortgage rates has
                                                                                                    been sharp so far in 2022 and although
120                                                                                                 we do expect mortgage rates to
                                                                                                    come down modestly in the next few
110                                                                                                 quarters, they will remain a headwind
                                                                                                    for purchase activity despite a strong
100
                                                                                                    demographic and labor market
90                                                                                                  backdrop.

                                                                                                    Note: Index rebased so that current
80
                                                                                                    activity level = 100
      Jan   Feb    Mar       Apr        May      Jun    Jul    Aug   Sep      Oct   Nov   Dec
                                                                                                    Sources: Mortgage Bankers Association
                             2022                2021         2020         2019                     (MBA)/Arch MI

18 | Arch Mortgage Insurance Company
Housing and Mortgage Market Indicators

                         H O U S I N G S TA R T S , I N T H O U S A N D S — S E A S O N A L LY A DJ U S T E D A N N U A L R AT E

            2.0                                                                                                             Single-family housing starts reached
                                                                                                                            their highest level since 2007 in
                                                                                                                            December 2020 at 1.3 million units
                                                                                                                            (seasonally adjusted annual rate) and
            1.5                                                                                                             have remained elevated at about 1.1
                                                                                                                            million units as of April 2022. Despite
                                                                                                                            supply constraints impacting construction
MILLIONS

                                                                                                                            activity, the current pace of single-family
            1.0                                                                                                             housing starts is about 20% above the pre-
                                                                                                                            pandemic pace. Additionally, the pace
                                                                                                                            of multifamily starts increased to about
                                                                                                                            624,000 units (annualized rate) in April,
            0.5                                                                                                             about 40% above the pre-pandemic pace.
                                                                                                                            Sources: U.S. Census Bureau/Moody’s
                                                                                                                            Analytics/Arch MI

            0.0
                Apr-02   Apr-04     Apr-06    Apr-08    Apr-10    Apr-12    Apr-14     Apr-16    Apr-18   Apr-20   Apr-22

                      Single-Family Starts          Multifamily Starts

           N E W A N D E X I S T I N G H O M E S A L E S , I N T H O U S A N D S — S E A S O N A L LY A DJ U S T E D A N N U A L R AT E

8,000                                                                                                              1,600    Sales of existing homes (including
                                                                                                                            single-family, condo, and co-ops)
7,000                                                                                                              1,400    totaled 6.1 million units in 2021, the
                                                                                                                            highest since 2006. Sales have cooled
6,000                                                                                                              1,200    in 2022 with the April figure down 8%
                                                                                                                            from 2021 to a 5.6-million-unit pace.
5,000                                                                                                              1,000    New-home sales have also eased from
                                                                                                                            a strong 2021 amid labor and supply
4,000                                                                                                              800      chain constraints, which have caused
                                                                                                                            homebuilders to hold back sales to
3,000                                                                                                              600      manage a growing backlog of homes
                                                                                                                            under construction. Existing home sales
2,000                                                                                                              400      are based on the closing of contracts
                                                                                                                            signed one to two months earlier, while
                                                                                                                            new-home sales are counted at the
1,000                                                                                                              200
                                                                                                                            time of signing.

            0                                                                                                      0        Sources: NAR/U.S. Census Bureau/Arch MI
           Apr-02 Apr-04 Apr-06 Apr-08 Apr-10 Apr-12 Apr-14 Apr-16 Apr-18 Apr-20 Apr-22

                    Existing Home Sales: Single-Family & Condo & Co-op
                    Existing Home Sales: Single-Family            New Home Sales: Single-Family (rhs)

                                                                                                                            Arch Mortgage Insurance Company | 19
Housing and Mortgage Market Review

                                  Housing and Mortgage Market Indicators

                                                  M O N T H S ’ S U P P LY O F H O M E S F O R S A L E

14                                                                                                                                                  The inventory of homes for sale has
        Months’ Supply: Existing Homes              Months’ Supply: New Homes                                                                       increased, but remains near record
        Months’ Supply: Completed Homes                                                                                                             lows. The months’ supply of existing
12
                                                                                                                                                    single-family homes for sale (total
                                                                                                                                                    seasonally adjusted listings ÷ last month’s
10                                                                                                                                                  seasonally adjusted annualized sales
                                                                                                                                                    pace) was 2.1 months as of April 2022,
                                                                                                                                                    down from an average of 2.3 months in
 8
                                                                                                                                                    2021 and the pre-pandemic average of 4.5
                                                                                                                                                    months. Meanwhile, the months’ supply
 6                                                                                                                                                  of completed new homes for sale was to
                                                                                                                                                    2.8 in April, up slightly from an average of
 4                                                                                                                                                  2.1 months in 2021 but down from the pre-
                                                                                                                                                    pandemic average of roughly 4 months.

 2                                                                                                                                                  SA stands for Seasonally Adjusted.
                                                                                                                                                    Sources: NAR/Moody’s Analytics/Arch MI
 0
Apr-02 Apr-04 Apr-06 Apr-08 Apr-10 Apr-12 Apr-14 Apr-16 Apr-18 Apr-20 Apr-22

                                  H O M E - P R I C E G R O W T H B Y S TAT E : Y E A R - O V E R -Y E A R ( %)

                                                                                                                                                     As of Q1 2022, home prices increased
                                                                                                                                                    in all 50 states over the past year
                  23
                                                                                                                                                    and also accelerated in all 50 states
                                  26                                                                                                           21
                                                   10
                                                                                                                                                    compared with the prior year. The
                                                                   15                                                               18
             20
                                                                                                                                          19        fastest growth in home prices was in
                        28                         21                                                                         14
                                                                                   16                                                 16
                                       17                                                         16                                  16            Arizona (29%), Utah (28%), Idaho (28%),
                                                                                                                                               19
                                                                        14                                              15                          Florida (27%) and Montana (26%).
                                                    16                                                                             17
                   25
                                                                                             18         16                   14                     Meanwhile, the slowest growth occurred
                             28                                                         13                                           16
        21
                                            22
                                                                                                              12        15
                                                                                                                                                    in the District of Columbia (10%), North
                                                         16
                                                                             18                    16                                               Dakota (10%) and Louisiana (11%).
                                                                                                                        24
                                                                                              25
                         29
                                       17
                                                              17                                                                                    SA stands for Seasonally Adjusted.
                                                                             19                                    22

                                                                                              18         23                                         Sources: Federal Housing Finance
                                                                                        16
                                                    23                        12
                                                                                                                                                    Agency All-Transactions House Price Index
                                                                                                                                                    (FHFA HPI®)/Arch MI
              13
                                                                                                                   27

                                             20

20 | Arch Mortgage Insurance Company
Housing and Mortgage Market Indicators

                                                 HOME- PRICE GROW TH SINCE PRIOR PEAK

                                                                                                                                                               Strong home-price appreciation over
                                                                                                                                                               the past year resulted in home prices
          81                                                                                                                                                   exceeding their prior peaks in all 50
                                82                77                                                                                                      54   states in the first quarter of 2022.
     70                                                           38                                                                            41             Cumulative home-price growth has varied
                    107                                                                                                                              44
                                                  80
                                                                                 41                                                    37            44        widely since prices last peaked around
                                      49                                                                                                            11
                                                                                                39
                                                                                                                                                          28   2006 (we measure since the peak for each
                                                                                                                              41
                                                   69
                                                                       48
                                                                                                                                            19
                                                                                                                                                               state, which varied around 2006/2007).
               34                                                                                        47                        12
                          96                                                          13
                                                                                           60                                                    21            The largest cumulative home-price growth
34                                        115                                                                      32
                                                        57                  49
                                                                                                                              28
                                                                                                                                                               since the prior peak is in Colorado (115%),
                                                                                                    55
                                                                                                                              63
                                                                                                                                                               followed by Idaho (107%) and Texas
                                                                                               84
                      51
                                      34
                                                             59                                                                                                (106%), which have increased more than
                                                                            47                                          58
                                                                                                                                                               twice as fast as the national average
                                                                                           43                 60
                                                                                      33
                                                                                                                                                               of 52%. This chart is intended to aid
                                                   106
                                                                            39                                                                                 understanding of market strength since the
          38
                                                                                                                         41
                                                                                                                                                               prior downturn and doesn’t indicate any
                                                                                                                                                               overvaluation since it doesn’t account for
                                            48                                                                                                                 changes in income or reasonableness of
                                                                                                                                                               prices at their prior peak.
                                                                                                                                                               Sources: FHFA/Arch MI

     H O M E O W N E R S H I P C O S T - T O - I N C O M E R AT I O C H A N G E V S . 19 9 0 – 2 0 0 3 AV E R A G E

                                                                                                                                                               Affordability is now worse than
                                                                                                                                                               historical norms in all states but four,
           20
                                                                                                                                                               with the Northwest and Mountain West
                                 22                8                                                                                                      14   generally the least affordable along
                                                                                                                                            14
     22                                                           5
                                                                                                                                                     9
                                                                                                                                                               with Florida, Vermont, and Hawaii.
                     24
                                                   4                             6                                                     6             8         This map shows how affordability differs
                                      11                                                                                                            -7
                                                                                               0
                                                                                                                                                          2    now compared to historical norms; a
           19                                      3
                                                                       3
                                                                                                         -1
                                                                                                                              2
                                                                                                                                            6
                                                                                                                                                               value of five indicates homeownership
                                                                                                                                   5
                           16                                                        -3    3                                                    4              costs on today’s median home requires
                                                                                                                   -4
20                                         18
                                                                                                                              5                                5% more of a borrower’s income than it
                                                         6                  -1
                                                                                                   2
                                                                                                                                                               did during more typical market conditions
                                                                                                                              12
                      16
                                                                                           7                                                                   (i.e., between 1990 and 2003). For the
                                                             2
                                      5                                      1                                          7                                      U.S., the median-priced home requires
                                                                                                              9
                                                                                      3    2                                                                   42% of the median income, 5 percentage
                                                   10                                                                                                          points above typical conditions. Idaho
                                                                            3
                                                                                                                                                               (24%) remains the least affordable state
          7
                                                                                                                        15                                     compared to its 1990–2003 average,
                                                                                                                                                               followed by Montana (22%) and Oregon
                                            21                                                                                                                 (22%). The most affordable markets now
                                                                                                                                                               compared to their 1990–2003 averages
                                                                                                                                                               include Connecticut (-7%), West Virginia
                                                                                                                                                               (-4%) and Illinois (-3%).

                                                                                                                                                               Sources: U.S. Census Bureau/Freddie Mac/
                                                                                                                                                               NAR/Moody’s Analytics/Arch MI

                                                                                                                                                               Arch Mortgage Insurance Company | 21
Housing and Mortgage Market Review

                               Housing and Mortgage Market Indicators
                     P E R C E N TA G E O F M E D I A N I N C O M E N E E D E D F O R H O M E O W N E R S H I P
                                         COST S O N A M ED I A N - P RI CED H O M E

                         56

                                              56                                                                                                                 46
                                                                  30
                    57                                                                                                                                43
                                                                                  33
                                                                                                                                                            42
                                 54                                                               35                                            51
                                                                  31                                                                                        54
                                                   45                                                        29                                            43
                                                                                                                                                                 43
                                                                                       26                                                 32
                          51                                       29                                                                                45
                                                                                                                      30                       35
                                      49                                                           35       28                                            35
                                                        55                                                                      26
               72                                                                                                                         39
                                                                        33                  30                   31

                                                                                                                                          42
                                                                                                            38
                                   47                                        28
                                                   43                                       30                                       39

                                                                                                            33             38
                                                                                                       34
                                                                   40
                                                                                             32

                         36
                                                                                                                                     49

                                                         77

Homeownership costs remain highest relative to typical incomes in the West. Lower values of our affordability metric indicate better
affordability, such as in Iowa (26%), West Virginia (26%) and Indiana (27%). Calculations are based on pre-tax median household income,
a 10% down payment, escrow of annual expenses of roughly 1.5% of the initial home price (for insurance and property taxes, which we
vary by state), the prevailing 30-year fixed-rate mortgage rate, plus 0.75% to cover mortgage insurance and risk add-ons, as well as
roughly 1% of the initial home price to cover annual maintenance costs.

Sources: U.S. Census Bureau/Freddie Mac/NAR/Moody’s Analytics/Arch MI

22 | Arch Mortgage Insurance Company
Housing and Mortgage Market Indicators

                                A N N U A L P E R C E N TA G E C H A N G E I N H O U S I N G S TA R T S

                        2

                                              25                                                                                                                26
                                                                 3
                                                                                                                                                12
                   14                                                          17
                                                                                                                                                         14
                                  1                              20                       6                                                11              -1
                                                                                                         2                                              13
                                                   18                                                                                                           1
                                                                                10                                               21
                         21                                      3                                                                              7
                                        17                                                          10            7                   -3
                                                                                              14                                                    8
                                                        13                                                             18
               2
                                                                      6                                                           5
                                                                                     6                       10
                                                                                                                                 13
                                                                                                    13
                                   12                                     11
                                                                                     24                                     21
                                                   17
                                                                                                    3             10
                                                                                              0
                                                                 14
                                                                                     12
                        10
                                                                                                                            27

                                                             5

The annual growth in housing starts varies widely but is generally weakest in the Northeast and strongest in the West, Midwest
and parts of the Southeast. Housing starts increased the most in the District of Columbia (155%), Florida (27%) and Maine (26%). To get a
clearer understanding of the trend, unlike numbers seen elsewhere, we smooth the data by calculating the growth in the 12-month moving
average to dampen short-term volatility due to weather, survey limitations, etc.

Sources: U.S. Census Bureau/Moody’s Analytics/Arch MI

                                                                                                   Arch Mortgage Insurance Company | 23
Housing and Mortgage Market Review

State Housing and Demographic Trends
                                                 FHFA HPI (% Y/Y)                HOMEOWNERSHIP COST-TO-INCOME RATIO (%)
STATE
(Sorted alphabetically)               Q1 2022                       YEAR AGO     Q1 2022                    VS 1990–2003 AVG

Alabama                                18.3                            7.7         33                               2
Alaska                                 13.1                            4.2         36                               7
Arizona                                28.6                           12.7         47                              16
Arkansas                               18.7                            6.8         30                               1
California                             20.7                            7.3         72                              20
Colorado                               21.6                            7.7         55                              18
Connecticut                            16.1                            8.8         43                              -7
Delaware                               16.0                            7.6         35                               4
District of Columbia                   10.1                            4.7         54                              14
Florida                                27.4                            9.2         49                              15
Georgia                                23.3                            8.2         38                               9
Hawaii                                 20.3                            3.3         77                              21
Idaho                                  28.3                           16.7         54                              24
Illinois                               13.5                            4.1         35                              -3
Indiana                                18.1                            7.9         28                               3
Iowa                                   13.8                            4.0         26                               3
Kansas                                 15.9                            7.0         33                               6
Kentucky                               16.4                            6.9         31                               2
Louisiana                              11.5                            4.1         32                               3
Maine                                  21.4                           10.8         46                              14
Maryland                               14.5                            6.4         35                               5
Massachusetts                          16.2                            7.1         54                               8
Michigan                               16.4                            7.6         29                               0
Minnesota                              14.9                            6.4         33                               5
Mississippi                            15.8                            4.8         34                               3
Missouri                               18.2                            6.6         30                              -1
Montana                                26.2                            9.9         56                              22
Nebraska                               16.3                            5.9         29                               3
Nevada                                 24.6                            8.7         51                              19
New Hampshire                          19.1                           10.1         42                               9
New Jersey                             16.9                            7.5         45                               6
New Mexico                             17.4                            8.4         43                               5
New York                               14.0                            7.2         51                               6
North Carolina                         23.7                            7.9         42                              12
North Dakota                           10.3                            2.7         30                               8
Ohio                                   16.4                            7.7         30                              -1
Oklahoma                               17.5                            6.1         28                               2
Oregon                                 20.0                            9.4         57                              22
Pennsylvania                           14.9                            7.3         32                               2
Rhode Island                           19.0                            9.2         43                               2
South Carolina                         22.1                            7.0         39                               7
South Dakota                           21.0                            5.7         31                               4
Tennessee                              25.1                            8.8         38                               7
Texas                                  22.6                            7.1         40                              10
Utah                                   28.3                           12.3         49                              16
Vermont                                17.7                            8.2         43                              14
Virginia                               15.5                            6.9         39                               5
Washington                             22.8                            9.7         56                              20
West Virginia                          12.5                            6.2         26                              -4
Wisconsin                              16.0                            6.1         35                               6
Wyoming                                17.0                            5.9         45                              11
Population Weighted Total              19.5                            7.5         44                               9

Sources: FHFA/BLS/U.S. Census Bureau/Freddie Mac/NAR/Moody’s Analytics/Arch MI

24 | Arch Mortgage Insurance Company
State Housing and Demographic Trends
             LARGEST                       UNEMPLOYMENT RATE                         POPULATION (000s)            MEDIAN HOUSEHOLD INCOME
STATE        METROPOLITAN
                                                               PRE-COVID
(Sorted alphabetically)         FEB ‘22        COVID PEAK                        Q1 2022            % Y/Y         Q1 2022           % Y/Y
                                                                (FEB ‘20)
Alabama                           3.0             13.7            3.4              4,939              0.2     $        57,154        3.5
Alaska                            5.3             11.9            5.2                745              1.1     $        85,324        3.2
Arizona                           3.6             13.9            5.0              7,729              2.4     $        70,034        4.5
Arkansas                          3.1             10.0            3.6              3,058              0.5     $        54,654        4.0
California                        5.3             16.1            4.1             39,993              1.0     $        89,439        4.4
Colorado                          4.0             11.8            2.8              5,891              0.8     $        81,317        3.9
Connecticut                       4.9             11.4            3.4              3,560              0.1     $        83,675        3.4
Delaware                          4.6             13.3            3.7                996              0.5     $        74,035        3.5
District of Columbia              6.1             11.1            5.4                698             -1.3     $       104,995        4.7
Florida                           3.3             13.9            2.7             22,481              2.0     $        65,801        3.9
Georgia                           3.2             12.3            3.6             10,902              1.0     $        66,264        3.9
Hawaii                            4.2             22.4            2.2              1,414              0.3     $        90,117        2.5
Idaho                             2.8             11.8            3.0              1,865              1.1     $        66,435        3.9
Illinois                          4.8             17.4            3.8             12,607              0.1     $        75,654        3.8
Indiana                           2.3             16.8            3.4              6,780              0.2     $        65,482        4.1
Iowa                              3.5             10.5            2.6              3,151             -0.2     $        65,762        4.0
Kansas                            2.5             12.2            3.1              2,921              0.1     $        66,757        3.9
Kentucky                          4.2             16.5            4.1              4,494              0.2     $        57,637        3.8
Louisiana                         4.3             13.5            5.2              4,653              0.1     $        54,186        3.6
Maine                             4.0              9.2            2.8              1,352              0.0     $        61,437        3.9
Maryland                          5.0              9.5            4.2              6,136              0.8     $        93,614        3.5
Massachusetts                     4.7             17.1            2.9              6,914              0.2     $        92,202        3.7
Michigan                          4.7             22.7            3.8              9,966              0.0     $        65,320        3.7
Minnesota                         2.7             10.8            3.9              5,722              0.7     $        79,291        3.8
Mississippi                       4.5             15.4            5.7              2,971              0.1     $        50,291        4.1
Missouri                          3.7             11.2            3.3              6,184              0.3     $        62,180        3.9
Montana                           2.6             12.2            3.7              1,085              0.2     $        60,288        4.0
Nebraska                          2.1              8.2            3.0              1,939              0.0     $        68,632        4.3
Nevada                            5.1             28.5            4.0              3,263              2.3     $        66,962        3.3
New Hampshire                     2.7             16.2            2.7              1,384              0.8     $        86,584        4.1
New Jersey                        4.6             15.8            3.5              8,930              0.3     $        90,977        3.1
New Mexico                        5.6              9.8            5.4              2,113              0.2     $        53,828        3.2
New York                          4.9             16.5            3.9             19,303             -0.1     $        76,692        3.2
North Carolina                    3.7             14.2            3.7             10,837              1.3     $        63,453        4.1
North Dakota                      2.9              8.3            2.2                761             -0.4     $        63,739        4.0
Ohio                              4.2             16.4            4.6             11,667             -0.1     $        63,973        3.7
Oklahoma                          2.6             12.6            3.2              4,005              0.3     $        56,597        3.3
Oregon                            4.0             13.3            3.4              4,328              1.2     $        71,758        4.0
Pennsylvania                      5.1             16.5            5.0             12,777              0.0     $        68,733        3.5
Rhode Island                      3.9             18.4            3.7              1,058              0.0     $        80,742        3.4
South Carolina                    3.5             11.6            2.9              5,275              0.6     $        60,004        4.1
South Dakota                      2.6              8.8            2.6                892             -0.1     $        65,068        5.0
Tennessee                         3.4             15.9            3.6              6,978              0.8     $        59,816        3.8
Texas                             4.7             12.6            3.5             30,090              1.4     $        69,648        3.5
Utah                              2.1             10.0            2.6              3,331              1.4     $        82,696        4.0
Vermont                           2.9             14.3            2.6                627              0.3     $        72,036        3.2
Virginia                          3.2             11.6            2.7              8,729              0.9     $        83,991        3.7
Washington                        4.3             16.8            3.9              7,876              1.4     $        85,127        4.1
West Virginia                     3.9             15.5            5.1              1,771             -0.4     $        51,687        3.5
Wisconsin                         2.9             14.1            3.0              5,857              0.2     $        68,072        3.7
Wyoming                           3.6              8.6            4.9                581             -0.1     $        69,033        3.1
Population Weighted Total         4.1             14.6            3.7            333,578              0.7     $        72,912        3.8

Sources: FHFA/BLS/U.S. Census Bureau/Freddie Mac/NAR/Moody’s Analytics/Arch MI

                                                                                                   Arch Mortgage Insurance Company | 25
Housing and Mortgage Market Review

Housing and Demographic Trends for the 100 Largest MSAs

100          LARGEST
             METROPOLITAN                            FHFA HPI (% Y/Y)
                                                                             HOMEOWNERSHIP
                                                                         COST-TO-INCOME RATIO (%)
                                                                                                       UNEMPLOYMENT RATE (%)        POPULATION (000s)
                                                                                                                                                            MEDIAN HOUSEHOLD
                                                                                                                                                                 INCOME
                                                                                     VS 1990–2003              COVID   PRE-COVID
                                                    Q1 2022   YEAR AGO    Q1 2022         AVG
                                                                                                    FEB ‘22
                                                                                                               PEAK     (FEB ‘20)
                                                                                                                                    Q1 2022    % Y/Y    Q1 2022        % Y/Y

New York-Jersey City-White Plains, NY-NJ             11.4        5.3         56            3         5.6       18.5       3.6       14,182      0.0     $    72,835    0.3
Los Angeles-Long Beach-Glendale, CA                  18.9        6.9         82           24         6.3       19.2       4.4       10,290      0.9     $    73,128    1.6
Houston-The Woodlands-Sugar Land, TX                 17.8        4.6         40           12         5.1       13.8       3.6        7,344      1.4     $    72,786    2.7
Chicago-Naperville-Evanston, IL                      13.4        3.8         38           -1         4.9       18.4       4.0        7,141      0.1     $    75,785    0.5
Atlanta-Sandy Springs-Alpharetta, GA                 24.6        8.3         38           11         3.1       12.6       3.5        6,192      1.0     $    76,686    0.4
Dallas-Plano-Irving, TX                              25.2        6.5         42           11         4.1       12.3       3.1        5,282      1.4     $    76,920    2.8
Phoenix-Mesa-Chandler, AZ                            30.1       13.1         46           17         3.0       13.2       4.4        5,274      2.3     $    65,337    0.9
Washington-Arlington-Alexandria, DC-VA-MD-WV         13.5        6.5         38            6         4.0       10.4       3.2        5,036      0.6     $   109,503    1.7
Riverside-San Bernardino-Ontario, CA                 24.4       10.4         57           18         5.6       15.8       4.1        4,767      0.9     $    69,927    0.3
Minneapolis-St. Paul-Bloomington, MN-WI              14.7        6.5         34            5         2.7       11.4       3.5        3,720      0.6     $    81,951    1.4
San Diego-Chula Vista-Carlsbad, CA                   22.4        8.5         75           18         4.6       16.3       3.3        3,422      0.9     $    84,183    1.9
Tampa-St. Petersburg-Clearwater, FL                  29.0       10.8         48           18         3.0       13.4       2.7        3,368      1.9     $    56,465   -1.6
Anaheim-Santa Ana-Irvine, CA                         18.7        5.7         90           36         4.3       15.5       2.9        3,255      0.9     $    96,175    2.3
Seattle-Bellevue-Kent, WA                            22.6        8.0         58           18         3.4       17.0       2.6        3,189      1.3     $    98,013   -1.1
Denver-Aurora-Lakewood, CO                           21.4        7.7         52           19         4.0       12.3       2.6        3,034      0.8     $   105,335    0.5
Oakland-Berkeley-Livermore, CA                       18.3        5.6         74           10         4.5       14.9       3.1        2,895      0.9     $   108,713    2.0
Miami-Miami Beach-Kendall, FL                        23.6        8.1         74           34         3.4       15.0       1.6        2,864      1.9     $    53,954   -1.3
Baltimore-Columbia-Towson, MD                        13.7        6.3         33            6         4.8        9.6       4.2        2,859      0.7     $    86,609    1.9
Nassau County-Suffolk County, NY                     14.2        6.9         50           14         3.5       18.6       3.7        2,826     -0.1     $   104,246   -1.3
St. Louis, MO-IL                                     14.2        5.5         27           -1         3.8       12.0       3.1        2,823      0.2     $    70,154    1.8
Orlando-Kissimmee-Sanford, FL                        24.2        7.6         48           19         3.6       22.1       2.7        2,750      1.9     $    60,455   -0.9
Charlotte-Concord-Gastonia, NC-SC                    25.1        8.7         44           20         3.6       13.9       3.4        2,697      1.2     $    65,723    1.9
San Antonio-New Braunfels, TX                        21.8        6.6         43           15         4.2       12.9       3.1        2,651      1.4     $    63,708    0.7
Fort Worth-Arlington-Grapevine, TX                   24.6        7.4         38           11         4.1       12.6       3.1        2,589      1.4     $    72,944    1.8
Portland-Vancouver-Hillsboro, OR-WA                  19.1        8.3         54           19         4.0       13.4       3.3        2,575      1.2     $    82,889    0.2
Warren-Troy-Farmington Hills, MI                     15.0        7.1         31            1         3.8       22.7       3.6        2,571      0.0     $    75,080    0.1
Newark, NJ-PA                                        14.5        6.7         51            2         4.7       14.8       3.6        2,518      0.3     $    83,842    0.2
Sacramento-Roseville-Folsom, CA                      21.2        9.4         51           13         4.7       14.5       3.6        2,423      0.9     $    76,440    1.3
Cambridge-Newton-Framingham, MA                      15.4        6.0         53            4         4.2       15.4       2.6        2,412      0.2     $   101,324   -1.1
Las Vegas-Henderson-Paradise, NV                     26.1        7.4         55           23         5.8       32.0       4.2        2,411      2.2     $    48,311   -2.5
Pittsburgh, PA                                       14.1        6.9         26            0         5.2       17.1       5.0        2,316      0.0     $    64,062   -1.5
Austin-Round Rock-Georgetown, TX                     33.3       11.8         49           17         3.5       11.9       2.7        2,315      1.4     $    84,375    3.0
Cincinnati, OH-KY-IN                                 17.4        7.5         31            0         3.6       13.6       4.0        2,196      0.0     $    65,321    1.9
Kansas City, MO-KS                                   18.1        8.5         32            5         3.7       12.5       3.1        2,172      0.2     $    73,493    2.0
Philadelphia, PA                                     13.4        7.5         34            5         6.6       17.5       5.6        2,150      0.0     $    55,257   -0.4
Columbus, OH                                         18.6        8.0         34            2         3.6       13.0       4.1        2,115     -0.1     $    63,633    2.2
Indianapolis-Carmel-Anderson, IN                     19.8        8.3         33            8         2.2       13.1       3.1        2,087      0.2     $    63,780    0.3
Fort Lauderdale-Pompano Beach-Sunrise, FL            24.2        7.6         59           23         3.6       16.9       3.1        2,059      1.9     $    59,990   -1.2
Boston, MA                                           15.3        6.9         53            6         4.6       17.3       2.8        2,042      0.2     $    95,471   -0.4
Cleveland-Elyria, OH                                 15.0        7.8         29           -4         5.3       21.2       4.6        2,042     -0.1     $    54,145    1.7
San Jose-Sunnyvale-Santa Clara, CA                   14.3        1.9         90           24         3.5       12.4       2.7        2,040      0.9     $   130,553    2.3
Nashville-Davidson--Murfreesboro--Franklin, TN       26.7        8.0         40           11         2.9       15.8       2.8        2,001      0.8     $    67,557    0.2
Montgomery County-Bucks County-Chester County, PA    15.0        7.4         34           -1         4.0       14.1       4.0        1,983      0.0     $    98,344    0.1
Virginia Beach-Norfolk-Newport News, VA-NC           15.5        7.2         32            3         3.6       12.9       2.9        1,788      0.9     $    72,939   -0.1
Detroit-Dearborn-Livonia, MI                         14.6        8.3         27            0         6.9       26.0       4.8        1,750      0.0     $    51,543   -1.1
San Francisco-San Mateo-Redwood City, CA              9.5       -3.2        100           21         3.5       12.5       2.3        1,689      0.9     $   135,208    5.7
Jacksonville, FL                                     25.2        9.9        41            12         2.9       11.2       2.7        1,644      1.9     $    64,419   -1.3
Providence-Warwick, RI-MA                            18.2        9.1        45             3         4.5       19.6       3.7        1,629      0.1     $    83,756   -2.6
Milwaukee-Waukesha, WI                               14.7        6.0        41             7         3.6       14.4       3.3        1,586      0.2     $    68,630    2.4
West Palm Beach-Boca Raton-Boynton Beach, FL         27.7        8.8        56            20         3.4       14.0       3.1        1,578      1.9     $    66,760   -0.8

Sources: FHFA/BLS/U.S. Census Bureau/Freddie Mac/NAR/Moody’s Analytics/Arch MI

26 | Arch Mortgage Insurance Company
Housing and Demographic Trends for the 100 Largest MSAs

100          LARGEST
             METROPOLITAN                   FHFA HPI (% Y/Y)
                                                                    HOMEOWNERSHIP
                                                                COST-TO-INCOME RATIO (%)
                                                                                               UNEMPLOYMENT RATE (%)         POPULATION (000s)
                                                                                                                                                 MEDIAN HOUSEHOLD
                                                                                                                                                      INCOME
                                                                            VS 1990–2003               COVID    PRE-COVID
                                           Q1 2022   YEAR AGO    Q1 2022         AVG
                                                                                           FEB ‘22
                                                                                                       PEAK      (FEB ‘20)
                                                                                                                             Q1 2022    % Y/Y        Q1 2022    % Y/Y

Raleigh-Cary, NC                            28.3        6.5        41            14         3.0        12.3        3.3        1,440       1.3    $     79,816    1.9
Oklahoma City, OK                           18.1        5.6        26             3         2.4        13.1        2.9        1,422       0.4    $     52,866   -0.6
Memphis, TN-MS-AR                           20.4        8.3        41             9         4.9        13.2        4.4        1,377       0.6    $     52,748   -0.5
Frederick-Gaithersburg-Rockville, MD        13.4        5.6        39             2         4.6         8.6        3.7        1,338       0.7    $    114,191    2.3
Richmond, VA                                16.8        7.5        38            10         3.5        12.0        2.8        1,325       0.9    $     72,385    0.2
Louisville/Jefferson County, KY-IN          15.6        6.7        32             5         3.7        16.6        3.5        1,305       0.2    $     62,634   -0.3
Salt Lake City, UT                          26.9       12.1        43            15         2.1        10.8        2.4        1,281       1.4    $     85,264    4.8
New Orleans-Metairie, LA                    13.5        5.6        36             6         5.0        17.5        4.9        1,274       0.1    $     56,192   -1.1
Camden, NJ                                  19.4        9.4        33             0         4.4        14.9        3.5        1,254       0.3    $     80,338   -1.6
Hartford-East Hartford-Middletown, CT       15.0        8.1        35            -3         4.9        11.0        3.4        1,207       0.0    $     68,326    1.4
Birmingham-Hoover, AL                       16.6        6.9        36             2         2.8        12.2        3.1        1,160       0.2    $     58,067   -0.7
Buffalo-Cheektowaga, NY                     16.1       10.1        32             3         4.2        21.8        4.4        1,125      -0.1    $     55,890   -1.5
Tucson, AZ                                  25.2       11.0        47            13         3.4        13.6        4.7        1,116       2.3    $     53,632   -0.8
Grand Rapids-Kentwood, MI                   18.7        8.4        33             9         3.6        20.2        2.9        1,075       0.0    $     66,911   -0.4
Rochester, NY                               16.6        8.3        29             1         3.8        16.8        4.3        1,067      -0.1    $     57,898   -1.5
Fresno, CA                                  22.2        9.2        51            18         6.8        16.7        7.1        1,024       0.9    $     57,272    0.4
Tulsa, OK                                   18.0        7.4        31             5         2.7        13.3        3.1        1,008       0.4    $     50,704   -0.9
Urban Honolulu, HI                          16.8        1.8        87            19         4.0        19.4        2.1          982       0.3    $     80,546   -2.3
Worcester, MA-CT                            16.6        9.4        40             2         4.8        15.6        3.2          952       0.1    $     76,477   -2.6
Omaha-Council Bluffs, NE-IA                 17.0        6.1        30             3         2.5         9.5        3.0          950       0.0    $     70,767    1.9
Bridgeport-Stamford-Norwalk, CT             16.0        8.7        51           -14         4.8        11.4        3.4          945       0.0    $     87,791    2.3
Tacoma-Lakewood, WA                         21.3       12.8        53            20         5.7        18.3        5.1          939       1.3    $     76,614   -3.7
Greenville-Anderson, SC                     22.4        6.5        38             6         3.0        11.9        2.6          937       0.6    $     57,617   -1.1
Albuquerque, NM                             19.1        9.2        40             5         5.2        10.2        5.0          923       0.2    $     56,695    1.6
Bakersfield, CA                             22.0        9.9        50            19         7.7        18.1        8.0          923       0.9    $     53,086    1.0
Knoxville, TN                               25.7       10.1        40             8         2.8        14.2        3.4          911       0.8    $     53,595   -1.2
McAllen-Edinburg-Mission, TX                18.6        6.7        26             0         8.4        17.2        6.5          903       1.4    $     41,958   -1.1
North Port-Sarasota-Bradenton, FL           32.5        9.4        51            18         2.8        14.1        2.7          882       1.9    $     64,522   -2.1
Albany-Schenectady-Troy, NY                 12.5        8.6        31            -2         3.4        14.4        3.7          878      -0.1    $     68,750   -0.8
El Paso, TX                                 14.8        8.3        38             6         4.9        14.1        3.4          877       1.4    $     49,869    0.4
Lake County-Kenosha County, IL-WI           14.8        3.7        32            -6         4.2        14.8        3.3          869       0.1    $     85,970    1.1
Oxnard-Thousand Oaks-Ventura, CA            18.5        6.3        68            17         4.6        14.8        3.7          867       0.9    $     92,809    1.9
New Haven-Milford, CT                       16.6        9.4        39            -2         5.1        11.2        3.7          856       0.0    $     61,262    0.3
Columbia, SC                                18.9        7.5        33             5         3.3         8.3        2.8          853       0.6    $     54,930   -0.9
Allentown-Bethlehem-Easton, PA-NJ           17.4        9.6        32            -1         5.0        17.0        4.8          845       0.0    $     71,605   -1.8
Baton Rouge, LA                             11.1        3.3        33             5         3.8        12.5        4.9          835       0.1    $     59,113   -0.1
Charleston-North Charleston, SC             24.1        7.2        41             8         3.0        11.6        2.4          816       0.6    $     69,456   -0.4
Cape Coral-Fort Myers, FL                   35.6       10.6        48            21         3.2        14.6        2.9          812       2.0    $     60,821   -2.2
Dayton-Kettering, OH                        17.0        8.3        28             1         4.0        15.6        4.4          805      -0.1    $     54,194    1.2
Greensboro-High Point, NC                   21.5        8.1        37             4         4.2        16.3        4.0          799       1.3    $     50,997    0.4
Stockton, CA                                23.7       10.4        54            15         6.5        17.6        5.9          781       0.9    $     68,418    0.1
Boise City, ID                              26.8       18.9        52            23         2.7        12.5        2.8          774       1.2    $     70,009   -0.8
Elgin, IL                                   15.8        4.7        32            -2         4.7        16.5        3.7          768       0.1    $     84,193   -0.4
Lakeland-Winter Haven, FL                   26.7       10.1        43            17         4.2        18.0        3.5          764       2.0    $     50,390   -3.0
Colorado Springs, CO                        23.3       10.4        45            13         4.2        12.0        3.2          763       0.8    $     87,806   -1.2
Little Rock-North Little Rock-Conway, AR    15.0        5.6        26             1         3.2        10.6        3.3          753       0.5    $     50,965   -0.5
Wilmington, DE-MD-NJ                        14.6        7.6        35             3         4.8        12.1        3.9          735       0.5    $     73,955    1.8
Gary, IN                                    17.7        7.7        30             5         3.8        19.5        4.8          708       0.2    $     62,436   -1.6
Akron, OH                                   15.1        7.1        27            -1         4.1        14.8        4.6          701      -0.1    $     54,117    1.3
Des Moines-West Des Moines, IA              15.1        4.2        31             5         3.5        11.4        2.5          658      -0.2    $     76,305    3.5

Sources: FHFA/BLS/U.S. Census Bureau/Freddie Mac/NAR/Moody’s Analytics/Arch MI

                                                                                                                  Arch Mortgage Insurance Company | 27
Cautionary Note Regarding Forward-Looking Statements

The Private Securities Litigation Reform Act of 1995 provides a “safe harbor” for forward-looking statements. This release or any other written or oral statements
made by or on behalf of Arch Capital Group Ltd. and its subsidiaries may include forward-looking statements, which reflect our current views with respect to future
events and financial performance. All statements other than statements of historical fact included in or incorporated by reference in this release are forward-looking
statements.

Forward-looking statements can generally be identified by the use of forward-looking terminology such as “may,” “will,” “expect,” “intend,” “estimate,” “anticipate,”
“believe” or “continue” or their negative or variations or similar terminology. Forward-looking statements involve our current assessment of risks and uncertainties.
Actual events and results may differ materially from those expressed or implied in these statements. A non-exclusive list of the important factors that could cause
actual results to differ materially from those in such forward-looking statements includes the following: adverse general economic and market conditions; increased
competition; pricing and policy term trends; fluctuations in the actions of rating agencies and the Company’s ability to maintain and improve its ratings; investment
performance; the loss of key personnel; the adequacy of the Company’s loss reserves, severity and/or frequency of losses, greater than expected loss ratios
and adverse development on claim and/or claim expense liabilities; greater frequency or severity of unpredictable natural and man-made catastrophic events,
including pandemics such as COVID-19; the impact of acts of terrorism and acts of war; changes in regulations and/or tax laws in the United States or elsewhere;
the Company’s ability to successfully integrate, establish and maintain operating procedures as well as consummate acquisitions and integrate the businesses
the Company has acquired or may acquire into the existing operations; changes in accounting principles or policies; material differences between actual and
expected assessments for guaranty funds and mandatory pooling arrangements; availability and cost to the Company of reinsurance to manage the Company’s
gross and net exposures; the failure of others to meet their obligations to the Company; changes in the method for determining the London Inter-bank Offered Rate
(“LIBOR”) and the potential replacement of LIBOR and other factors identified in the Company’s filings with the U.S. Securities and Exchange Commission (“SEC”).

The foregoing review of important factors should not be construed as exhaustive and should be read in conjunction with other cautionary statements that are
included herein or elsewhere. All subsequent written and oral forward-looking statements attributable to us or persons acting on our behalf are expressly qualified
in their entirety by these cautionary statements. The Company undertakes no obligation to publicly update or revise any forward-looking statement, whether as a
result of new information, future events or otherwise.
                                                                                                                                                                                           MCUS-B1583A-0522

ARCH MORTGAGE INSURANCE COMPANY® | 230 NORTH ELM STREET GREENSBORO NC 27401 | ARCHMI.COM
© 2022 Arch Mortgage Insurance Company. All Rights Reserved. Arch MI is a marketing term for Arch Mortgage Insurance Company and United Guaranty Residential Insurance Company.
Arch Mortgage Insurance Company is a registered mark of Arch Capital Group (U.S.) Inc. or its affiliates. Realtors is a registered mark of the National Association of REALTORS. The S&P
CoreLogic Case-Shiller Home Price Index is a registered mark of CoreLogic, LLC. FHA HPI is a registered trademark of the Federal Housing Finance Agency.
You can also read