How Many Bedrooms Do You Need? A Real-Estate Recommender System from Architectural Floor Plan Images
←
→
Page content transcription
If your browser does not render page correctly, please read the page content below
Hindawi
Scientific Programming
Volume 2021, Article ID 9914557, 15 pages
https://doi.org/10.1155/2021/9914557

Research Article
How Many Bedrooms Do You Need? A Real-Estate Recommender
System from Architectural Floor Plan Images

 Y.S. Gan ,1 Shih-Yuan Wang,2 Chieh-En Huang,3 Yi-Chen Hsieh,3 Hsiang-Yu Wang,3
 Wen-Hung Lin,3 Shing-Nam Chong,3 and Sze-Teng Liong 3
 1
 School of Architecture, Feng Chia University, Taichung, Taiwan
 2
 Graduate Institute of Architecture, National Chiao Tung University, Hsinchu, Taiwan
 3
 Department of Electronic Engineering, Feng Chia University, Taichung, Taiwan

 Correspondence should be addressed to Sze-Teng Liong; stliong@fcu.edu.tw

 Received 7 March 2021; Revised 16 June 2021; Accepted 28 July 2021; Published 6 August 2021

 Academic Editor: Jianping Gou

 Copyright © 2021 Y.S. Gan et al. This is an open access article distributed under the Creative Commons Attribution License, which
 permits unrestricted use, distribution, and reproduction in any medium, provided the original work is properly cited.
 This paper introduces an automated image processing method to analyze an architectural floor plan database. The floor plan
 information, such as the measurement of the rooms, dimension lines, and even the location of each room, can be automatically
 produced. This assists the real-estate agents to maximise the chances of the closure of deals by providing explicit insights to the
 prospective purchasers. With a clear idea about the layout of the place, customers can quickly make an analytical decision. Besides,
 it reduces the specialized training cost and increases the efficiency in business actions by understanding the property types with the
 greatest demand. Succinctly, this paper utilizes both the traditional image processing and convolutional neural networks (CNNs)
 to detect the bedrooms by undergoing the segmentation and classification processes. A thorough experiment, analysis, and
 evaluation had been performed to verify the effectiveness of the proposed framework. As a result, a three-class bedroom
 classification accuracy of ∼ 90% was achieved when validating on more than 500 image samples that consist of the different room
 numbers. In addition, qualitative findings were presented to manifest visually the feasibility of the algorithm developed.

1. Introduction Despite the fact that there are standard architectural
 symbols used to represent common building components
When designing a building, the most indispensable tool for the and features, architectural drafting can basically be cate-
architect is the floor plan, which also served as an important gorized into three types: process drawings (sketches/sche-
element to provide building guidelines and instructions for matics), construction documents (drafted drawings), and
construction. In brief, a floor plan demonstrates the rela- presentation drawings (illustrated sketches). However, some
tionships between rooms, spaces, and other physical charac- architects artistically add visual interest to the floor plan to
teristics in a visual form. The floor plan usually specifies the convey the intended idea and improve the understanding via
basic layout dimensions (i.e., room size, height, and length) graphic language. Although there are design guidelines for
with an annotated scale factor. The architects often utilize the sketching and drafting of a floor plan, it is subjective to
several symbols or icons to enhance the interpretation of the the individual as the design shows some room for creativity
design of a floor plan, for instance, simple outlines to indicate and flexibility to attract the attention of viewers. Since there
the features of walls, windows, and door openings. Besides, the are plenty of design alternatives for the appearance of a floor
floor plan suggests the arrangement of space by including the plan, it requires substantial effort in rendering, extracting,
details of fixtures and furniture like the stove, bathtub, sofa, and learning, and recognizing the semantic information from the
toilet bowl. Nonetheless, the floor plan design is not limited to human perspective. Therefore, it increases the difficulty
housing; it is applicable to any building type such as the office when processing and interpreting the floor plans using
and Church. image analysis techniques.

2 Scientific Programming

 To the best of our knowledge, this is the first attempt to the amount of space in a floor plan, and determine the exact
comprehensively address and analyze the details of the locations for each room.
rooms from the floor plans. In this paper, a benchmark Albeit the emergence of artificial intelligence, the
framework is provided to automatically determine the lo- existing literature studies in analyzing the architectural
cation and the number of bedrooms from a floor plan. designs with this technology are manageably finite. For
Following the significant success with deep learning example, Bayer et al. [6] suggested a semiautomatic method
frameworks, there has been a surge of interest resolving in to automatically generate the floor plans of specific build-
computer vision-related problems. For instance, inspira- ings. Concretely, the long short-term memory (LSTM) [7]
tional applications developed recently, such as biomedical was utilized as predictive modeling to achieve this task.
field [1], unmanned aerial vehicle navigation [2], facial However, instead of passing the floor plan images to the
expression recognition [3], and soil structure assessment [4]. suggested model structure, the input information requires
Thus, motivated by these works, several deep learning ap- manual human effort to extract certain information from
proaches are applied in the bedroom detection task herein to each sample image. Besides, the trained model insufficiently
facilitate the automatic computational image processing describes the detailed contextual characteristics of the floor
analysis. plan, such as the actual position of the basic building blocks
 In summary, the main contributions of this paper are (i.e., walls, doors, and windows). A similar work that per-
highlighted briefly as follows: forms the floor plan generation is conducted by [8]. Yet, a
 deeper understanding of the current development state of
 (1) Application of a series of preprocessing techniques to
 image processing approaches is integrated to resolve for the
 improve the image quality, such as noise removal,
 best placement solution. The system is built on the Grass-
 wall thickness adjustment, and image scaling.
 hopper environment to make the user interface design
 (2) Proposal of a visual understanding mechanism to legible and easy to use.
 distinguish the bedroom from the floor plan by On the other hand, Liu et al. [9] proposed a novel
 implementing the segmentation and classification convolutional neural network (CNN) architecture, namely
 processes. FloorNet, to reconstruct the 3D floor plans by physically
 (3) Comprehensive experimentation on the dataset to scanning the indoor spaces over a visual display. Concretely,
 verify the effectiveness of the algorithms evaluated. a triple-branch hybrid design is implemented to simulta-
 Both the qualitative and quantitative results are neously process the 3D coordinate points, 2D floor plan, and
 presented. images captured, to form the final floor plan. Thus, a dataset
 that comprises ∼ 155 residential house layouts has been
 The remainder of the paper is organized as follows: a
 created. This work provides a reverse engineering solution
review of related literature is presented in Section 2.
 on the floor plan image, whereby they did not process on the
Subsequently, Section 3 describes the complete framework
 existing images; instead, they introduce a series of image
in detail, including the preprocessing method, the con-
 analyses to generate a new floor plan image. The main in-
figuration of experiment settings, and performance metrics
 tuition of this work is to cope with the absence of floor plan
for result validation. Section 5 reports and analyzes the
 design problem, especially in the region like North America.
experimental results. Finally, conclusions are drawn in
 Recently, an improved method that can generate the floor
Section 6.
 plan via 3D scanning with higher accuracy and higher speed
 is introduced by [10]. Specifically, the proposed pipeline,
2. Related Work namely, Scan2Plan demonstrated outstanding results when
 evaluated on the publicly available Structured3D [11] and
A residential floor plan is a key element to provide the BKE [12] datasets.
prospective buyer the essence of the property regarding the De las Heras et al. [13] designed a structural element
internal amenity, the outlook, and the interaction of the recognition system to detect the wall and room from four
spaces that are viewed from above. The floor plan serves as datasets with different ground-truth characteristics. The
the most essential guide for the home buyer to consider proposed approach first extract the main entities using
purchasing the property [5]. An eye-catching and expressive statistical segmentation, such as the walls, door, and win-
floor plan contains a colorful design, accurate scale, basic dows. Then, the structural compositions of the building are
furniture icons, and a clear flow of spaces. A residential identified and distinguished using an image recognition
project has a briefer form and contains lesser information technique. The authors claimed that the proposed algorithm
compared to a commercial project as it is a simple diagram is adaptable to any graphical representation, as it can extract
that offers a conceptual starting point. Note that there is no the structural elements without prior knowledge of the
standard real-estate floor plan and thus the oversimplified or modeling conventions of the plan. Nevertheless, further
overprofessional design may cause confusion to the buyer. analysis and classification regarding the type or function of
Therefore, there is a lack of an automatic system to relate the the room are not presented in the work. On the other hand,
architectural design to computer vision technology. Spe- Khade et al. [14] focused on extracting the outer shape of the
cifically, this automatic task is useful in assisting the buyers floor plan. A series of algorithms is suggested, in which
to quickly determine the number of bedrooms in each floor geometric features such as area, corners, quadrants, distance,
plan, classify the space according to the floor plan, analyze slope, and angle are involved. To evaluate the robustness of
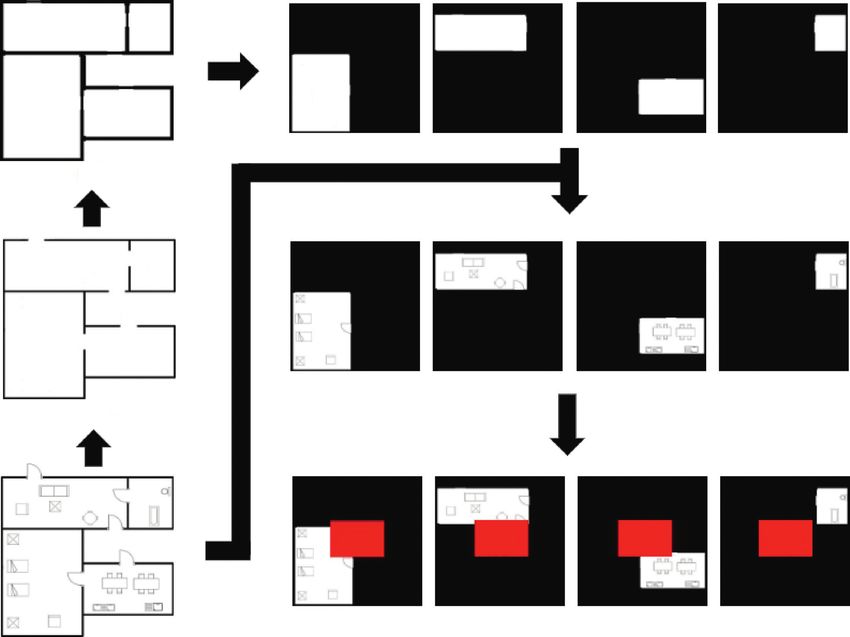
Scientific Programming 3

the proposed framework, the experiments are tested on both 3. Proposed Method
the original and rotated images of a synthetic dataset.
 Besides, [15] introduced a method to detect the elements The proposed algorithm aims to determine the existence
of the walls and identify the key objects, as well as deter- of the bedroom and its respective location, as well as
mining the characters from the floor plan images. The computing the number of bedrooms from an architectural
methodologies to accomplish this task are to adopt a fully floor plan image. Figure 1 lists the proposed framework of
convolutional network (FCN) model and an optical char- the proposed method. In brief, it incorporates four pri-
acter recognition (OCR) technique. In brief, OCR is to mary stages: wall extraction, wall thickening and door gap
retrieve meaningful room labeling. Experiments were car- closing, room partitioning and decor item retrieval, and
ried out on two datasets, namely, a publicly available dataset bedroom classification. The details of each step are dis-
(CVC-FP) and self-collected from the real-estate website. cussed in this section by providing greater details in terms
The experiments were performed on the datasets were wall of their respective mathematical derivations and pseu-
segmentation, object detection (door, sliding door, kitchen docodes. For better visualization, Figure 2 depicts the
oven, bathtub, sink, and toilet), and text recognition. Al- conceptual diagram for each stage. Note that, the dataset
though promising wall segmentation was reported in the involved in the experiment is Robin because the decor
paper, the proposed approach did not compare to the state of items shown on the images are clear and do not contain
the art. Besides, the number of testing samples to evaluate any text information.
the object detection and text recognition performance was
relatively few ( < 50 images). Thus, this work does not 3.1. Wall Extraction. The first step is to acquire the wall lines
provide conclusive empirical evidence to verify the effec- whilst removing the decor items. Prior to that, all the images
tiveness of the proposed method. are converted from RGB colorspace to grayscale. The
 On another note, Ahmed et al. [16] recognized the original RGB image is shown in Figure 3(a) and the grayscale
room by differentiating the walls with different thicknesses image is illustrated in Figure 3(b). Then, Otsu’s algorithm is
(i.e., thick, medium, and thin). They also pointed out that employed to perform the thresholding technique to enhance
the wall thickness (i.e., thin wall) greatly affected the wall image contrast. Otsu’s algorithm is one of the simplest
detection and hence influenced the recognition perfor- methods to categorize the pixel intensity into two classes and
mance. The following year, the same research group [17] the output is generated by minimizing the intraclass variance
presented an automatic system to analyze and label the of each image. It is noticed that the decor items are
architectural floor plans. Particularly, the SURF [18] feature appearing in thinner lines compared to the walls. Therefore,
descriptor is utilized to spot the building element in en- a simple morphological image processing method, namely,
hancing semantic information extraction. This paper ex- closing, is adopted to remove the objects with thin lines.
tends the previous paper by dividing the rooms into several The closing morphology operation of image A by the
subpartitions for the cases of a shared room. However, structuring element B is the composite of erosion and di-
there is some false detection especially when the text lation operations, defining as follows:
touched the graphics component. Later, Ahmed et al. [19]
separated the wall and text in the image using simple A · B � (A ⊕ B) ⊖ B, (1)
morphological erosion and dilation techniques. As a result,
a promising result of the recall of 99% is exhibited when where X ⊕ Y denotes the dilation operation of image X by the
evaluating ∼ 90 images. The prevalence performance structuring element Y. On the other hand, X ⊖ Y denotes the
mostly contributed to the success in removing the thin lines erosion operation of image X by the structuring element Y.
especially the text touching the lines. In brief, the dilation and erosion operations can be defined
 Recently, Goyal et al. [20] proposed SUGAMAN (Su- as follows, respectively:
pervised and Unified framework using Grammar and An- X ⊕ Y ≡ (x + y) | ∀ x in X, y in Y ,
notation Model for Access and Navigation) to briefly (2)
describe the indoor environment in natural language from X ⊖ Y ≡ x ∈ Z2 | (x + y ∈ X, ∀y in Y) .
the building floor plan images. They represented the room
features by adopting a local orientation and frequency de- By doing so, the decor items can be eliminated, in the
scriptor (LOFD). Then, a single-layer neural network with 10 meantime, preserving the wall lines, as illustrated in
neurons is employed to learn the room annotations for room Figure 2(b). Besides, Figure 3(c) shows the output image
classification. To examine the effectiveness of the proposed after extracting the wall lines on another sample, whereby
algorithm, experiments are conducted on a dataset with lesser furniture and elements exist in this 3-bedroom image.
more than 1000 image samples. Results demonstrated that Since the decor items are represented by a set of simple
the proposed method outperformed the state of the art by synthetic architectural symbols made up of straight lines and
attaining higher classification accuracy when identifying the simple shapes, this wall extraction process occupies rela-
decor items (i.e., bed, chair, table, sofa, etc.). However, there tively lesser computational cost and algorithm complexity.
are some scenarios where the proposed method incorrectly
classifies the type of the room (i.e., kitchen vs. room). Be- 3.2. Wall Thickening and Door Gap Closing. As there are
sides, the result of floor plan creation based on LOFD is noticeable door gaps after performing the wall extraction in
discouraging. the previous step (i.e., Figure 2(b)), the gaps are filled by
4 Scientific Programming

 Wall extraction

 Wall line thickening
 and
 Door gaps linking

 Room partitioning

 Decor items retrieval

 Bedroom identification

 Figure 1: The proposed pipeline incorporates five stages.

 (d)

 (c)

 (e)

 (b)

 Yes No No No (f)

 (a)
Figure 2: Overall process flow illustration: (a) original dataset; (b) wall extraction; (c) wall line thickening and door gaps linking; (d) room
partitioning; (e) decor items retrieval, and (f ) bedroom identification.
Scientific Programming 5

 (a) (b) (c)

 (d) (e) (f )

 (g)

Figure 3: Output generated after performing each image transformation process: (a) original image; (b) pixel binarization; (c) wall
extraction; (d) image dilation; (e) image resize to 400 × 400; (f ) edge detection using FAST algorithm, and (g) door gaps linking.

thickening the walls to facilitate the gaps connection. A 3.3. Room Partition and Decor Items Retrieval. This step is to
dilation morphological process is performed to improve the split the multiple rooms from each floor plan into individual
visual appearance of the wall lines, as shown in Figure 3(d). rooms. Since the floor plan images in Robin are generated by
The dilation operation is expressed as the computer, it is found that there is some absurdly small
 size of rooms in a few floor plan images. Therefore, if the
 A ⊕ B � ∪ Ab . (3) detected room region occupies less than 300 pixels, it will be
 b∈B
 eliminated from the next processing step. Figure 2(d) il-
 Since the resolution for the images in the Robin lustrates the segmented rooms from a floor plan.
dataset is varied, the size is standardized such that the After identifying and filtering the rooms, the rooms are
height and width are having the same length, namely, overlapped with the original floor plan image, such that the
400 × 400, as shown in Figure 3(e). Next, the pairs of the decor items appear in every single room. Figure 2(e) il-
door gaps coordinates for the linkage are identified. It can lustrates the insertion of the original decor items on the
be achieved by applying Hough transform [21] and the respective partitioned rooms. The pseudocode to realize the
FAST algorithm for edge detection. Subsequently, the room partition and decor items retrieval steps is shown in
width and the exact position of the door gaps are obtained, Algorithm 2. In brief, lines 1 to 27 detect the single rooms by
as shown in Figure 3(f ). identifying the pixel intensity values. A room should be
 The algorithm details to acquire the wall lines infor- encircled by a continuous pixel value of 0 in a rectangle
mation are shown in Algorithm 1. In brief, there are three shape. Concretely, the program will scan the entire image
inputs required to link the door gaps, namely, the position, from left to right and top to bottom, to search for the first
width, and the total number of the door gaps. Lines 1 and 2 appeared pixel intensity value of 255. Then, that particular
in Algorithm 1 scan all the pixels in the image. Line 3 pixel is arbitrarily set to T, where T is initially defined as 1.
compares two coordinates to decide if they are the pair of the This specific pixel is treated as a reference point such that the
door gap, depending on the predefined width parameter. pixel values of all the four directions (i.e., top, bottom, left,
Lastly, line 4 links the pair of door gap coordinates, as shown and right) are set to 1. This pixel value updating step will be
in Figure 3(g). terminated until the pixel value 0 is met. Consequently,
 Figure 2(c) shows the output of the door gaps linking another scanning to search for the next pixel with an in-
after increasing the thickness of the wall. tensity of 255 will be performed. If found, that particular
6 Scientific Programming

 Input: D(i, : ), D(j, : ) ⟵ coordinate points of the door gaps
 W ⟵ width of the door gaps
 N ⟵ total number of door gaps
 Output: the door gaps are closed and independent rooms can be identified
 (1) for i � 1; i ≤ N; i + + do
 (2) for j � 1; j ≤ N; j + + do
 (3) if |D(i, : ) − D(j, : )| ≤ W then
 (4) Link D(i, : ) and D(j, : )
 (5) else
 (6) break.

 ALGORITHM 1: Door gap closing.

 Input:
 A(i, j) ⟵ coordinate point of an independent room image
 m ⟵ x-axis image size of an independent room
 n ⟵ y-axis image size of an independent room
 Output:
 T ⟵ number of independent rooms
 (1) v � 1;
 (2) T � 1;
 (3) While v ≠ 0 ▷ v � 1 indicates that a new area has been found
 (4) do
 (5) v � 0;
 (6) b � 0;
 (7) for i � 1; i ≤ n; i + + do
 (8) for j � 1; j ≤ m; j + + do
 (9) if A(i, j) �� 255 ▷ pixel intensity of 255 indicates white
 (10) then
 (11) A(i, j) � T;
 (12) v � 1;
 (13) break
 (14) Q � 1;
 (15) While Q ≠ 0 ▷ Q � 1 indicates there may be missing points
 (16) do
 (17) Q � 0;
 (18) for i � 1; i ≤ n; i + + do
 (19) for j � 1; j ≤ m; j + + do
 (20) If A(i, j) �� T then
 (21) Convert the pixel values to 255 in the top, bottom, left, and right directions of points A(i, j) into T
 (22) This process is terminated when it encounters 0.
 (23) if a pixel is converted then
 (24) Q � 1;
 (25) else if A(i, j) �� 255 then
 (26) Determine whether there is T before 0 is encountered in the four directions of point A(i, j).
 (27) T � T + 1
 (28) for i � 1; i ≤ T; i + + do
 (29) if there is i on the boundary or the total number of pixels with a value of i is less than 300 ▷These two cases are not considered as
 a room
 (30) then
 (31) continue;
 (32) else
 (33) Convert all i to 0 and convert other values to 255.
 (34) Stack the decor items on the respective detected rooms.

 ALGORITHM 2: Room segmentation and decor items retrieval.

Scientific Programming 7

pixel is set to the value of T � T + 1, which is 2. Hence, it will f(x) � max(0, x). (5)
be treated as the reference point again to update the sur-
rounding pixels with value T + 1. The above-mentioned (2) Pooling: To downsample the image along the spatial
steps are repeated until pixel intensity 255 will no longer be dimensions (i.e., width and height). This allows di-
found. Intuitively, the newly found pixel with the intensity of mension reduction and enables the computation
255 is regarded as the new room definition. As such, the process to be less intensive.
resultant T value denotes the total number of the new room
 The k-th unit of the image feature in the pooling
formed in an image. Then, lines 28 to 33 determine if the
 layer is expressed as
room satisfies the room size requirement. Particularly, if the
room has an area size of fewer than 300 pixels, the room is Poolk � f(down(C) ∗ W + b), (6)
ignored. This is because there are some unusual rooms as the
images are artificially generated by the computer. Finally, where W and b are the coefficient and bias, re-
line 34 stacks the decor items to the individual detected spectively. down(·) is a subsampling function:
rooms.
 down(C) � max Cs,l |s ∈ Z+ , l ∈ Z+ ≤ m . (7)

3.4. Bedroom Classification. This stage differentiates the Cs,l is the pixel value of C in e and m indicates the
rooms detected into bedroom/nonbedroom categories. The sampling size.
convolutional neural network (CNN) is employed as both (3) Fully connected: All the previous layer and the next
the feature extractor and classifier for the bedroom classi- layer of neurons are linked. It acts like a classifier
fication. Intuitively, the shape, characteristics, patterns of a based on the features from the previous layer.
bed are the key features to decide if the image is a bedroom/ (4) Dropout: The neurons are randomly dropped out
nonbedroom. Thus, CNN architectures are expected to learn during the training phase. This can avoid overfitting
the features of the bed in order to make the correct phenomena and enhance the generalization of the
predictions. neural network trained.
 Several pretrained neural networks (i.e., AlexNet [22],
ResNet [23], SqueezeNet [24], and GoogLeNet [25]) are Figure 2(f ) shows the categorization of each partitioned
utilized with slight modification. Note that, most of the room to bedroom or nonbedroom after adopting the CNN
parameters existing in the networks are transferred to adapt method.
and learn the new characteristics of the floor plan images.
Specifically, the parameters will be fine-tuned automatically 4. Dataset Description
throughout the learning progress. Concretely, these network
architectures are comprised of five types of operation: Thus far, there are limited publicly available datasets that
convolution, ReLU, pooling, fully connected, and dropout. contain the architectural floor plan images. For instance,
The bedroom images are first standardized to a certain size these four datasets: CVC-FP [26], SESYD [27], Robin [28],
(i.e., ℵ × ℵ). and Rent3D [29] usually served as the experimental data in
 (1) Convolution and ReLU: The image performs a dot academic studies. The detailed information of these datasets
 product between a kernel/weight and the local re- is shown in Table 1 and the sample images are illustrated in
 gions of the image. This step can achieve blurring, Figure 4. It is observed that the databases are largely limited
 sharpening, edge detection, and noise reduction on their own. Concisely, the floor plan images may vary in
 effect. ReLU is an elementwise activation function different aspects: (1) building types (i.e., theater, school,
 and is usually applied as the thresholding technique house, and museum); (2) multidimensional images (i.e., 2D
 to eliminate the neurons that are playing a vital role and 3D); (3) representation types (i.e., sketches and com-
 in discriminating the input and is essentially puter-aided design); and (4) furniture layouts (i.e., walls,
 meaningless. windows, doors, sofa, and stairs). Particularly, Rent3D and
 CVC-FP are the scanned images. The contents are mostly in
 Each eij pixel in the image is defined as text, rather than displaying the furniture icon. On the other
 hand, Robin and SESYD comprised the computer-generated
 elij � fl xlij + bl |i � 1, 2, . . . , ℵ, j � 1, . . . , ℵ , floor plan with lesser image noise, compared to the other two
 datasets. However, the wall thickness of SESYD is relatively
 where xlij � Σm−1 m−1 l l−1
 a�0 Σb�0 wab y(i+a)(j+b) ,
 thin. Therefore, it may lead to some errors during the wall
 (4) segmentation process. Based on the pros and cons of the
 datasets discussed above, only the Robin dataset is con-
 l indicates the layer, xlij is the pixel-value vector sidered as the experimental data in this paper.
 corresponding to eij pixel, fl is the ReLU activation From the pros and cons summarized in Table 1, we opt to
 function, wl is the coefficient vector, and bl is the bias select the Robin dataset as the experiment data to evaluate
 determined by the feature map. the proposed framework. In short, the repository of the
 Thus, for an input x, the ReLU function can be building plans (Robin) dataset can be categorized into three
 indicated as main classes, namely, 3 rooms, 4 rooms, and 5 rooms. The
8 Scientific Programming

 Table 1: Detailed information of the four floor plan databases.
 CVC-FP SESYD Robin Rent3D
Presence of text ✓ 7 7 ✓
Total number of images 122 10 510 250
 Table 7 ✓ ✓ 7
 Chair 7 ✓ ✓ 7
 Sink ✓ ✓ ✓ ✓
 Toilet bowl ✓ ✓ ✓ ✓
Item
 Bathtub ✓ ✓ ✓ ✓
 Bed 7 ✓ ✓ 7
 Cabinet 7 ✓ 7 7
 Sofa 7 ✓ ✓ 7
Fake/generated 7 ✓ ✓ 7
Real/scan ✓ ✓ 7 ✓

 1040

 CHAMBRE 2
 10,69 m2 CHAMBRE 1
 13,95m2

 DEGT.
 PLACARD

 WC
 1,53
 4,64m2 D. 5,16m2 BALCON
 1490

 14,60 m2

 CUISINE
 BUREAU
 13,06m2
 9,11m2 DEGT. 5,64m2
 PLACARD

 SEJOUR 39,28 m2 REPAS

 TERRASSE
 COUVERTE
 6,84m2
 Plan du Rez de Chaussée
 échelle 1/100é soit 1cm pour 1 m
 alain meunier architecte d.p.l.g.

 (a) (b)

 N
 B Kitchen
 14′9″ × 6′10″
 Bedroom 4.50 × 2.08 m
 16′11″ × 11′5″
 5.16 × 3.48 m

 Bathroom Bedroom
 8′2″ × 8′1″ 12′ × 8′6″
 2.49 × 2.46 m 3.66 × 2.59 m

 B

 Bathroom Bathroom
 8′2″ × 5′3″ 10′ × 6′7″
 2.49 × 1.60m 3.05 × 2.01m

 Reception room
 23′3″ × 16′8″ Bedroom
 7.09 × 5.08 m 14′6″ × 12′3″
 4.42 × 3.73 m

 (c) (d)

 Figure 4: Sample images from the four datasets: (a) CVC-FP, (b) SESYD, (c) Robin, and (d) Rent3D.
Scientific Programming 9

images for the three classes compose an equal number of the TP
sample which are 170 each. The item contained in the images Precision ≔ , (11)
 TP + FP
includes table, chair, sink, toilet bowl, bathtub, bed, and sofa.
The spatial resolutions for the images are varied, with the where
average sizes of 1085 × 1115, 1188 × 1280, and 1593 × 1859 (1) TP (true positive): the model correctly classified the
for 3 rooms, 4 rooms, and 5 rooms, respectively. The dataset bedroom
contains both the grayscale and colored images. However, all
 (2) TN (true negative): the outcome where the model
the images are portrayed in monochromatic color, in which
 correctly predicts that it is not a bedroom
only actual white and black pixels are presented. The il-
lustration of the sample images and the details of each image (3) FN (false negative): the event where the model does
category are portrayed in Table 2. Note that the images not predict the bedroom correctly, while in fact, it is a
shown are randomly selected from the dataset. The image bedroom
data that support the findings of this study are openly (4) FP (false positive): the test result indicates that it is a
available in [30]. bedroom, but it is not
 Nonetheless, there is no textual description provided for
this floor plan dataset. Since this dataset is synthetic data and
the elements are aggregated automatically, some image 5.2. Classification Performance and Analysis. All the 510
samples may not be in accordance with the real-world floor plan images from the Robin dataset are used as the
scenario. For example, it can be seen that the sample image experimental data. The bedroom classification results using
#1 looks more normal compared to that of the sample image five different CNN architectures (i.e., AlexNet, GoogleNet,
#2. For example, the sample image #2 for the 3 rooms does SqueezeNet, ResNet-101, and ResNet-50) are shown in
not have any object/graphics in one of the rooms. As for the Table 4. Note that the number of epochs for each CNN is set
sample image #2 for the 4 rooms, three rooms are encircled to the range of 10 to 100. The learning rates and the min-
by a big squared room. Lastly, for the sample image #2 for ibatch size are set to 0.0001 and 128. The details of the
the 5 rooms, to enter one of the bedrooms, it has to go configuration of the CNN architecture and parameter values
through another bedroom. Besides, the only route to the are listed in Table 5.
kitchen is to pass through a bathroom. The three types of images are merged into a composite
 Surprisingly, among the 510 images in the Robin dataset, dataset to provide a fair training and testing experiment
22 images do not contain any bedroom furniture. Thus, the environment. Concisely, in the classification stage, 5-fold
22 images are regarded as a 0-bedroom category. Most of the cross-validation is utilized to validate the performance of the
images comprise one bedroom, namely, 391 images. The transfer learning model on an unseen image sample. Thus,
maximum number of bedrooms in the dataset is two, in for each fold, 510/5 � 102 images are treated as the testing
which up to 97 images contain two bedrooms. An overview sample, while the remaining 408 images served as the input
regarding the number of the bedroom with their respective to the architecture for parameter training (i.e., weights and
sample images is illustrated in Table 3. biases). This process will be repeated 5 times until all the
 images have been tested at least one time. Note that, there is
5. Experiment Results and Discussion no overlapping data between the training and testing sets.
 Table 4 reports one of the highest classification per-
5.1. Performance Metric. There are two evaluation metrics to formances obtained among the epoch range. It is observed
validate the performance of the proposed framework, that the highest accuracy exhibited is produced by Goo-
namely, accuracy and F1-score [31]. Specifically, accuracy is gLeNet, in which the accuracy and F1-score obtained are
the most intuitive performance measure and shows how 98.40% and 98.80%, respectively. From Table 4, it can be seen
accurate and precise the result is generated. Since the that although ResNets are the two largest architectures
number of bedrooms is inconsistent in the Robin dataset, among all the CNN methods, the classification results are the
F1-score is used to tackle to imbalance class problem and to lowest (i.e., accuracy � 81.40% and F1-score � 88%). This
avoid the bias phenomena. Mathematically, these two implies that learning the bedroom features leads to an
metrics can be expressed as overfitting phenomenon when a huge CNN is employed.
 TP + TN Nevertheless, this binary classification task with limited data
 Accuracy :� , (8) samples has demonstrated that the transfer learning tech-
 TP + FP + TN + FN
 nique is capable of training the discriminant features on
and small-size data.
 Precision × Recall To provide further insights into the classification
 F1 − score :� 2 × , (9) performance, a detailed investigation is done regarding
 Precision + Recall
 some correct and incorrect predicted bedroom images.
where Since there are a total of 510 images in the dataset, Table 6
 TP displays partial numerical results that are randomly se-
 Recall ≔ , (10) lected from the dataset. Among the samples, 8 cases
 TP + FN
 produce the F1-score of 100%, whereas 2 cases generate
and 66.67%. The reason for false detection may be because of
10 Scientific Programming

 Table 2: Detailed information of Robin dataset [28].
 3 rooms 4 rooms 5 rooms
Image number 170 170 170
 (Average) 1085 × 1115 1188 × 1280 1593 × 1859
Resolution (Minimum) 603 × 1194 793 × 1228 1116 × 2365
 (Maximum) 1204 × 1244 1444 × 2050 2404 × 2380

Sample picture (#1)

Sample picture (#2)

 Table 3: The number of bedroom in the Robin dataset [28].
 0 bedrooms 1 bedroom 2 bedrooms
Image number 22 391 97

Sample picture

Table 4: Performance % of the bedroom classification when utilizing five convolutional neural networks, in terms of accuracy (Acc) and
F1-score (F1)
Method Epoch Acc F1
AlexNet 60 90.5 97.5
GoogLeNet 30 98.4 98.8
ResNet-50 60 81.8 88
ResNet-101 30 81.8 87.2
SqueezeNet 70 96.6 97.9
Scientific Programming 11

 Table 5: Configuration type and parameters of CNN models. fewest parameters (1 million), but the network depth is
Configuration type Parameter
 ∼ 2.5 times larger than the AlexNet. The deepest network is
 ResNet-101, which has a depth of 347. As the largest network
Optimizer SGDM
 that contains the largest number of the learnable parameter
Momentum 0.9000
InitialLearnRate 0.0001 is AlexNet size of 61 million, AlexNet is the shallowest
LearnRateSchedule Piecewise network among the networks presented (depth size of 25).
LearnRateDropFactor 0.2000 The proposed method is capable of tackling the images
LearnRateDropPeriod 10 with different orientations as the transfer learning archi-
L2Regularization 0.0001 tecture is designed such that the model is invariant to
GradientThresholdMethod L2 norm orientation. Besides, the architecture learns the discrimi-
GradientThreshold Inf native features automatically from the floor plan images
MaxEpochs [10, 100] while achieving high performance. Moreover, with a limited
MiniBatchSize 128 training sample, the classification performance is promising,
Verbose 1
 namely, F1-score � 98.8% when employing GoogLeNet. On
VerboseFrequency 50
ValidationPatience Inf
 the other hand, the epoch number required for model
Shuffle Once training is relatively few ( 80%.
learned in this network are insufficiently precise. Note that, methods #1-#2 evaluated the algorithms on the
 The detailed properties of all the network architectures R2V dataset [33], method #3 evaluated on Rent3D dataset
are tabulated in Table 7, which include the depth, size, and [29], and methods #4–#7 evaluated on the CVC-FP dataset
the number of the learnable parameter in the network. [26]. The details of the datasets are summarized in Table 1.
Amongst, SqueezeNet occupies the least size (5 MB) and the Notably, the proposed method herein is capable of
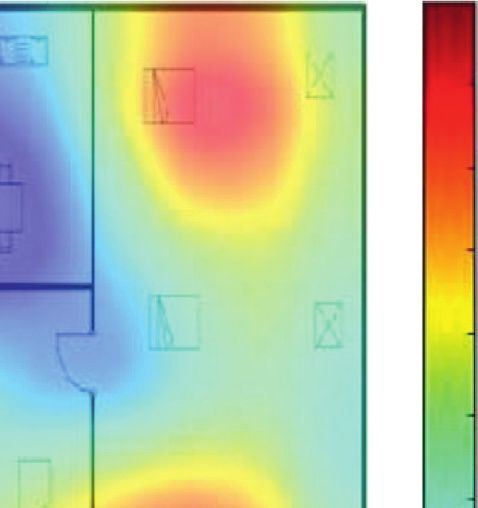
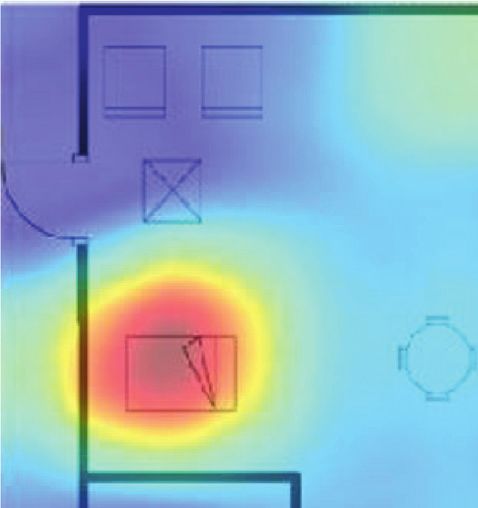
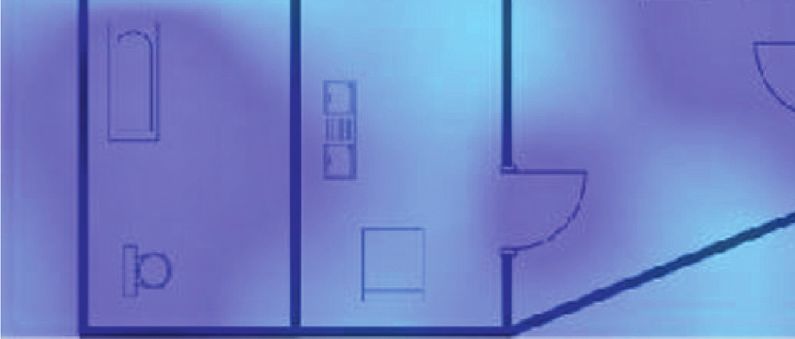
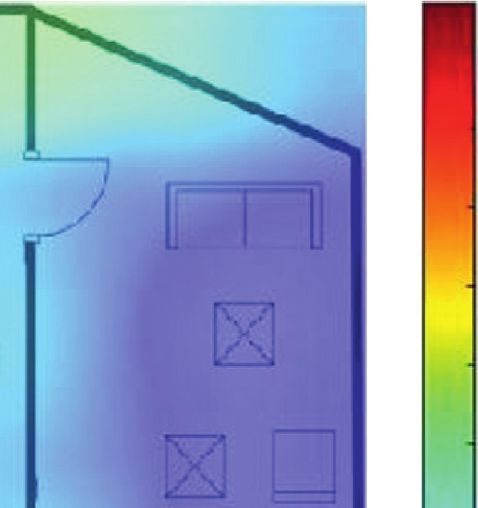
12 Scientific Programming

 (a) (b)

 Figure 5: Activations of GoogLeNet when the image (a) does not contain a bed and (b) contains a bed.

 (a) (b)

 Figure 6: Activations of ResNet when the image (a) does not contain a bed and (b) contains a bed.

 Table 7: The properties of the network architecture.
Method Depth Size (MB) Parameter (millions)
AlexNet 25 244.66 60.95
GoogLeNet 144 29.06 6.99
ResNet-50 177 103.68 25.50
ResNet-101 347 180.34 44.44
SqueezeNet 68 5.23 1.23

 Table 8: Confusion matrix of bedroom number calculation when utilizing GoogLeNet as the feature descriptor.
 Predicted
 0 1 2 3
 0 22 0 0 0
 1 20 355 14 2
Desired
 2 0 15 80 2
 3 0 0 0 0

detecting all the rooms and exhibiting an accuracy of 98% maximum and minimum area of each room; (6) the total
when detecting the bedroom. number of doors; and (7) the total number of doors in each
 Moreover, the recommender system can provide addi- room. Taking Figure 7(a) as an example, the list of detailed
tional details regarding the floor plan information. In statistics is tabulated in Table 10. Note that, the original floor
summary, a list of statistics can be generated, such as (1) the plan in the dataset did not provide the real-world scale. Thus,
total built-up area of the floor plan; (2) the total number of the unit of the built-up area presented here is pixels2 . The
bedroom and their area; (3) the total number of nonbed- unit (i.e., pixels2 ) can be easily converted to the real-world
room and their area; (4) the position of the bedrooms; (5) the measurement (i.e., square feet, m2 ) by a ratio proportion.
Scientific Programming 13

 1
 1
 0.9
 0.9
 0.8
 0.8

 0.7 0.7

 0.6 0.6

 0.5 0.5

 0.4 0.4

 0.3 0.3
 0.2 0.2
 0.1 0.1
 0 0
 (a) (b)

 Figure 7: The Grad-CAM visualization to localize class-discriminative regions.

 Table 9: Performance comparison of the bedroom detection and room detection.
No. Method Bedroom detection Room detection Room-type detection
1 [33] 0.89 — —
2 [34] 0.83 — —
3 [34] 0.75 — —
4 [21] — 0.85 —
5 [17] — 0.89 —
6 [13] — 0.91 —
7 [35] — 0.86 0.94
8 Ours 0.98 1 —

Table 10: List of statistics generated by the recommender system. architectural floor plan images. Particularly, an excellent
 bedroom classification accuracy of 98.4% and F1-score of
Statistics Values 98.8% are achieved when employing the state-of-the-art deep
Total built-up area 118,278 pixels2 learning techniques. Moreover, the visual presentation re-
Total number of bedrooms 1 garding the cues of the correctly detected bedroom category
Bedroom’s area 56,765 pixels2 further verifies the effectiveness of the approach.
Total number of nonbedrooms 2
 As future work, this framework can be extended to
Nonbedroom’s area [46629, 14884] pixels2
Position of the bed West
 recognize other function rooms, such as the bathroom,
Maximum area of room 56,765 pixels2 dining room, or living room. Besides, the binary classifi-
Minimum area of room 14884 pixels2 cation task and the limited data samples point towards the
Total number of doors 4 studies on the new design of the shallow neural network.
Number of doors in each room [0, 3, 3] Note that, some previously published works investigated the
 floor plan with both the text and graphics. However, the
 experiments presented in this work did not consider the
6. Conclusion images with text, and this points towards an important
 direction for future research. Therefore, it is also worth
This paper presents a novel framework to automatically investigating the optical character recognition (OCR)
identify the location and the number of bedrooms from the technique on other types of floor plan images.
floor plan images. Some traditional and data-driven image
processing techniques are applied. In brief, Otsu’s thresh- Data Availability
olding and morphological operations are employed to pre-
process the image. Then, the rooms are extracted using the The image data that support the findings of this study are
Hough transform and FAST algorithm. Finally, some popular openly available in https://github.com/gesstalt/ROBIN.
convolutional neural network architectures are utilized to
determine if the detected room is the bedroom. The quan- Conflicts of Interest
titative performance results suggest that the proposed pipeline
is feasible in recommending the house property from The authors declare that they have no conflicts of interest.
14 Scientific Programming

Acknowledgments [15] S. Dodge, J. Xu, and B. Stenger, “Parsing floor plan images,” in
 Proceedings of the 2017 Fifteenth IAPR International Con-
This work was funded by Ministry of Science and ference on Machine Vision Applications (MVA), pp. 358–361,
Technology (MOST) (Grant nos. MOST 109-2221-E-035- IEEE, Nagoya, Japan, May 2017.
065-MY2, MOST 108-2218-E-035-018-, and MOST 108- [16] S. Ahmed, M. Liwicki, M. Weber, and A. Dengel, “Improved
2218-E-009-054-MY2). automatic analysis of architectural floor plans,” in Proceedings
 of the 2011 International Conference on Document Analysis
References and Recognition, pp. 864–869, IEEE, Washington, DC, USA,
 September 2011.
 [1] F. Isensee, P. F. Jaeger, S. A. A. Kohl, J. Petersen, and [17] S. Ahmed, M. Liwicki, M. Weber, and A. Dengel, “Automatic
 K. H. Maier-Hein, “Nnu-net: a self-configuring method for room detection and room labeling from architectural floor
 deep learning-based biomedical image segmentation,” Nature plans,” in Proceedings of the 2012 10th IAPR International
 Methods, vol. 18, no. 2, pp. 203–211, 2021. Workshop on Document Analysis Systems, pp. 339–343, IEEE,
 [2] H. Lee, H. Ho, and Y. Zhou, “Deep learning-based monocular Washington, DC, USA, March 2012.
 obstacle avoidance for unmanned aerial vehicle navigation in [18] H. Bay, T. Tuytelaars, and L. Van Gool, “Surf: speeded up
 tree plantations,” Journal of Intelligent and Robotic Systems, robust features,” Computer Vision - ECCV 2006, Springer, in
 vol. 101, no. 1, pp. 1–18, 2021. Proceedings of the European conference on computer vision,
 [3] K.-H. Liu, Q.-S. Jin, H.-C. Xu, Y.-S. Gan, and S.-T. Liong, pp. 404–417, Springer, Graz, Austria, May 2006.
 “Micro-expression recognition using advanced genetic algo- [19] S. Ahmed, M. Weber, M. Liwicki, and A. Dengel, “Text/
 rithm,” Signal Processing: Image Communication, vol. 93, graphics segmentation in architectural floor plans,” in Pro-
 Article ID 116153, 2021. ceedings of the 2011 International Conference on Document
 [4] E. V. Lavrukhin, K. M. Gerke, K. A. Romanenko, Analysis and Recognition, pp. 734–738, IEEE, Washington,
 K. N. Abrosimov, and M. V. Karsanina, “Assessing the fidelity DC, USA, September 2011.
 of neural network-based segmentation of soil xct images [20] S. Goyal, S. Bhavsar, S. Patel, C. Chattopadhyay, and
 based on pore-scale modelling of saturated flow properties,” G. Bhatnagar, “Sugaman: describing floor plans for visually
 Soil and Tillage Research, vol. 209, Article ID 104942, 2021. impaired by annotation learning and proximity-based
 [5] Williamsburg, “Why are floor plans not used in real estate grammar,” IET Image Processing, vol. 13, no. 13,
 marketing?” 2020, https://mrwilliamsburg.com/why-are- pp. 2623–2635, 2019.
 floor-plans-not-used-in-real-estate-marketing/. [21] S. Macé, H. Locteau, E. Valveny, and S. Tabbone, “A system to
 [6] J. Bayer, S. S. Bukhari, and A. Dengel, “Interactive design detect rooms in architectural floor plan images,” in Pro-
 support for architecture projects during early phases based on ceedings of the 9th IAPR International Workshop on Document
 recurrent neural networks,” in Proceedings of the International Analysis Systems, pp. 167–174, ACM, New York, NY, USA,
 Conference on Pattern Recognition Applications and Methods, June 2010.
 pp. 27–43, Springer, Funchal, Madeira, Portuga, January 2018. [22] A. Krizhevsky, I. Sutskever, and G. E. Hinton, “Imagenet
 [7] S. Hochreiter and J. Schmidhuber, “Long short-term mem- classification with deep convolutional neural networks,” in
 ory,” Neural Computation, vol. 9, no. 8, pp. 1735–1780, 1997. Proceedings of the Advances in neural information processing
 [8] G. Egor, S. Sven, D. Martin, and K. Reinhard, “Computer- systems, pp. 1097–1105, Lake Tahoe, Nevada, December 2012.
 aided approach to public buildings floor plan generation. [23] K. He, X. Zhang, S. Ren, and J. Sun, “Deep residual learning
 magnetizing floor plan generator,” Procedia Manufacturing, for image recognition,” in Proceedings of the IEEE conference
 vol. 44, pp. 132–139, 2020. on computer vision and pattern recognition, pp. 770–778, Las
 [9] C. Liu, J. Wu, and Y. Furukawa, “Floornet: a unified Vegas, NV, USA, June 2016.
 framework for floorplan reconstruction from 3d scans,” in [24] F. N. Iandola, S. Han, M. W. Moskewicz, K. Ashraf,
 Proceedings of the European Conference on Computer Vision W. J. Dally, and K. Keutzer, “Squeezenet: alexnet-level ac-
 (ECCV), pp. 201–217, Munich, Germany, September 2018. curacy with 50x fewer parameters and< 0.5 mb model size,”
[10] A. Phalak, V. Badrinarayanan, and A. Rabinovich, “Scan2- arXiv preprint arXiv:1602.07360, 2016.
 plan: efficient floorplan generation from 3d scans of indoor [25] C. Szegedy, W. Liu, Y. Jia et al., “Going deeper with con-
 scenes,” arXiv preprint arXiv:2003.07356, 2020. volutions,” in Proceedings of the IEEE conference on computer
[11] J. Zheng, J. Zhang, J. Li, R. Tang, S. Gao, and Z. Zhou, vision and pattern recognition, pp. 1–9, Boston, MA, USA,
 “Structured3d: a large photo-realistic dataset for structured 3d June 2015.
 modeling,” vol. 2, no. 7, arXiv preprint arXiv:1908.00222, [26] L.-P. de las Heras, O. R. Terrades, S. Robles, and G. Sánchez,
 2019. “Cvc-fp and sgt: a new database for structural floor plan
[12] J. Chen, C. Liu, J. Wu, and Y. Furukawa, “Floor-sp: inverse cad analysis and its groundtruthing tool,” International Journal on
 for floorplans by sequential room-wise shortest path,” in Document Analysis and Recognition, vol. 18, no. 1, pp. 15–30,
 Proceedings of the IEEE/CVF International Conference on 2015.
 Computer Vision, pp. 2661–2670, Seoul, Korea, October 2019. [27] M. Delalandre, E. Valveny, and J. Y. Ramel, “Recent contri-
[13] L.-P. de las Heras, S. Ahmed, M. Liwicki, E. Valveny, and butions on the sesyd dataset for performance evaluation of
 G. Sánchez, “Statistical segmentation and structural recog- symbol spotting systems,” Retrieved from semanticscholar.org,
 nition for floor plan interpretation,” International Journal on Dec. 2017. 2011, https://www.semanticscholar.org/paper/Recent-
 Document Analysis and Recognition, vol. 17, no. 3, pp. 221– contributions-on-the-SESYD-dataset-for-of-Delalandre-Valveny/
 237, 2014. 42a3d89544393fe80acb6d6c4eae0239c9c96b99.
[14] R. Khade, K. Jariwala, C. Chattopadhyay, and U. Pal, “A [28] D. Sharma, N. Gupta, C. Chattopadhyay, and S. Mehta,
 rotation and scale invariant approach for multi-oriented floor “Daniel: a deep architecture for automatic analysis and re-
 plan image retrieval,” Pattern Recognition Letters, vol. 145, trieval of building floor plans,” in Proceedings of the 2017 14th
 pp. 1–7, 2021. IAPR International Conference on Document Analysis and
Scientific Programming 15

 Recognition (ICDAR), vol. 1, pp. 420–425, IEEE, Kyoto, Japan,
 November 2017.
[29] C. Liu, A. G. Schwing, K. Kundu, R. Urtasun, and S. Fidler,
 “Rent3d: floor-plan priors for monocular layout estimation,”
 in Proceedings of the IEEE Conference on Computer Vision and
 Pattern Recognition, pp. 3413–3421, Boston, MA, USA, June
 2015.
[30] Robin (repository of building plans): https://github.com/
 gesstalt/ROBIN.
[31] M. Sokolova, N. Japkowicz, and S. Szpakowicz, “Beyond
 accuracy, f-score and roc: a family of discriminant mea-
 sures for performance evaluation,” in Proceedings of
 the Australasian joint conference on artificial intelligence,
 pp. 1015–1021, Lecture Notes in Computer Science,
 Springer, Hobart, Australia, December 2006.
[32] R. R. Selvaraju, M. Cogswell, A. Das, R. Vedantam, D. Parikh,
 and D. Batra, “Grad-cam: visual explanations from deep
 networks via gradient-based localization,” in Proceedings of
 the IEEE international conference on computer vision,
 pp. 618–626, Venice, Italy, October 2017.
[33] C. Liu, J. Wu, P. Kohli, and Y. Furukawa, “Raster-to-vector:
 revisiting floorplan transformation,” in Proceedings of the
 IEEE International Conference on Computer Vision,
 pp. 2195–2203, Venice, Italy, October 2017.
[34] Z. Zeng, X. Li, Y. K. Yu, and C. W. Fu, “Deep floor plan
 recognition using a multi-task network with room-boundary-
 guided attention,” in Proceedings of the IEEE/CVF Interna-
 tional Conference on Computer Vision, pp. 9096–9104, Seoul,
 Korea, October 2019.
[35] H. K. Mewada, A. V. Patel, J. Chaudhari, K. Mahant, and
 A. Vala, “Automatic room information retrieval and classi-
 fication from floor plan using linear regression model,” In-
 ternational Journal on Document Analysis and Recognition,
 vol. 23, no. 4, pp. 253–266, 2020.
You can also read