Ice Nucleation Spectrometer (INS) Instrument Handbook - DOE/SC-ARM-TR-278
←
→
Page content transcription
If your browser does not render page correctly, please read the page content below
DOE/SC-ARM-TR-278

Ice Nucleation Spectrometer (INS) Instrument
Handbook

JM Creamean TCJ Hill
CC Hume

February 2022
DISCLAIMER

This report was prepared as an account of work sponsored by the U.S.
Government. Neither the United States nor any agency thereof, nor any of
their employees, makes any warranty, express or implied, or assumes any
legal liability or responsibility for the accuracy, completeness, or
usefulness of any information, apparatus, product, or process disclosed, or
represents that its use would not infringe privately owned rights. Reference
herein to any specific commercial product, process, or service by trade
name, trademark, manufacturer, or otherwise, does not necessarily
constitute or imply its endorsement, recommendation, or favoring by the
U.S. Government or any agency thereof. The views and opinions of
authors expressed herein do not necessarily state or reflect those of the
U.S. Government or any agency thereof.
DOE/SC-ARM-TR-278

Ice Nucleation Spectrometer (INS)
Instrument Handbook

JM Creamean
TCJ Hill
CC Hume
All at Colorado State University

February 2022

Work supported by the U.S. Department of Energy,
Office of Science, Office of Biological and Environmental Research
JM Creamean et al., February 2022, DOE/SC-ARM-TR-278

 Acronyms and Abbreviations
AOS Aerosol Observing System
AMF3 third ARM Mobile Facility
ARM Atmospheric Radiation Measurement
CACTI Cloud, Aerosol, and Complex Terrain Interactions
CCD charge-coupled device
CCN cloud condensation nuclei
CI confidence interval(s)
CSU Colorado State University
DI deionized
DOE U.S. Department of Energy
H2O2 hydrogen peroxide
HEPA high-efficiency particulate absorbing
IN ice nuclei
INP ice nucleation particle
INS Ice Nucleation Spectrometer
IOP intensive operational period
IS Ice Spectrometer
kPa kilopascal
L-1
 per liter
mL milliliter
N2 nitrogen gas
nm nanometer
PCR polymerase chain reaction
SAIL Surface Atmosphere Integrated Field Laboratory
SGP Southern Great Plains
Slpm standard liters per minute
STP standard temperature and pressure
µL microliter
µm micrometer
UVB ultraviolet B

 iii
JM Creamean et al., February 2022, DOE/SC-ARM-TR-278

 Contents
Acronyms and Abbreviations ...................................................................................................................... iii
1.0 Instrument Title .................................................................................................................................... 1
2.0 Mentor Contact Information ................................................................................................................. 1
3.0 Vendor/Developer Contact Information ............................................................................................... 1
4.0 Instrument Description ......................................................................................................................... 2
5.0 Measurements Taken ............................................................................................................................ 3
6.0 Links to Definitions and Relevant Information .................................................................................... 3
 6.1 Data Ordering ............................................................................................................................... 3
 6.2 Data Plots ..................................................................................................................................... 3
 6.3 Data Quality ................................................................................................................................. 4
 6.3.1 Filter Sample Collections .................................................................................................. 4
 6.3.2 INS Processing .................................................................................................................. 4
 6.3.3 Control Blank Sample Collection and Processing............................................................. 5
7.0 Technical Specification ........................................................................................................................ 5
 7.1 Units ............................................................................................................................................. 5
 7.2 Range............................................................................................................................................ 5
 7.3 Accuracy ...................................................................................................................................... 5
 7.4 Repeatability ................................................................................................................................ 5
 7.5 Sensitivity ..................................................................................................................................... 6
 7.6 Input Values ................................................................................................................................. 6
 7.7 Output Values............................................................................................................................... 7
8.0 Instrument System Functional Diagram ............................................................................................... 7
9.0 Instrument/Measurement Theory.......................................................................................................... 7
10.0 Setup and Operation of Instrument ....................................................................................................... 8
 10.1 Filter Preparation .......................................................................................................................... 8
 10.2 Filter Use and Preservation .......................................................................................................... 8
 10.3 INS Sample Processing ................................................................................................................ 8
 10.4 INP Number Concentration Calculation ...................................................................................... 9
 10.5 Sample Treatments ..................................................................................................................... 10
11.0 Software .............................................................................................................................................. 10
12.0 Calibration .......................................................................................................................................... 10
13.0 Maintenance........................................................................................................................................ 11
14.0 Safety .................................................................................................................................................. 11
15.0 Citable References .............................................................................................................................. 11

 iv
JM Creamean et al., February 2022, DOE/SC-ARM-TR-278

 Figures
1 Filter unit sampling apparatuses, including a) single-use filter units under precipitation shields
 that are connected via tubing to b) the mass flow meters and vacuum pumps. ...................................... 2
2 Cumulative INP spectra from a filter collected during the ARM CACTI campaign. ............................ 4
3 Repeatability of INP tests using suspensions that were tested immediately after resuspension of
 particles form filers, then retested after frozen storage of the suspension (tubes were briefly
 pulse-vortexed after thawing). ................................................................................................................ 6
4 Comparability of INP spectra obtained from replicate filters taken at SGP........................................... 6
5 Schematic of workflow used to prepare samples for INP measurement in the INS............................... 7
6 The INS, including: a) a photo of the exterior showing both cooling systems, one with the door
 open exposing the cooling blocks for scale and b) interior view of one system.. .................................. 9
7 Example of a 24-hour sample from the third ARM Mobile Facility (AMF3; Oliktok Point,
 Alaska) on 10/23/2020 and two blank filters collected at the same site. .............................................. 10

 v
JM Creamean et al., February 2022, DOE/SC-ARM-TR-278

1.0 Instrument Title
 Colorado State University (CSU) Ice Nucleation Spectrometer (INS; also commonly called the Ice
 Spectrometer)

2.0 Mentor Contact Information
 Jessie Creamean (mentor)
 Department of Atmospheric Science
 Colorado State University
 1371 Campus Delivery
 Fort Collins, Colorado 80523
 USA
 Tel: (970) 491-7484
 jessie.creamean@colostate.edu

 Thomas Hill (co-mentor)
 Department of Atmospheric Science
 Colorado State University
 1371 Campus Delivery
 Fort Collins, Colorado 80523
 USA
 Tel: (970) 491-8428
 thomas.hill@colostate.edu

 Carson Hume (technician)
 Department of Atmospheric Science
 Colorado State University
 1371 Campus Delivery
 Fort Collins, Colorado 80523
 USA
 Tel: (720) 624-9201
 cchume@rams.colostate.edu

3.0 Vendor/Developer Contact Information
 Flow meter vendor:
 TSI Incorporated
 500 Cardigan Road
 Shoreview, Minnesota 55126
 USA
 Tel: (651) 490-2811

 1
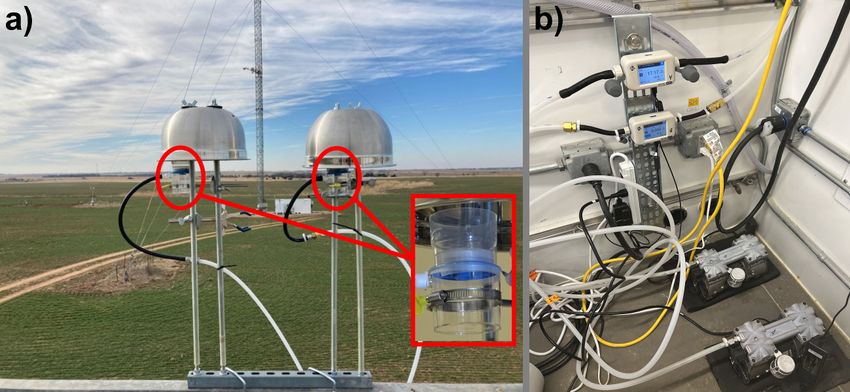
JM Creamean et al., February 2022, DOE/SC-ARM-TR-278

 Vacuum pump vendor:
 USA Thomas
 3810 Prospect Avenue, Unit A
 Yorba Linda, California 92886
 USA
 Tel: (714) 312-5531

 The INS was built in-house at CSU.

4.0 Instrument Description
 The Ice Nucleation Spectrometer (INS) is an offline analytical measurement system used to process filter
 samples for freezing temperature spectra of immersion-mode ice nucleating particle (INP) number
 concentrations. It is almost identical to the CSU Ice Spectrometer (IS) design. While basic immersion
 freezing methods have been applied for decades, recent intercomparison studies (DeMott et al. 2017,
 2018b) with other methods for sampling ambient INPs support the method’s utility. Use of the INS with
 filters produces spectra spanning wide dynamic ranges of temperature and, hence, INP concentration
 (e.g., six orders of magnitude). The INS is supported with well-established experimental protocols and
 has been applied in many diverse scenarios (e.g., Beall et al. 2017, DeMott et al. 2017, Hill et al. 2016,
 Hiranuma et al. 2015, McCluskey et al. 2014, 2017, 2018a, 2018b, Suski et al. 2018). See section 10.0 for
 details regarding the operational procedures and specifications of the INS processing protocol.

 Figure 1. Filter unit sampling apparatuses, including a) single-use filter units under precipitation
 shields that are connected via tubing to b) the mass flow meters and vacuum pumps. The inset
 in a) is a magnified photo of a filter unit. Photos in a) and b) are from the Southern Great
 Plains (SGP) and Surface Atmosphere Integrated Field Laboratory (SAIL) sites, respectively.

 Filter samples are collected routinely at select U.S. Department of Energy (DOE) Atmospheric Radiation
 Measurement (ARM) facilities. Each filter unit sampling apparatus consists of sterile single-use filter
 units prepared at CSU, a totalizing mass flow meter (TSI Mass Flow Meter 5200-1, TSI, Inc.), vacuum

 2
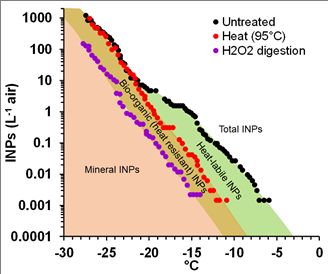
JM Creamean et al., February 2022, DOE/SC-ARM-TR-278

 pump (2688CE44 Oil-less Piston Compressor/Vacuum Pump, Thomas), tubing, and precipitation shields
 (Figure 1). Two identical apparatuses are operated in tandem to collect primary filters for INP analyses
 and duplicate filters that serve as backup or as archival samples for users to obtain for their own analytical
 ventures. The filter units are open-faced, secured outside to the Aerosol Observing System (AOS) railing,
 and shielded from precipitation. Vacuum line tubing connects each filter unit to the flow meter followed
 by vacuum pump, both of which are housed inside the AOS container.

5.0 Measurements Taken
 The primary measurement output of the INS is freezing temperature spectra of cumulative
 immersion-mode INP number concentrations in aerosols resuspended from individual filter samples,
 calculated in the units of # per L of air. Note that INPs are also interchangeably called ice nuclei (IN).

 Output data from the INS include freezing temperature (°C), INP number concentration (L-1 STP), upper
 and lower 95% CI values, and treatment flag. The treatment flag indicates if the suspension was untreated
 to obtain total INP number concentrations, heat-treated to deactivate biological (e.g., proteinaceous) INPs,
 or H2O2 treated to remove all organic INPs. These are measured and/or calculated from preliminary
 output data files that contain date and time of processing, freezing temperature, and number of wells
 frozen (typically out of an array of 32, each containing a 50-uL aliquot of re-suspended aerosol) per
 0.5 °C interval. Images of the unfrozen and frozen wells acquired throughout INS runs are obtained for
 visual quality control of the output data files.

6.0 Links to Definitions and Relevant Information

 6.1 Data Ordering
 INP number concentration data from the INS sample processing can be accessed and ordered on the
 ARM website. Data can be found by searching for the measurement “ice nuclei” or data source of “ice
 nucleation spectrometer”. “ice spectrometer” is also commonly used as an alternative to “ice nucleation
 spectrometer” for the data product description. INS data available on the ARM website include intensive
 operational period (IOP) data from previous campaigns in addition to routine INP mentor data.

 6.2 Data Plots
 A plot containing representative INS output data is shown in Figure 2. These data include cumulative
 freezing spectra of untreated (total) INP number concentrations, heat-treated (e.g., proteinaceous) INP
 number concentrations, and organic INP number concentrations from a peroxide treatment. INPs left after
 peroxide digestion are inorganic (e.g., mineral) INPs. Data are from the ARM Cloud, Aerosol, and
 Complex Terrain Interactions (CACTI) campaign in Argentina.

 3
JM Creamean et al., February 2022, DOE/SC-ARM-TR-278

Figure 2. Cumulative INP spectra from a filter collected during the ARM CACTI campaign. Spectra
 include total INPs in addition to unique treatments that differentiate heat-labile
 (proteinaceous), heat-resistant (bio-organic), and mineral INP concentrations.

6.3 Data Quality

6.3.1 Filter Sample Collections

Collection of filter samples for offline INS processing are quality controlled through monitoring the
in-line pressure (kPa) and flow rate (Slpm) at the start and end times of filter collection. These values are
used to determine if sampling errors occurred during collection (e.g., a significant change in pressure
and/or flow rate may be indicative of a leak in the filter unit, tubing, or other connections throughout the
system). To ensure accurate measurement of total volumes filtered, because flow rates decrease over the
sampling period, we use a totalizing mass flow meter (TSI 5200-1, accuracy ±2%) updating every second.

6.3.2 INS Processing

To minimize contamination of the filters with INPs on lab surfaces or in consumables (e.g., tubes used for
filter processing, pipet tips, polymerase chain reaction [PCR] plates), and to ensure that the deionized (DI)
water used for re-suspension of particles from filters is as INP-free as possible, we apply a comprehensive
protocol during preparation of the samples for measurement of INPs in the INS (Barry et al. 2021). Pipets
are calibrated annually. A 0.1-µm filtered DI water blank is included in each INS run, to correct for INPs
present in PCR trays and the DI water used for resuspension. Blanks (using DI water in place of the
sample resuspension) are also run for H2O2 digestions to check for any INP contamination in the
hydrogen peroxide and catalase used in the procedure.

For accurate temperature measurement in the INS, thermocouples are inserted just below the wells, via a
horizontally drilled hole plugged with thermal grease. There is one thermocouple in each of the four PCR
blocks. For each set of double blocks, readings from the two thermocouples are averaged. The
HEPA-filtered N2 that purges the headspace above the PCR trays is precooled to a few degrees above the
block temperature to prevent it warming the aliquots dispensed into the trays.

 4
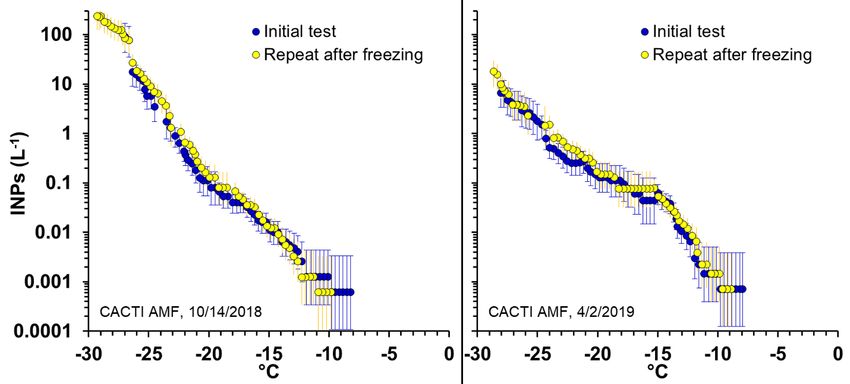
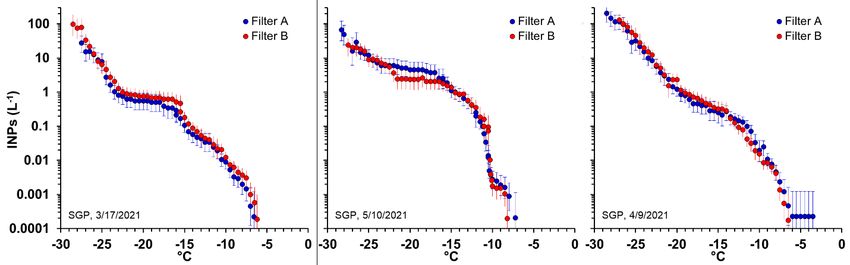
JM Creamean et al., February 2022, DOE/SC-ARM-TR-278

 In addition to automated detection of well freezing, camera images are taken every 20 seconds, or
 approximately every 0.1 °C, to check for program errors. Checking images against automated detection
 output is performed on every IS run.

 6.3.3 Control Blank Sample Collection and Processing

 Field filter unit blanks are prepared identically to the sampling filters and exposed briefly to air at the
 sampling position to monitor possible contamination during filter sample preparation and handling. These
 samples are preserved and processed in the same manner as the collected aerosol filter samples to obtain a
 mean background INP spectrum.

7.0 Technical Specification

 7.1 Units
 The calculated measurement quantity produced from the INS is INP number concentration per liter of air
 adjusted to standard temperature and pressure (L-1 STP, with STP being 0 °C and 101.32 kPa) at 0.5 °C-
 increments for freezing temperatures between 0 and typically –27 to –29 °C (the lower temperature limit
 is reached when more than 15 of the 32 wells freeze in the DI water blank).

 7.2 Range
 The temperature measurement range of the INS is between 0 and approximately –27 to –29 °C. The range
 of INP concentrations measurable depends mainly on total volume of air filtered. For a sampling period
 of 24 hours, and a total volume filtered of 27 m-3 (current average at SGP), the detection limit is
 0.0002 INPs L-1. There is no upper limit, since we use serial dilutions (typically 11-fold) to bring
 suspensions within range. INP concentrations may exceed 100 L-1 at -28 °C (e.g., at SGP).

 7.3 Accuracy
 The temperature uncertainty in the INS technique is ± 0.2 °C (a combination of thermocouple uncertainty
 and temperature variation across the blocks due to gradients in cooling). Accuracy is also controlled by
 the inherent uncertainty in using count data of frozen wells. Binomial sampling confidence intervals (CI,
 95%) are derived following Agresti and Coull (1998) to estimate the uncertainty in INP number
 concentrations, and their ranges vary according to the proportion of wells frozen. For a single well frozen
 (out of 32), the 95% CI ranges from ~0.2 to ~5.5 times the estimated INP concentration, while for 16 of
 the 32 wells frozen it ranges from ~0.6 to ~1.6 times.

 7.4 Repeatability
 On several occasions in previous campaigns, we have confirmed the repeatability of measures within the
 range inherent to the method (see section 7.3). Two examples are given in Figure 3, from filter samples
 taken in the CACTI field campaign in Argentina. We have also tested replicate filters to confirm their
 comparability (Figure 4).

 5
JM Creamean et al., February 2022, DOE/SC-ARM-TR-278

Figure 3. Repeatability of INP tests using suspensions that were tested immediately after resuspension
 of particles form filers, then retested after frozen storage of the suspension (tubes were briefly
 pulse-vortexed after thawing). Vertical bars are 95% confidence intervals.

Figure 4. Comparability of INP spectra obtained from replicate filters taken at SGP. Vertical bars are
 95% confidence intervals.

7.5 Sensitivity
As mentioned in section 7.2, the sensitivity of the method is typically around 0.0002 INPs L-1. Expressed
in terms of lower limit of temperature of operation, the sensitivity of the INS is dependent on the
background concentrations of contaminant INPs in the DI water blank controls. Concentrations of such
artifacts are typically very low, at < 1.5 INPs mL-1 at –25 °C.

7.6 Input Values
The INS produces data containing the number of wells frozen, out of a total of 32, every 0.5 °C, which
are used to calculate final cumulative INP number concentrations.

 6
JM Creamean et al., February 2022, DOE/SC-ARM-TR-278

 7.7 Output Values
 Output data from the INS include values of freezing temperature (°C), INP number concentration
 (L 1 STP), and upper and lower 95% CI values.

8.0 Instrument System Functional Diagram

 Figure 5. Schematic of workflow used to prepare samples for INP measurement in the INS.

9.0 Instrument/Measurement Theory
 The formation and microphysical modulation of cloud droplets and ice crystals are highly dependent upon
 aerosols that serve as cloud condensation nuclei (CCN) and INPs. In general, INP observations are
 limited relative to other aerosol properties, yet central to elucidating the role of aerosols in cloud
 formation, and subsequent cloud microphysical and radiative properties. Immersion freezing, whereby an
 INP first serves as a CCN, then freezes at temperatures above homogeneous freezing (–38 ˚C)
 (Kanji et al. 2017, Murray et al. 2012), is a particularly important glaciation process for the formation and
 impacts of mixed-phase clouds. The INS mimics immersion freezing of cloud ice through ambient
 aerosols serving as INPs by way of heterogeneous ice nucleation. This technique provides quantitative
 information on the population of ambient aerosols that can facilitate cloud ice formation at a wide range
 of subzero temperatures.

 The efficacy of an aerosol to serve as an INP largely depends on temperature and vapor saturation with
 respect to water and ice, in addition to its composition (chemical, mineral, or biological makeup),
 morphology, and size, and thus, its source (Hoose and Möhler 2012). Aerosols such as mineral dust, soil
 dust, sea spray, volcanic ash, black carbon, and biologically derived particles (e.g., intact or fragmented
 bacteria, pollen, fungal spores, lichens, algae, diatoms, soil organic matter, fatty acids, proteins, and other
 macromolecules) have been shown to serve as INPs (Conen et al. 2011, Cziczo et al. 2017, DeMott et al.
 1999, 2018a, Hill et al. 2016, Hoose and Möhler 2012, McCluskey et al. 2014, Murray et al. 2012,

 7
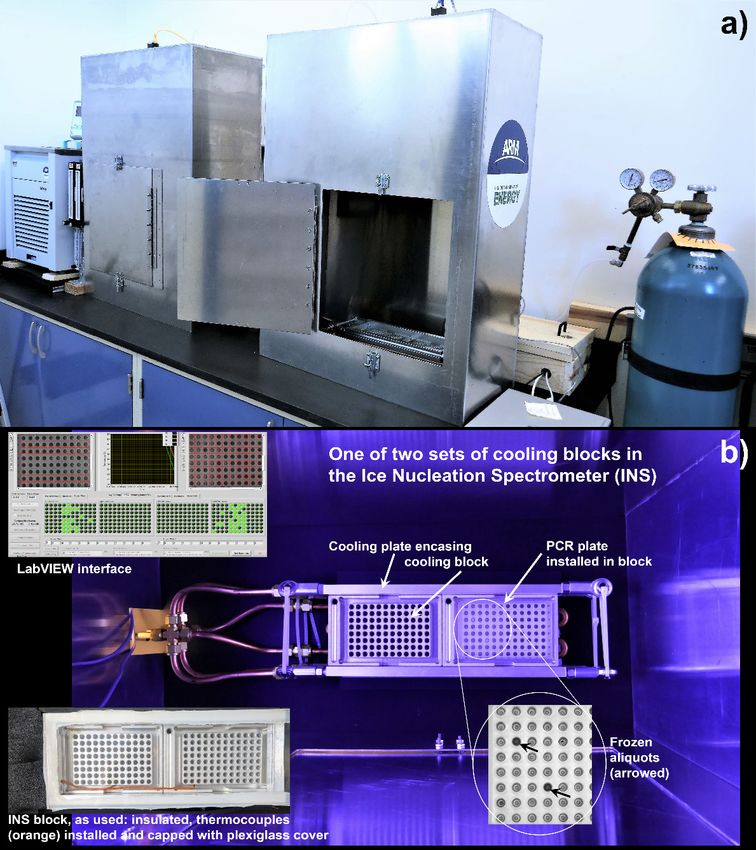
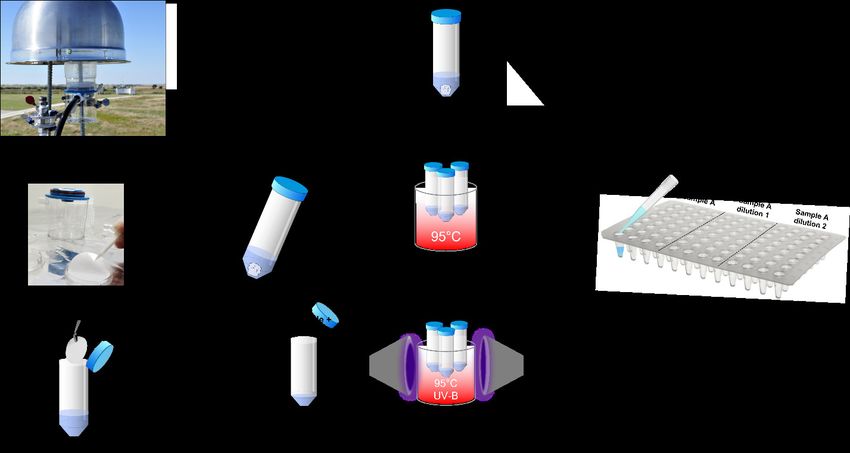
JM Creamean et al., February 2022, DOE/SC-ARM-TR-278

 O'Sullivan et al. 2015, 2018, Petters et al. 2009). Among the natural sources, mineral dust and
 biologically derived particles are arguably the most crucial INPs found in the atmosphere. Mineral dust is
 an abundant INP, forming ice primarily at temperatures < −15 °C, while classes of biological particles
 such as certain bacteria are capable of initiating freezing up to −1.5 °C (Creamean et al. 2013,
 Despres et al. 2012, Frohlich-Nowoisky et al. 2016, Hoose and Möhler 2012, Kim et al. 1987,
 Murray et al. 2012). Measuring total INPs, in addition to their biological and mineral components, yields
 critical information on INP abundances and sources.

10.0 Setup and Operation of Instrument

 10.1 Filter Preparation
 The single-use Nalgene™ Sterile Analytical Filter Units are prepared by replacing their cellulose nitrate
 filters with 0.2-μm polycarbonate filters backed with 10-μm polycarbonate filters (each are
 47-mm-diameter Whatman® Nuclepore™ Track-Etched Membranes), both pre-cleaned in-house
 (Barry et al. 2021). Filter units are disassembled and reassembled under ultraclean conditions in a laminar
 flow cabinet with near-zero ambient particle concentrations. The modified filter units are then capped and
 individually stored in clean airtight bags until use.

 10.2 Filter Use and Preservation
 Once sampling is complete, typically after 24 hours (option to collect between 2 to 72 hours, depending
 on total aerosol loadings at each site), the 0.2-μm filters containing the collected aerosol loadings are
 removed from the single-use filter unit and preserved frozen at approximately –20 °C on site in individual
 sterile Petri dishes. Batches of samples preserved in Petri dishes are transported frozen to CSU where they
 are further preserved frozen until processing.

 10.3 INS Sample Processing
 For re-suspension of particles prior to measurement of INPs in the INS, filters are placed in sterile
 50-mL polypropylene tubes, 7-10 mL (smaller amounts for filters from “cleaner” environments, to
 increase sensitivity) of 0.1 µm-filtered DI water added, and particles resuspended by tumbling end over
 end on a rotator for 20 min. Each INS is constructed using two 96-well aluminum incubation blocks,
 designed for incubating PCR plates, placed end to end and encased on their sides and base by cold plates
 (Figure 6a). There are two INS instruments placed side by side to double sample processing capacity
 (Figure 6b).

 Immersion freezing temperature spectra are obtained by dispensing 50-μL aliquots of aerosol suspensions
 into four sterile, 96-well PCR trays in a laminar flow cabinet. One INS run, therefore, processes
 384 × 50 μL aliquots of suspension. There are typically 32 aliquots per level of dilution, and we use up to
 five 11- to 15-fold serial dilutions to cover the full temperature range/INP concentration. PCR plates are
 then placed into the blocks of the INS, the device covered with a plexiglass window, and the headspace
 purged with 750 mL min-1 of cooled and HEPA-filtered N2. The device is cooled at 0.33°C min-1 using a
 recirculating low temperature bath, and the freezing of wells is recorded every 0.5 °C automatically
 through an interface with a charge-coupled device (CCD) camera system. Limit of measurement is
 between –27 and –29 °C, depending on INPs in the DI water used for resuspension (this baseline is
 subtracted before subsequent calculations).

 8
JM Creamean et al., February 2022, DOE/SC-ARM-TR-278

10.4 INP Number Concentration Calculation
From the fraction of drops frozen and the known total volume of air filtered at each temperature interval,
we can calculate INP concentration with a universally used equation (Vali 1971):

 ln (1 − )
 ( ) ( −1 ) = ×

where f is the proportion of droplets frozen, Vdrop is the volume of each drop, Vsuspension is the volume of the
suspension, and Vair is the volume of air per sample (liters at STP: 0 °C and 101.32 kPa).

Figure 6. The INS, including: a) a photo of the exterior showing both cooling systems, one with the
 door open exposing the cooling blocks for scale and b) interior view of one system. PCR
 trays are loaded into the cooling blocks, the headspace purged with cooled and HEPA-filtered
 air, blocks cooled at 0.33 °C min-1, and freezing events logged automatically through a
 LabVIEW interface with a camera.

 9
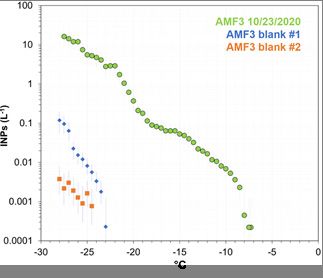
JM Creamean et al., February 2022, DOE/SC-ARM-TR-278

 10.5 Sample Treatments
 Thermal treatments and peroxide digestions provide valuable insights into INP composition (see
 Figure 2). Heat treatments are performed by heating 2.5 mL of sample suspension to 95 °C for 20 min to
 denature heat-labile INPs, such as proteins. Peroxide digestions are performed on a further 2 mL of
 suspension in a solution containing 10% H2O2 (by adding 1 mL of 30% H2O2 in water, Sigma-Aldrich®)
 and heating to 95 °C for 20 min while illuminating with ultraviolet B (UVB) fluorescent bulbs to generate
 hydroxyl radicals. Following digestion, residual H2O2 is removed using catalase (MP Biomedicals™
 catalase from bovine liver). This digestion removes all bio-organic INPs as described in detail in
 McCluskey et al. (2018b), Suski et al. (2018), and Testa et al. (2021). The difference in the INP
 temperature spectra after both treatments determines the influence of that INP type in the original sample,
 and the residual spectrum gives the inorganic/mineral INP component. Thus, this processing provides
 four key measures from each sample: total, heat-labile (i.e., biological), bio-organic, and inorganic (i.e.,
 mineral) INP concentration. Treatments are typically applied to 1/3 of the total samples collected at any
 given location or during a given IOP.

11.0 Software
 INS operation and data acquisition are controlled with custom LabVIEW software.

12.0 Calibration
 Filter unit and DI water control blank tests are conducted routinely to obtain background INP spectra for
 calibration of the measured INP spectra from the aerosol filter samples (Figure 7).

 Figure 7. Example of a 24-hour sample from the third ARM Mobile Facility (AMF3; Oliktok Point,
 Alaska) on 10/23/2020 and two blank filters collected at the same site.

 TSI 5200 mass flow meters are checked against a TSI 5230 meter, which has enhanced 1.7% accuracy,
 and is reserved for this purpose. If TSI 5200 units are more than 5% adrift, they are returned to TSI for
 servicing and calibration.

 10
JM Creamean et al., February 2022, DOE/SC-ARM-TR-278

13.0 Maintenance
 The following maintenance procedures are required for the filter unit apparatuses:
 • Check in-line temperature, pressure, and flow rate at the start of sample collection.
 • Check in-line temperature, pressure, and flow rate at the end of sample collection.
 • Clean and clean precipitation shields, as needed.
 • Check for leaks in single-use filter units before use.
 • Check for leaks/obstructions in vacuum tubing, and connection points, as needed.
 • Check TSI 5200 mass flow meters (against TSI 5230, which has enhanced 1.7% accuracy, and is
 reserved for this purpose) annually, and return for servicing if required.
 • Check performance of Thomas 2688CE44 pumps using TSI flow meters. When operating efficiently
 these pumps will be capable of producing a 0.5 kPa vacuum.

 The following maintenance procedures are required for the INS:
 • Clean plexiglass lids with Windex and DI water every two weeks.
 • Deep clean lab space with Windex and Kimwipes once per month.
 • Check copper piping for SYLTHERM™ XLT heat transfer fluid leaks.
 • Watch rate of N2 tank depletion for leaks.

14.0 Safety
 Chemicals including 30% H2O2 and catalase for the peroxide treatment processing, methanol for
 preparing sterile filters, and SYLTHERM™ XLT heat transfer fluid for the INS coolant are all used
 during filter collection and processing. These chemicals can be flammable and/or toxic.

15.0 Citable References
 Agresti, A, and BA Coull. 1998. “Approximate is better than “exact” for interval estimation of binomial
 proportions.” The American Statistician 52(23): 119−126, https://doi.org/10.2307/2685469

 Barry, KR, TCJ Hill, C Jentzsch, BF Moffett, F Stratmann, and PJ DeMott. 2021. “Pragmatic protocols
 for working cleanly when measuring ice nucleating particles.” Atmospheric Research 250: 105419,
 https://doi.org/10.1016/j.atmosres.2020.105419

 Beall, CM, MD Stokes, TC Hill, PJ DeMott, JT DeWald, and KA Prather. 2017. “Automation and heat
 transfer characterization of immersion mode spectroscopy for analysis of ice nucleating particles.”
 Atmospheric Measurement Techniques 10(7): 2613−2626, https://doi.org/10.5194/amt-10-2613-2017

 Conen, F, CE Morris, J Leifeld, MV Yakutin, and C Alewell. 2011. “Biological residues define the ice
 nucleation properties of soil dust.” Atmospheric Chemistry and Physics 11(18): 9643−9648,
 https://doi.org/10.5194/acp-11-9643-2011

 11
JM Creamean et al., February 2022, DOE/SC-ARM-TR-278

Creamean, JM, KJ Suski, D Rosenfeld, A Cazorla, PJ DeMott, RC Sullivan, AB White, FM Ralph,
P Minnis, JM Comstock, JM Tomlinson, and KA Prather. 2013. “Dust and Biological Aerosols from the
Sahara and Asia Influence Precipitation in the Western U.S.” Science 339(6127): 1572−1578,
https://doi.org/10.1126/science.1227279

Cziczo, DJ, L Ladino, Y Boose, ZA Kanji, P Kupiszewski, S Lance, S Mertes, and H Wex. 2017.
“Measurements of Ice Nucleating Particles and Ice Residuals.” AMS Meteorological Monographs
58: 8.1−8.13, https://doi.org/10.1175/amsmonographs-d-16-0008.1

DeMott, PJ, Y Chen, SM Kreidenweis, DC Rogers, and DE Sherman. 1999. “Ice formation by black
carbon particles.” Geophysical Research Letters 26(16): 2429−2432,
https://doi.org/10.1029/1999gl900580

DeMott, PJ, TCJ Hill, MD Petters, AK Bertram, Y Tobo, RH Mason, KJ Suski, CS McCluskey,
EJT Levin, GP Schill, Y Boose, AM Rauker, AJ Miller, J Zaragoza, K Rocci, NE Rothfuss, HP Taylor,
JD Hader, C Chou, JA Huffman, U Poschl, AJ Prenni, and SM Kreidenweis. 2017. “Comparative
measurements of ambient atmospheric concentrations of ice nucleating particles using multiple
immersion freezing methods and a continuous flow diffusion chamber.” Atmospheric Chemistry and
Physics 17(18): 11227−11245, https://doi.org/10.5194/acp-17-11227-2017

DeMott, PJ, RH Mason, CS McCluskey, TCJ Hill, RJ Perkins, Y Desyaterik, AK Bertram, JV Trueblood,
VH Grassian, Y Qiu, V Molinero, Y Tobo, CM Sultana, C Lee, and KA Prather. 2018a. “Ice nucleation
by particles containing long-chain fatty acids of relevance to freezing by sea spray aerosols.”
Environmental Science: Processes & Impacts 20(11):1559−1569, https://doi.org/10.1039/C8EM00386F

DeMott, PJ, O Möhler, DJ Cziczo, N Hiranuma, MD Petters, SS Petters, F Belosi, HG Bingemer,
SD Brooks, C Budke, M Burkert-Kohn, KN Collier, A Danielczok, O Eppers, L Felgitsch, S Garimella,
H Grothe, P Herenz, TCJ Hill, K Hohler, ZA Kanji, A Kiselev, T Koop, TB Kristensen, K Kruger,
G Kulkarni, EJT Levin, BJ Murray, A Nicosia, D O'Sullivan, A Peckhaus, MJ Polen, HC Price,
N Reicher, DA Rothenberg, Y Rudich, G Santachiara, T Schiebel, J Schrod, TM Seifried, F Stratmann,
RC Sullivan, KJ Suski, M Szakall, HP Taylor, R Ullrich, J Vergara-Temprado, R Wagner, TF Whale,
D Weber, A Welti, TW Wilson, MJ Wolf, and J Zenker. 2018b. “The Fifth International Workshop on Ice
Nucleation phase 2 (FIN-02): laboratory intercomparison of ice nucleation measurements.” Atmospheric
Measurement Techniques 11(11): 6231−6257, https://doi.org/10.5194/amt-11-6231-2018

Despres, VR, JA Huffman, SM Burrows, C Hoose, AS Safatov, G Buryak, J Frohlich-Nowoisky,
W Elbert, MO Andreae, U Poschl, and R Jaenicke. 2012. “Primary biological aerosol particles in the
atmosphere: a review.” Tellus B: Chemical and Physical Meteorology 64(1),
https://doi.org/10.3402/tellusb.v64i0.15598

Frohlich-Nowoisky, J, CJ Kampf, B Weber, JA Huffman, C Pohlker, MO Andreae, N Lang-Yona,
SM Burrows, SS Gunthe, W Elbert, H Su, P Hoor, E Thines, T Hoffmann, VR Despres, and U Poschl.
2016. “Bioaerosols in the Earth system: Climate, health, and ecosystem interactions.” Atmospheric
Research 182: 346−376, https://doi.org/10.1016/j.atmosres.2016.07.018

 12
JM Creamean et al., February 2022, DOE/SC-ARM-TR-278

Hill, TCJ, PJ DeMott, Y Tobo, J Froehlich-Nowoisky, BF Moffett, GD Franc, and SM Kreidenweis.
2016. “Sources of organic ice nucleating particles in soils.” Atmospheric Chemistry and Physics
16(11): 7195−7211, https://doi.org/10.5194/acp-16-7195-2016

Hiranuma, N, S Augustin-Bauditz, H Bingemer, C Budke, J Curtius, A Danielczok, K Diehl,
K Dreischmeier, M Ebert, F Frank, N Hoffmann, K Kandler, A Kiselev, T Koop, T Leisner, O Möhler,
B Nillius, A Peckhaus, D Rose, S Weinbruch, H Wex, Y Boose, PJ DeMott, JD Hader, TCJ Hill,
ZA Kanji, G Kulkarni, EJT Levin, CS McCluskey, M Murakami, BJ Murray, D Niedermeier, MD Petters,
D O'Sullivan, A Saito, GP Schill, T Tajiri, MA Tolbert, A Welti, TF Whale, TP Wright, and
K Yamashita. 2015. “A comprehensive laboratory study on the immersion freezing behavior of illite NX
particles: a comparison of 17 ice nucleation measurement techniques.” Atmospheric Chemistry and
Physics 15(5): 2489−2518, https://doi.org/10.5194/acp-15-2489-2015

Hoose, C, and O Möhler. 2012. “Heterogeneous ice nucleation on atmospheric aerosols: a review of
results from laboratory experiments.” Atmospheric Chemistry and Physics 12(20): 9817−9854,
https://doi.org/10.5194/acp-12-9817-2012

Kanji, ZA, LA Ladino, H Wex, Y Boose, M Burkert-Kohn, DJ Cziczo, and M Krämer. 2017. “Overview
of Ice Nucleating Particles.” AMS Meteorological Monographs 58(1): 1.1−1.33,
https://doi.org/10.1175/amsmonographs-d-16-0006.1

Kim, HK, C Orser, SE Lindow, and DC Sands. 1987. “Xanthomonas-campestris pv. translucens Strains
Active in Ice Nucleation.” Plant Disease 71(11): 994−997, https://doi.org/10.1094/Pd-71-0994

McCluskey, CS, PJ DeMott, AJ Prenni, EJT Levin, GR McMeeking, AP Sullivan, TCJ Hill, S Nakao,
CM Carrico, and SM Kreidenweis, 2014. “Characteristics of atmospheric ice nucleating particles
associated with biomass burning in the US: Prescribed burns and wildfires.” Journal of Geophysical
Research − Atmospheres 119(17): 10458−10470, https://doi.org/10.1002/2014jd021980

McCluskey, CS, TCJ Hill, F Malfatti, CM Sultana, C Lee, MV Santander, CM Beall, KA Moore,
GC Cornwell, DB Collins, KA Prather, T Jayarathne, EA Stone, F Azam, SM Kreidenweis, and
PJ DeMott. 2017. “A Dynamic Link between Ice Nucleating Particles Released in Nascent Sea Spray
Aerosol and Oceanic Biological Activity during Two Mesocosm Experiments.” Journal of the
Atmospheric Sciences 74(1): 151−166, https://doi.org/10.1175/Jas-D-16-0087.1

McCluskey, CS, J Ovadnevaite, M Rinaldi, J Atkinson, F Belosi, D Ceburnis, S Marullo, TCJ Hill,
U Lohmann, ZA Kanji, C O'Dowd, SM Kreidenweis, and PJ DeMott. 2018a. “Marine and terrestrial
organic ice-nucleating particles in pristine marine to continentally influenced northeast Atlantic air
masses.” Journal of Geophysical Research −Atmospheres 123(11): 6196−6212,
https://doi.org/10.1029/2017jd028033

McCluskey, CS, TCJ Hill, RS Humphries, AM Rauker, S Moreau, PG Strutton, SD Chambers,
AG Williams, I McRobert, J Ward, MD Keywood, J Harnwell, W Ponsonby, ZM Loh, PB Krummel,
A Protat, SM Kreidenweis, and PJ DeMott. 2018b. “Observations of Ice Nucleating Particles over
Southern Ocean Waters.” Geophysical Research Letters 45(21): 11989−11997,
https://doi.org/10.1029/2018gl079981

 13
JM Creamean et al., February 2022, DOE/SC-ARM-TR-278

Murray, BJ, D O'Sullivan, JD Atkinson, and ME Webb. 2012. “Ice nucleation by particles immersed in
supercooled cloud droplets.” Chemical Society Reviews 41(19): 6519−6554,
https://doi.org/10.1039/C2cs35200a

O'Sullivan, D, BJ Murray, JF Ross, TF, Whale, HC Price, JD Atkinson, NS Umo, and ME Webb. 2015.
“The relevance of nanoscale biological fragments for ice nucleation in clouds.” Nature Scientific Reports
5: 8082, https://doi.org/10.1038/srep08082

O'Sullivan, D, MP Adams, MD Tarn, AD Harrison, J Vergara-Temprado, GCE Porter, MA Holden,
A Sanchez-Marroquin, F Carotenuto, TF Whale, JB McQuaid, R Walshaw, DHP Hedges, IT Burke,
Z Cui, and BJ Murray. 2018. “Contributions of biogenic material to the atmospheric ice-nucleating
particle population in North Western Europe.” Nature Scientific Reports 8: 13821,
https://doi.org/10.1038/s41598-018-31981-7

Petters, MD, MT Parsons, AJ Prenni, PJ DeMott, SM Kreidenweis, CM Carrico, AP Sullivan,
GR McMeeking, E Levin, CE Wold, JL Collett, and H Moosmüller. 2009. “Ice nuclei emissions from
biomass burning.” Journal of Geophysical Research − Atmospheres 114(D7),
https://doi.org/10.1029/2008JD011532

Suski, KJ, TCJ Hill, EJT Levin, A Miller, PJ DeMott, and SM Kreidenweis. 2018. “Agricultural
harvesting emissions of ice-nucleating particles.” Atmospheric Chemistry and Physics
18(18): 13755−13771, https://doi.org/10.5194/acp-18-13755-2018

Testa, B, TCJ Hill, NA Marsden, KR Barry, CC Hume, Q Bian, J Uetake, H Hare, RJ Perkins, O Möhler,
SM Kreidenweis, and PJ DeMott. 2021. “Ice Nucleating Particle Connections to Regional Argentinian
Land Surface Emissions and Weather during the Cloud, Aerosol, and Complex Terrain Interactions
Experiment.” Journal of Geophysical Research − Atmospheres 126(23): e2021JD035186,
https://doi.org/10.1029/2021JD035186

Vali, G. 1971. “Quantitative Evaluation of Experimental Results on Heterogeneous Freezing Nucleation
of Supercooled Liquids.” Journal of the Atmospheric Sciences 28(3): 402−409,
https://doi.org/10.1175/1520-0469(1971)0282.0.CO;2

 14
You can also read