Il 5G - La situazione italiana: i nodi da sciogliere - Gianfranco Ciccarella Mail: Quadrato della Radio, October ...
←
→
Page content transcription
If your browser does not render page correctly, please read the page content below
Il 5G - La situazione italiana: i nodi da sciogliere

 Gianfranco Ciccarella
 Mail: gianfranco.ciccarella@gmail.com
 Quadrato della Radio, October 19th, 2019
Agenda
!5G: requisiti dei servizi applicativi (applicazioni), tecnologie e innovazione
!Enhanced Radio Access Network
! virtual/cloud RAN
! riduzione del TCO della RAN ottenuto con virtual/cloud RAN
!Edge Cloud Computing e Multi-access Edge Computing
! Architettura ECC e MEC
! Miglioramento delle prestazioni dei servizi applicativi
! Riduzione del TCO della rete dovuta all’architettura ECC
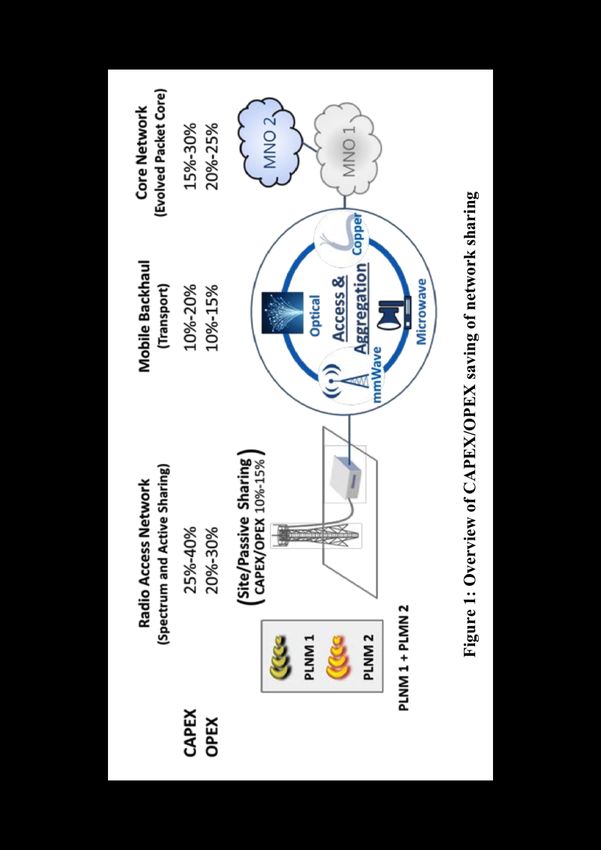
!Riduzione del TCO ottenuta con lo sharing di elementi attivi e passivi di rete
!Sostenibiltà economica Altri punti importanti:
!Conclusioni • Cyber Security per il 5G, ma non solo
• Il 5G nuoce alla salute
• Difficoltà per ottenere permessi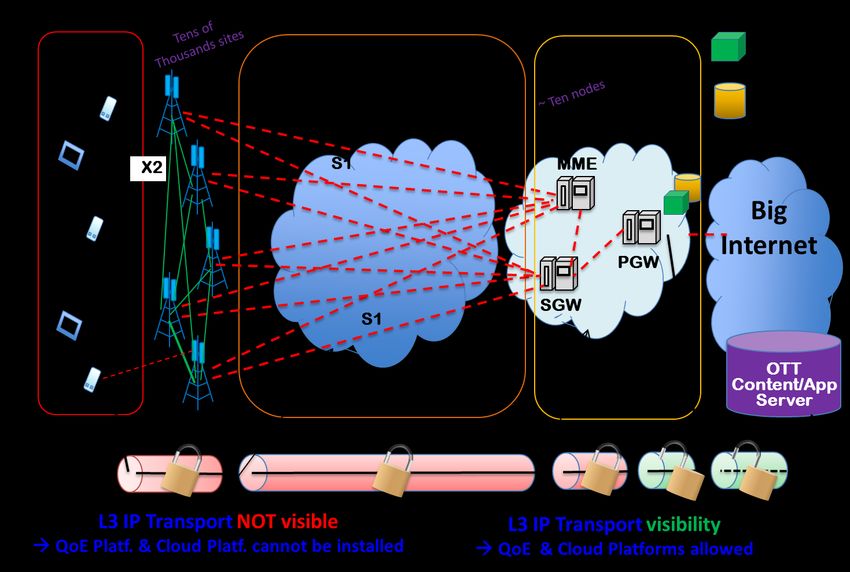
5G Use Cases and Application Services requirements
          Latency
                                                                             5G Innovative Applications have
                                                                             challenging requirements in terms
                                                                             of two main KPIs:
                                                                               Ø Latency
                                                                               Ø Throughput (1)
                                                                             to ensure the Quality of
                                                                             Experience (QoE) levels expected
                                                                             by End Users and by Internet of
                                                                             Thinks (IoT)
                                                                             Video streaming HD (TH=7,2 Mbps)
                                                                             with PL=0,38% à RTT=26 ms

     4G services (to day)
                                                                              (1) Note that: TH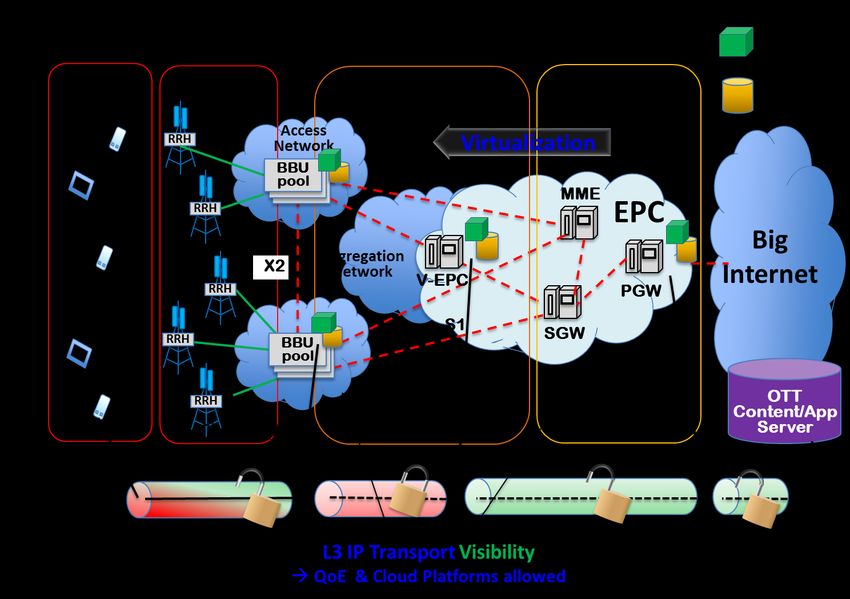
Bandwidth utilization ratio in LTE networks
                                                                                                     Average:
                                                                                                         TH
                                                                                                                    = 34.6%
                                                                                                     Radio Bit Rate

•     Large TCP downlink flows (>5 s, > 1 Mbyte) not concurrent with other flows.
•     The median ratio is only 19.8% (median gives a better idea of a ‘typical’ value because it is not skewed so
      much by extremely large or small values)
•     For 71.3% of large flows, the bandwidth utilization ratios are below 50%.
•     On average, the utilization ratio is 34.6%.
•     Transferring the same amount of data requires a longer period of time with lower bandwidth utilization
      ratio, which incurs additional radio energy overhead and more radio resource consumption à higher TCO
      and ‘poor’ apps performance

    Source: J.Huang,F.Qian,Y.Guo ,Y.Zhou,S.Sen,Q.Xu,Z.M.Mao,O.Spatscheck
            “An In-depth Study of LTE: Effect of Network Protocol and Application Behavior on Performance”; SIGCOMM 2013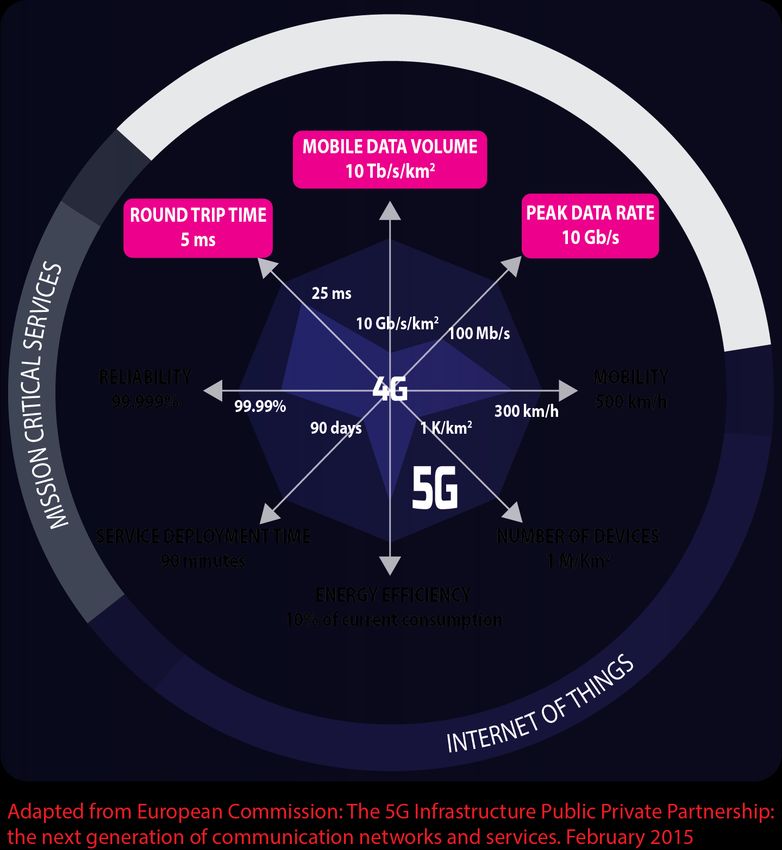
5G Use Cases, Requirements and Technologies
        USER EXPERIENCE

                                       + Apps
5G Capabilities and Innovations

                        + Apps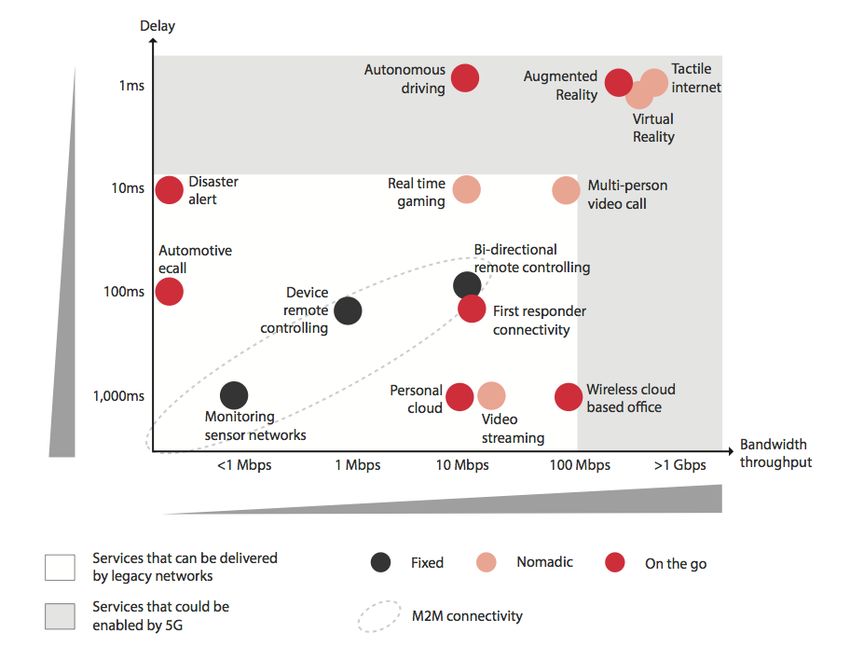
Edge Cloud Computing reference Architecture (to be)
                                                   Remote Server                                              Edge Cloud Computing:
                                                                                                              •   Fixed and mobile IP Edge distribution by
                                        ITC GTW
                                                                                                                  NFV for some of the IP Edge functions

                                     Centralized                                                              •   Apps and Content Delivery (vCD)
                                                                                                                  Platforms (vQoE) distribution ‘near’ End
CORE

                                      IP Edge:
                                     EPC, BRAS
                                                            IP Edge                                               Users

                                                                                 L2/L3 Transport
                                       Core Node

                                                                                                              •   Virtual RAN based mobile access
         Metro

                                                               MicroCloud +
EDGE

                                      Metro Node
                                                                   vIP Edge+                                      Apps and contents performance improv.
         Aggregation

                                                                   vQoE+ Apps

                                     Access Node
                                                                                                                  Network cost saving (TCO reduction)
                                                             Virtual RAN
ACCESS

                                                             and OLT     L2/L3
                       Mobile site

                           MicroCloud +
                                                                                L2                                Edge Cloud Computing components
                            vIP Edge +                                                             Netw.          • Micro Cloud (HW and SW)
                                                                                L2

                           vQoE+Apps               End Users                                       Services       • IP Edge functionalities (vEPC, vBRAS)
                                                                                                   Applic.        • Apps and CD platforms (vQoE)
                                                                                L3

                                                                                                   Services
  L3 and L3 are related to the Internet protocols stack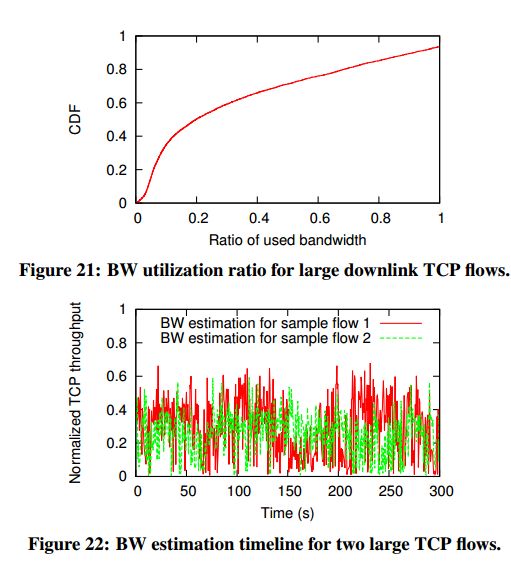
Edge Cloud Computing
  Interconnections and traffic flows
                                              Contents and    Why Edge Cloud Computing
    Cloud/QoE
                                              App. Services   • Downstream traffic performance improvement enables new
                                 IGW
    Platform           Core
                                                                revenues, new business models (two sides) and UBB
      IP EDGE          POP                                      monetization
                                                              • Networks TCO savings (in many cases) due to ECC architecture
                                                                both for RAN and aggregation + metro + core network

                                                              Why Edge Cloud Computing provided by third parties
  Telco n-th                                Telco i-th        • Trend: From shared infrastructure to shared active network
                    Metro/                  network             components. Drivers: cost saving and technical constraints
  Network          Regional
                     POP
                                                                (constraints are mainly related to 5G RAN)
                                                              • Incremental cost savings due to shared ECC platform
                                              ECC               (incremental to the ECC architecture saving)
                                          Edge                • Higher saving by increasing the peak throughput managed by
                                       Computing                the ECC
                Edge                    Platform
                                       (vIP Edge,
                POP                     vCD and
                                         Apps)                Services provided by Edge Cloud Computing (ECC) plat.
                                                              • IaaS: Telcos distribute and execute Apps and their platforms
                                                                (vIP Edge, vCD) in third party Micro Cloud (HW and SW)
         Fixed / Mobile                                       • PaaS: Telco deploy their ECC by third party Micro Cloud (HW
          Access Net          Interconnections                  and SW) and third party platforms (vIP Edge, vCD). vIP Edge,
                              Contents/apps with ECC            Contents and Apps management is fully controlled by the
                              Contents/apps no ECC              Telco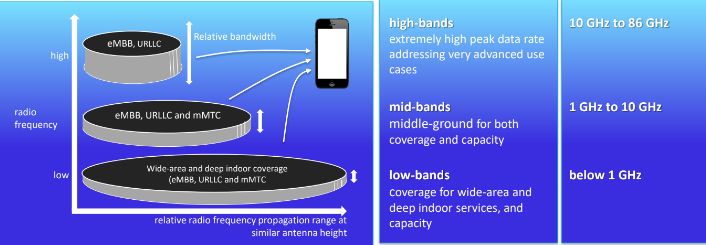
Performance improvement by ECC
   Case Studies modelling                                                                             PL no ECC = PL with ECC
        LatencyTerm-CRAN  LatencyCRAN-Core                            LatencyCore-OTT Server
                                                                                                         Cache Efficiency: 60%
                        Accelerator                               Accelerator
                                                                                                         Accelerator Efficiency: 95%
                        Cache
 Mobile       Base                 CRAN                      Mob Core           Telco    OTT Remote
Terminal     Station               Node                       Node              GTW        Server

Case
                       Latency distribution                                     Cache & Accelerators deployment             Speed UP
Study

  A                                                                                                                             2,1
               Term-CRAN         CRAN-Core      Core-OTT Server
  B                35%             25%              40%                                                                         2,4

  C                                                                                                                             2,4

  D            Term-CRAN            CRAN-Core       Core-OTT Server                                                             1,8
                  30%                  55%                15%
  E                                                                                                                             2,4
           Term-CRAN CRAN-Core        Core-OTT Server
  F            15% 20%                       65%                                                                                4,5
Mobile network saving with MEC in cRAN
TH u [Mbps/act. user] = TH per active user
MN Saving% TH qu [Mbps/act. user] = SU* TH u = TH per active user with ECC
10 n [k users] = number of k users = 0,5 [K user]
10 CC [act.user/user] = contemporaneity coefficient = 0,5
TH q [Gbps] = total downstream TH managed by TC
TH q [Gbps] = SU*n*cc*TH u [Mbps/active user]
70 %
MN Saving%/10 with SU = 3
50 % 5
30 % MN Saving%/10 with SU = 1,2
0 5 10 15 20 25 30 35
TH u [Mbps/act user]
- 30 % SU
1,2 6 12 18 24 30
TH qu [Mbps/act user]
- 50 % -5 3 15 30 45 60 75
1,2 1,5 3 4,5 6 7,5
TH q [Gbps]
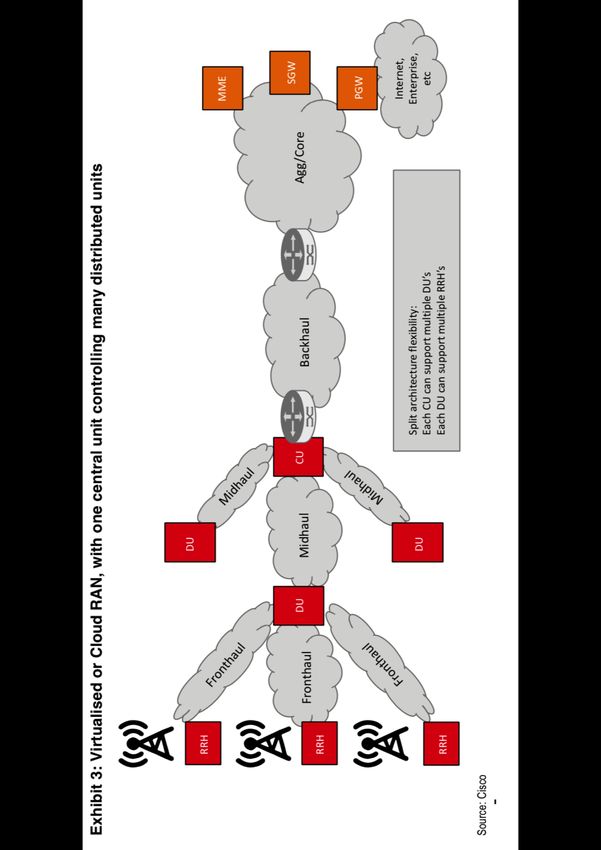
3 3,75 7,5 11,25 15 18,75Virtualised or Cloud RAN
HSBC cautious projections:
Ø Capex saving 29%
Ø Opex saving 25%
Ø TCO saving 26% over 5 years
RRH: Remote Radio Head
DU: Distributed Unit
CU: Central Unit
MME: Mobility Man. Entity
SGW: Serving GW
PGW: Packet GW
1–10 Km 40–80 Km 200 Km
Source: HSBC Global Research Diversified Telecom: “5G and the cloud. Will it change your life?”, September 2019Impact of infrastructure sharing on CAPEX
RELEVANT SCENARIOS FOR 5G ROLLOUT IN THE UKSaving obtained by network sharing
without Edge Cloud Computing
PLNM: Public Land Mobile Network
Source: NEC Europe Ltd Germany,
K. Samdanis, X. Costa-Perez, V. Sciancalepore “The 5G Network Slice Broker From Network Sharing to Multi-tenancy”European Telecom sector: issues on sustainability
31 January 2019
Figure 5: European telecoms – just over 4% CFROI
Source: Credit Suisse HOLT
Spectrum is key
Cash Flow Return On Investment (CFROI) for the European telecoms sector
At the conference there was a much clearer view around spectrum that allocating and
bringing live spectrum is absolute key.
is currently just over 4%, highlighting the issues the sector has to generate a
The 3.5GHz band is going to be the prime 5G spectrum band (not a huge surprise) as it
return
offers on
both investment
capacity and relatively strong coverage characteristics (vs mmWave).
Figure 6: Mid-band (eg 3.5GHz) provide balance between capacity and coverage
Source: Credit Suisse, European Telecoms Equity Research: “Getting out of the rut”, 17 April 2019
Credit Suisse, European Telecoms Equity Research: “5G – more than just next G ?”, January 31st 2019Conclusions: takeaways and open issues
Thanks for your time!
Back Up
“Traditional” reference architecture (as is)
                                        Remote Server     Application                   ‘Traditional’ architecture:
                                                          Services
                                                                                        •   L2 transport from End User to Core

                                                              L3 Transport
                             ITC GTW
                                                                                        •   Fixed and mobile IP Edge in the Core
                            Centralized
  CORE

                             IP Edge:
                            EPC, BRAS           IP Edge
                                                                                        •   Performance improvement based on
                           Core Node
                                                                                            QoS (priority and bw reservation)
                                                                                        •   L3 transport from Core to Remote Server
           Metro
  EDGE

                           Metro Node                                                   •   Virtual RAN in mobile access

                                                             L2 Transport
           Aggregation

                                               Virtual RAN
                                               and OLT
                          Access Node
                                                                                           Apps performance limited by RTT and PL,
                                                                                        if Bit Rate is not the bottleneck
  ACCESS

                          Mobile
                           site                                              Netw.       ‘High’ Network cost and Services Time To
                                                                                        Market
                                                              L2

                                    End Users                                Services
                                     devices                                 Applic.
                                                              L3

                                                                             Services
L3 and L3 are related to the Internet protocols stack
Virtualised or Cloud RAN capex and opex
MEC cost MEC cost
HSBC cautious projections:
• Capex saving 29%
• Opex saving 25%
• TCO saving 26% over 5 years
Source: HSBC Global Research Diversified Telecom: “5G and the cloud. Will it change your life?”, September 2019Criticità del 5G oggi
July 18, 2019
South Koreans complain at poor quality of 5G network
Qualità dei servizi applicativi Asian country has 77% of world’s 5G users but service is patchy
§ Accesso radio 5G ("new radio”), ma
▪ La banda base disponibile, anche dopo le gare per la banda 5G, non consente un bit rate
radio di 10 Gbps per un settore (con un’efficienza spettrale molto alta - 25 bit/s/Hz -
servirebbero 400 MHz di banda base)
▪ l’efficienza spettrale è “bassa” (massive MIMO e beam forming non sono ancora pronti)
▪ Conclusione: il bit rate in accesso è pari a circa 1-2 Gbps per un settore
▪ Il 5G stand alone non è ancora disponibile (si utilizza la rete 4G a monte dell’accesso radio e nel
core)
▪ Gli indicatori che determinano la qualità dei servizi applicativi (la velocità dell’accesso a
Internet) sono quelli del 4G. Il bit rate dell’accesso radio è più alto di quello del 4G, ma
questo non migliora, in modo significativo, le prestazioni
▪ Conclusione:
▪ la qualità dei servizi su rete 5G è in pratica ‘uguale’ a quella della rete 4G, poiché
dipende da indicatori di prestazioni "end to end” (KPI). I KPI sono:
▪ Throughput, RTT, Download Time e Video Delay
▪ l’architettura ECC (o MEC) consente di migliorare le prestazioni delle applicazioniCriticità del 5G oggi
Sostenibilità economica
§ Costo della banda base: prezzo di assegnazione della banda a 3,6 GHz in Italia è stato, fino ad
oggi, il più alto in Europa (prezzo medio: 36 centesimi di Euro/POP/MHz)
§ Saving ottenuti con
§ Virtual/Cloud RAN
§ l’architettura Edge Cloud Computing (o Multi-access Edge Computing)
§ Sharing di infrastrutture passive e attive di rete
§ Ricavi incrementali abilitati da ECC
Monetizzazione
§ I Telco considerano il Bit Rate in accesso come il principale indicatore di qualità e presentano la
rete 5G come più veloce, cioè in grado di migliorare le prestazioni dei servizi applicativi. Oggi
questo non è in generale vero e quindi ha un impatto negativo sui ricavi dei Telco
§ Per monetizzare le reti mobili UBB (4G e 5G) i Telco dovrebbero inserire piattaforme Edge Cloud
Computing in alcuni dei punti di aggregazione delle stazioni radio base delle reti mobili 4G e 5G.
Questo migliora le prestazioni dei servizi applicativi e, in molti casi, riduce i costi di reteCriticità del 5G oggi
Consensus on Multi-access Edge Computing:
(1) HSBC: 5G will gain scale in 2020, but some operators are better positioned than others. 5G services in
2020 will be based on Release 16 – the ‘full’ 5G standard. This will enable services that are substantially
different – but operators with a 5G core network and Mobile Edge Compute (MEC) capabilities will have
an advantage
(2) ETSI: "Multi-access Edge Computing is regarded as a key technology to bring application-oriented
capabilities into the heart of a carrier’s network, in order to explore a wide range of new use cases,
especially those with low latency requirements. When it comes to deploying MEC, there are many
potential scenarios where MEC can fit in, and – as the name clearly spells out – these are not limited to 4G
or 5G at all! As a universal access technology, MEC offers itself to any application that has locality
requirements like a shopping mall or a sports arena, or wherever low latency is required”.
Sources:
(1) HSBC Global Research Diversified Telecom: “5G and the cloud. Will it change your life?”, September 2019
(2) ETSI: White Paper No. 24, MEC Deployments in 4G and Evolution Towards 5G. First edition, February 2018Application Services key performance indicators (1)
Application throughput Download Time
n Application throughput (TH) measures the ‘speed’ of the n Download Time (DT, s) is a performance parameter
application (Mbit/s). linked to end users requests response time (such as web
server’s response time)
n Bit rate (BR) measures the ‘speed’ of the communication
channel (Mbit/s) n It depends on: the packets exchanged between the End
User and the application server in the first phase of the
n It is limited by BR: TH =< BR. If BR is not the bottleneck, it ‘connection’ and the throughput
depends on: round trip time (RTT) and packet loss (PL).
The increase of RTT and PL reduces the TH.
In UBB networks throughput is lower than Download time in the order of 1-1,5 s is
bit rate (in many cases much lower!) required
Ø Application throughput and download time are the main drivers
Ø to enable new services (such as 4K VoD streaming and augmented/virtual reality)
Ø to improve/provide technical QoE for application services
PL is the number of packets lost in the path source-destination-source due to transmission errors and router’s queuesApplication Services key performance indicators (2)
Round Trip Time Video Delay
n Round Trip Time (RTT [ms]) is the time a packet requires n Video Delay (D [s]) is the amount of time between the
to go from the source to the destination and to go back instant a frame is captured and the instant that frame is
to the source displayed at the end user device. It is a KPI for live
streaming services
n It depends on the network load (increases with the
network load, i.e. packets/s managed by the network) n Video Delay can be reduced if the TH jitter (TH values
fluctuations) is reduced. When the TH has a ‘small’
n Very low RTT values are needed for real time verticals jitter the number of seconds of the video buffer needed
to compensate the jitter can be reduced
RTT values in the range 1-5 ms are needed Video Delay to day is about 30-40 s and the
for real time verticals such as autonomous required value is about 4-6 s
driving
Ø Round Trip Time and Video Delay are the main drivers
Ø to enable real time services (RTT) or near real time services (RTT and D)
Ø to improve/provide technical QoE for live streaming services (D)Contents and Apps closer to End Users…
à impact on network architecture (1/2)
4G Mobile Network Architecture ‘As Is’
(Physical)
(Apps, QoE platf.)Contents and Apps closer to End Users…
à impact on network architecture (2/2)
Mobile Architecture ‘To-Be’: virtual RAN, Distribution of EPC, Apps and CD Platforms
(Physical,
vQoE)
(vEPC, Apps,
QoE platf.)
V-EPC
V-EPC
V/C RANSaving by ECC platforms
Saving evaluation
The cost saving is evaluated making reference to a defined IP network with its topology,
technologies and network segments unitary costs (Access, Aggregation, Metro and Core), by the
following equation
Network Cost (no ECC; TH=TH q) – Network Cost (ECC; TH q)
Saving =
Network Cost (no ECC; TH=TH q)
Where:
• Network Cost (no ECC; TH = TH q) is the traditional IP Network architecture cost (i.e.
centralized IP Edge and no ECC platforms).
The total peak throughput of the traditional network (TH) is equal to the total peak
throughput of the network with ECC platforms (THq), because network cost depends on TH q
• Network Cost (ECC; TH = TH q) is the Edge Cloud Computing network architecture cost (i.e.
network with distributed ECC platforms).
The ECC network cost components are: the cost of the network segments (that may be lower
than the costs of the network segments without ECC) and the costs of the ECC platformLTE User Plane Protocol Stack from UE to EPC Protocol stack between UE and eNodeB • PDCP (Packet Data Convergence Protocol) IP L3 is ‘visible’ only • RLC (Radio Link Control) after P-GW • MAC (Medium Access Control) Packets in the core network (EPC) are encapsulated and tunneled between the P-GW and the eNodeB (GTP: GPRS Tunnelling Protocol)
LTE Control Plane Protocol Stack from UE to MME

RRC: Radio Resource Control layer is responsible for configuring the lower layers.
The Control Plane handles radio-specific functionality which depends on the state of the user
equipment which includes two states: idle or connected.
NAS: Non-Access Stratum is a set of Protocols used to convey non radio signaling between user equipment and MME (Mobility
Management Entity) for LTE/E-UTRAN access.
NAS procedures are grouped in two categories: EMM (Evoved Mobility Management) and ESM (Evolved Session Management).
SCTP: Stream Control Transmission Protocol. It is a layer 4 protocol designed to transport Public Switched Telephone Network (PSTN)
signaling messages over IP networks, but is capable of broader applications.
Criticità delle reti UBB
VANTAGGI TECNOLOGICI DEL 5G

• Velocità di trasferimento dei
 dati fino a 100 volte maggiore

• Sensibile riduzione della
 latenza che la avvicina allo
 zero

• Possibilità di gestire fino ad un
 milione di dispositivi per km2

• Maggiore longevità delle
 batterie dei dispositivi

• Flessibilità e indipendenza di                         Criticità
 accesso                                                 July 18, 2019
                                                         South Koreans complain at poor quality of 5G network
                                                         Asian country has 77% of world’s 5G users but service is patchy
  ICOM: Lo sviluppo del 5G in Italia tra competitività e sicurezza nazionale, Roma, Camera dei deputati, 25 settembre 2019
Criticità e driver per la trasformazione
IL 5G IN ITALIA
dei servizi applicativi e delle reti UBB dei Telco
Principali criticità Come ridurre/eliminare
per i Telco
Nel DESI 2019 l’Italia è tra i Paesi UE
Telco OTT
5G readiness dei Paesi europei
le criticità
→ 24a per digitalizzazione dell’economia e della società 70%
Time to market
→ 2a per lo stato di avanzamento del 5G.
60%
1
+++ + Separazione
50%
(TTM)
FATTORI DI SVILUPPO
40%
30% tra servizi
✓ Città per le sperimentazioni 5G (bando 5 città in 5G,
20% applicativi
individuate già nel 2017 Milano, Prato, L’Aquila, Bari e Matera) e 2
Total Cost of
10%
++++
✓ Altre sperimentazioni sulla base di accordi
Ownership (TCO)
volontari tra gli
0%
+ servizi di Architettura
operatori e i comuni a Roma, Torino, Napoli e Genova.
rete ECC (o MEC)
✓ Spettro armonizzato a livello UE per la bb mobile
assegnato al 94% n Da migliorare n Limiti sulle prestazioni dovuti Distribuzione
Prestazioni dei
→ bande 3,6 GHz, 26 GHz en700Basata MHz chesu QoS
messa a disposizione entro luglio 2022 (da e
di livello 2
però (trasporto
verrà
3)il valore
qui
alle reti dei Telco di
Basata
n Fonte: suCommission,
distribuzione di CD (giugno 2019)
Serv. Applicativi
European Digital Scoreboard
che indica l’Italia pronta al 60%, che la posiziona platforms (piattaforme IP di • IP Edge
comunque seconda in Europa).
▪ livello 4) di
il prezzo e di App
assegnazione della banda 3,6 GHz • èContent
in Italia risultato fino
n Monetizzazione legata al n Non importante Delivery
ad ora il più alto in Europa= in media 36 centesimi di EUR/pop/MHz.
Monetizzazione miglioramento delle ▪ assegnazione record per l’erario, ma allo stesso tempo Platforms
una spesa
prestazioni delle applicazioni
UBB partecipazione all’asta + investimenti per il roll-out•delleApps
ingente per gli operatori (remunerazione investimenti per la
Importante non perdere questo vantaggio reti).
→ importante garantire la rapidità nelle procedure amministrative
Source: ICOM, Lo sviluppo del 5G in Italia tra competitività e sicurezza relative ai permessi per l’implementazione delle reti 5G, in modo che
nazionale, Roma, Camera dei deputati, 25 settembre 2019 questa sia efficace, veloce e sostenibile (oltre che sicura).Virtualised or Cloud RAN opex
MEC cost MEC cost
Source: HSBC Global Research Diversified Telecom: “5G and the cloud. Will it change your life?”, September 2019You can also read