Chiroptical Characteristics of Nanosegregated Phases in Binary Mixture Consisting of Achiral Bent-Core Molecule and Bent-Core Base Main-Chain ...
←
→
Page content transcription
If your browser does not render page correctly, please read the page content below
polymers
Communication
Chiroptical Characteristics of Nanosegregated Phases in Binary
Mixture Consisting of Achiral Bent-Core Molecule and
Bent-Core Base Main-Chain Polymer
Ju-Yong Kim              , Jae-Jin Lee and Suk-Won Choi *

                                          Department of Advanced Materials Engineering for Information & Electronics, Integrated Education Institute for
                                          Frontier Science & Technology (BK21 Four), Kyung Hee University, Yongin 17104, Korea;
                                          kjuyong0818@naver.com (J.-Y.K.); jjking1443@naver.com (J.-J.L.)
                                          * Correspondence: schoi@khu.ac.kr; Tel.: +82-031-201-2256

                                          Abstract: In this paper, a binary mixture system consisting of an achiral bent-core molecule and a
                                          bent-core base main-chain polymer is described. The mixture exhibits an intriguing nanosegregated
                                          phase generated by the phase separation of the helical nanofilament B4 phase (originating from the
                                          bent-core molecule) and the dark conglomerate phase (originating from the bent-core base main-
                                          chain polymer). This nanosegregated phase was identified using polarized optical microscopy,
                                          differential scanning calorimetry, and X-ray diffraction analysis. In this nanosegregated phase, the
                                          enantiomeric domains grew to a few millimeters and a giant circular dichroism was observed. The
                                          structural chirality of the helical nanofilament B4 phase affected the conformation of the bent-core
                                          base main-chain polymer embedded within the helical nanofilament networks of bent-core molecules.

                                          Keywords: bent-core molecules; polymers; chirality; liquid crystals; circular dichroism
Citation: Kim, J.-Y.; Lee, J.-J.; Choi,
S.-W. Chiroptical Characteristics of
Nanosegregated Phases in Binary
Mixture Consisting of Achiral             1. Introduction
Bent-Core Molecule and Bent-Core               Since the discovery of chiral resolution in achiral bent-core (BC) molecular systems [1],
Base Main-Chain Polymer. Polymers         studies on such molecules have been actively conducted by chemists and physicists in the
2022, 14, 2823. https://doi.org/          field of liquid crystal (LC) science [2–11]. The LC phases found in BC molecular systems
10.3390/polym14142823
                                          differ from the conventional phases found in classic calamitic or discotic ones [12,13].
Academic Editors: Tibor Toth-Katona       Among the LC phases in BC systems, the helical nanofilament (HNF) B4 phase has attracted
and Istvan Janossy                        significant interest owing to its unprecedented chiral superstructure, in which twisted
                                          nanofilaments are formed through the self-assembly of achiral molecules [14]. Subsequent
Received: 29 May 2022
                                          studies considered the B4 phase to be semi-crystalline rather than LC [15]. However, the
Accepted: 7 July 2022
                                          subject of chirality-related properties, such as strong optical activity and large effective
Published: 11 July 2022
                                          nonlinear optical coefficients, has inspired several LC research groups [14].
Publisher’s Note: MDPI stays neutral           Another intriguing symmetry-broken phase observed in achiral BC molecular systems
with regard to jurisdictional claims in   is the dark conglomerate (DC) phase [5,14]. This phase is generally observed after direct
published maps and institutional affil-   cooling in the isotropic phase, which is optically isotropic and forms a macroscopic chiral
iations.                                  domain. Although the optical appearance of the DC phase is similar to that of the B4 phase,
                                          the DC phase is fluid and can be considered to be a disordered lamellar phase resembling
                                          the lyotropic sponge (focal conic) phases, wherein the empty volume is filled by smectic
                                          layers with a saddle splay layer deformation [5,10,14]. The DC phase often emerges in BC
Copyright: © 2022 by the authors.
                                          molecules with a B2 or B7 phase and has been reported in BC polymeric systems [11].
Licensee MDPI, Basel, Switzerland.
                                               Takanishi et al. reported that when a BC molecule exhibiting the B4 phase is mixed
This article is an open access article
distributed under the terms and
                                          with a rod-like LC molecule, the B4 phase is stabilized preferentially over the other LC
conditions of the Creative Commons
                                          phases that appear in BC molecular systems, such as the B2 and B3 phases [16]. Further-
Attribution (CC BY) license (https://     more, the chiral enantiomeric domains become significantly larger (up to a few millimeters
creativecommons.org/licenses/by/          larger in size) than those in the B4 phase of the pure BC molecule [16]. Subsequent studies
4.0/).                                    have suggested that the phases in which the enantiomeric domains become unusually large

Polymers 2022, 14, 2823. https://doi.org/10.3390/polym14142823                                              https://www.mdpi.com/journal/polymers
Polymers 2022, 14, 2823                                                                                           2 of 9

                          are nanosegregated phases between the B4 phase (originating from BC molecules) and the
                          calamitic phases (originating from rod-like molecules) [9,14]. Otani et al. examined the
                          behavior of rod-like molecules in nanosegregated phases in which the rod-like molecules
                          were embedded in the framework of the HNF B4 structure network, that is, a network of
                          HNFs, formed by the BC molecules [17]. Based on circular dichroism (CD) observations, it
                          was suggested that the rod-like molecules in the network of HNFs form a chiral superstruc-
                          ture that is affected by the HNF structure; thus, the chirality of the binary system can be
                          boosted [17,18].
                                In this study, we performed chiroptical observations on a novel binary mixture consist-
                          ing of a host BC molecule possessing the HNF B4 phase and a guest BC-based main-chain
                          polymer (BCMP) possessing a DC phase. Binary systems composed of low-molecular BCs
                          and BC-based polymers have rarely been investigated; therefore, details on the chiroptical
                          properties of the intermediate phases of binary systems have also rarely been reported.
                          Two different nanosegregated phases were identified in this binary system using polarized
                          optical microscopy (POM), differential scanning calorimetry (DSC), and X-ray diffraction
                          (XRD) analysis. In the nanosegregated phase observed in the high-temperature range,
                          the BC molecule was in the B2 phase and the BCMP was in the DC phase. In the low-
                          temperature nanosegregated phase, in which the BC molecule was in the HNF B4 phase
                          and the BCMP was in the DC phase, the enantiomeric domains grew to a few millimeters
                          in size, and a significantly strong CD intensity was observed.

                          2. Experimental Section
                          2.1. Materials
                               The chemical structures of the BC and BCMP used in this study are presented in
                          Figure 1a. The BC molecule and BCMP were synthesized by our group. The BC and
                          BCMP were synthesized using the methods reported by Akutakawa [19] and Gimeno [11],
                          respectively. The phase sequences of the pure BC molecule and BCMP upon cooling were
                          Iso-172 ◦ C-B2-145 ◦ C-B3-138 ◦ C-B4 and Iso-168 ◦ C-DC, respectively. The BC molecule
                          and BCMP used contained the HNF B4 and DC phases in the low-temperature range,
                          respectively. Figure 1b shows typical POM images of the HNF B4 phase (BC molecule)
                          and DC phase (BCMP). Upon the uncrossing of the polarizer by moving it clockwise
                          and counterclockwise by a few degrees, the interchanging of the colors of the two small,
                          grainy domains in the HNF B4 phase corresponding to the BC molecule could be observed,
                          indicating the existence of two enantiomeric domains with an almost identical degree
                          of optical rotation but different signs [14]. Similarly, the two different-colored domains
                          observed in the DC phase corresponding to the BCMP under uncrossing conditions suggest
                          that the two enantiomeric domains had the same degree of optical rotation but different
                          signs [14].

                          2.2. XRD Analysis
                               One-dimensional XRD measurements were performed employing a rotating-anode
                          X-ray generator (Cu-Kα) and a diffractometer (Rigaku, Austin, TX, USA). The widths and
                          peak positions of the diffraction angles were calibrated using silicon crystals. To monitor
                          the changes in the local structure with respect to temperature, a hot stage calibrated with
                          an error margin of ±1 ◦ C was coupled to the diffractometer. The samples were scanned
                          across the q range of 1–5 nm−1 at a scanning rate of 1 ◦ C min−1 .

                          2.3. CD Measurements
                               The mixture was injected into a sandwich cell (cell gap less than 2 µm) consisting
                          of two quartz substrates. The inner surfaces of the cell were left untreated to prevent
                          the phases from exhibiting a large birefringence. CD spectra were recorded using a CD
                          spectrometer (J-815, Jasco, Hachioji, Japan). The CD signals were detected from an area of
                          1 mm in diameter.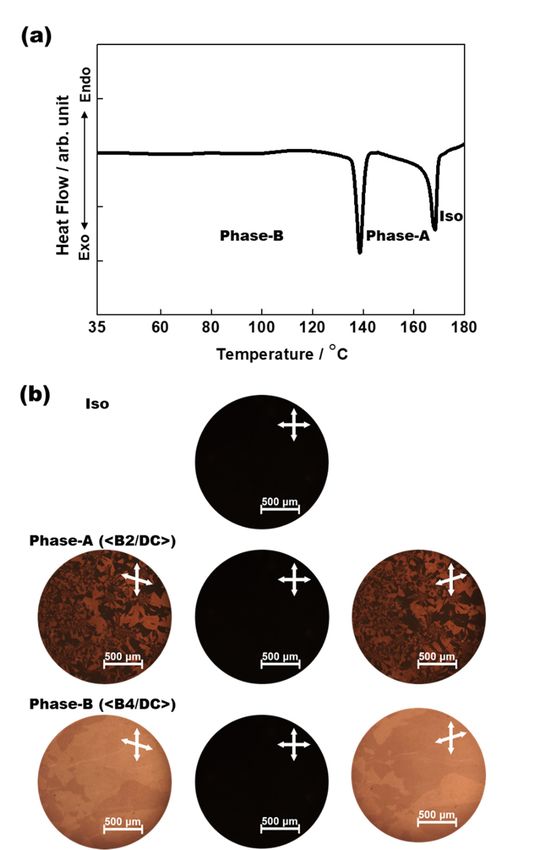
Polymers 2022, 14, 2823 3 of 9
Polymers 2022, 14, x FOR PEER REVIEW 3 of 10
Figure 1. (a) Chemical structures of the BC molecule and BCMP used in this study. (b) Typical POM
Figure 1. (a) Chemical structures of the BC molecule and BCMP used in this study. (b) Typical POM
images of the HNF B4 phase (BC molecule) and DC phase (BCMP).
images of the HNF B4 phase (BC molecule) and DC phase (BCMP).
3.2.2. XRD Analysis
Results
One-dimensional
Mixtures XRD fractions
with different measurements of the were performed
BC molecule andemploying
BCMP were a rotating-anode
prepared. How-
X-ray generator (Cu-Kα) and a diffractometer (Rigaku, Austin,
ever, meaningful phases were not observed in the BCMP-rich systems because TX, USA). The the
widths and
DC phase
peak positions of the diffraction angles were calibrated using silicon crystals. To monitor
was dominant. On the other hand, two distinct phases (Phase-A and Phase-B) were seen
the changes in the local structure with respect to temperature, a hot stage calibrated with
clearly in the BC molecule-rich systems using DSC and POM. Figure 2 shows the typical
an error margin of ±1 °C was coupled to the diffractometer. The samples were scanned
DSC profiles and POM images obtained during the cooling of the binary system, consisting
across the q range of 1–5 nm−1 at a scanning rate of 1 °C min−1.
of 70 wt% BC and 30 wt% BCMP. Two distinct peaks were detected in the DSC profile, as
shown in Figure 2a, and the typical POM images for the corresponding temperature range
2.3. CD Measurements
are given in Figure 2b. POM images were observed with Eclipse E600W (Nikon, Tokyo,
Japan)The mixturewith
equipped was ainjected
LTSE420 intotemperature
a sandwich control
cell (cellunit
gap (Linkam,
less than 2Redhill,
μm) consisting
UK). Whenof
twotemperature
the quartz substrates. The inner
was lowered fromsurfaces of the cell were
that corresponding leftIso
to the untreated to prevent
phase, which the
exhibited
phases from exhibiting a large birefringence. CD spectra were recorded
a perfectly dark state under crossed polarizers, a different phase (Phase-A) distinct fromusing a CD
spectrometer
the Iso phase (J-815, Jasco,two
appeared; Hachioji, Japan).
different The CD signals
dark-colored werewere
domains detected from anwhen
observed area ofthe
1 mm in diameter.
upper polarizer was rotated slightly clockwise (or anticlockwise). The two colors switched
under opposite uncrossing conditions. Upon further cooling, another phase (Phase-B) with
3. Results
a higher brightness was observed; the sizes of the two-colored domains were larger in
Mixtures
this domain. with different
Interestingly, the fractions
domains of the BC in
observed molecule
Phase-Band
wereBCMP were prepared.
significantly larger the
However,observed
domains meaningful phases were
in Phase-A, and not observed
they becamein the BCMP-rich
larger, systems
up to a few because
millimeters inthe
size.
DC phase was dominant. On the other hand, two distinct phases (Phase-A and Phase-B)
These unusual domain sizes in Phase-B are comparable to those seen in the nanosegregated
were seen
phases clearly
of mixed in the BC
systems molecule-rich
consisting systems
of BC and using
rod-like DSC and POM. Figure 2 shows
molecules.
the typical DSC profiles and POM images obtained during the cooling of the binary
system, consisting of 70 wt% BC and 30 wt% BCMP. Two distinct peaks were detected in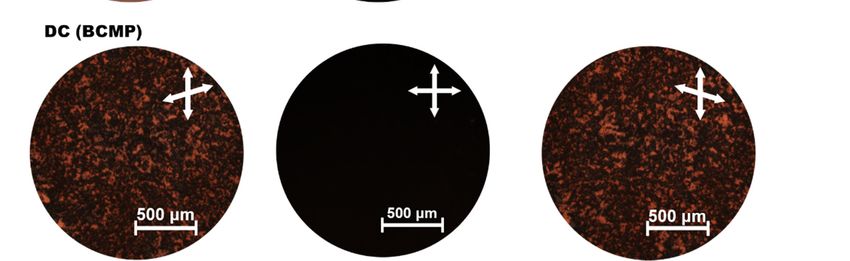
another phase (Phase-B) with a higher brightness was observed; the sizes of the two-
                          colored domains were larger in this domain. Interestingly, the domains observed in
                          Phase-B were significantly larger the domains observed in Phase-A, and they became
                          larger, up to a few millimeters in size. These unusual domain sizes in Phase-B are
Polymers 2022, 14, 2823   comparable to those seen in the nanosegregated phases of mixed systems consisting of4BC
                                                                                                               of 9
                          and rod-like molecules.

                          Figure
                          Figure 2.
                                 2. (a)
                                    (a) Typical DSCprofile
                                        Typical DSC profileobtained
                                                            obtainedduring
                                                                     during  the
                                                                           the   cooling
                                                                               cooling of aofbinary
                                                                                              a binary mixture
                                                                                                    mixture    consisting
                                                                                                            consisting of 70ofwt%
                                                                                                                               70
                          wt% BC molecule and 30 wt% BCMP. (b) Typical POM images of Iso, Phase-A, and Phase-B.
                          BC molecule and 30 wt% BCMP. (b) Typical POM images of Iso, Phase-A, and Phase-B.

                               XRD
                               XRD measurements
                                     measurements werewere performed
                                                           performed to
                                                                      to elucidate
                                                                         elucidate the
                                                                                    the local
                                                                                         local structures
                                                                                               structures of
                                                                                                          of Phase-A
                                                                                                             Phase-A and
                                                                                                                     and
                          Phase-B.
                          Phase-B. Figure 3a shows a typical XRD profile in the temperature range of Phase-A for aa
                                   Figure  3a  shows  a typical XRD profile in the temperature     range of Phase-A for
                          small-angle region, and the XRD profiles of pure B2 (originating from the BC molecule) and
                          pure DC (originating from the BCMP). In the pure B2 phase, three distinct diffraction peaks
                          were detected (at 1.3, 2.6, and 3.9 nm−1 ), while in the pure DC phase, two distinct peaks
                          were observed (at 1.45 and 4.37 nm−1 ). As shown in Figure 3a, the XRD profile for Phase-A
                          could be considered to be a simple superposition of those for the pure B2 and DC phases.
                          Thus, Phase-A segregated the  nanophase, whereas the BC and BCMP were in the
                          B2 and DC phases, respectively. Figure 3b exhibits a typical XRD profile in the temperature
                          range of Phase-B for a small-angle region along with the XRD profiles of pure HNF B4
                          (originating from the BC) and pure DC (originating from the BCMP). In the pure B4 phase,
                          three distinct diffraction peaks were observed (at 1.6, 3.2, and 4.8 nm−1 ). The XRD pattern
                          of Phase-B also appeared to be a superposition of those of HNF B4 (BC) and DC (BCMP).
                          Thus, Phase-B segregated the  nanophase, in which the BC and BCMP were in the
                          HNF B4 and DC phases, respectively. Based on the results of the above-mentioned DSC,
                          POM, and XRD analyses, upon cooling, the binary system consisting of 70 wt% BC molecule
                          and 30 wt% BCMP was assigned the structure Iso-168 ◦ C--140 ◦ C-. A
B4 phase, three distinct diffraction peaks were observed (at 1.6, 3.2, and 4.8 nm−1). The
                                       XRD pattern of Phase-B also appeared to be a superposition of those of HNF B4 (BC) and
                                       DC (BCMP). Thus, Phase-B segregated the  nanophase, in which the BC and
                                       BCMP were in the HNF B4 and DC phases, respectively. Based on the results of the above-
   Polymers 2022, 14, 2823
                                       mentioned DSC, POM, and XRD analyses, upon cooling, the binary system consisting        of
                                                                                                                            5 of 9
                                       70 wt% BC molecule and 30 wt% BCMP was assigned the structure Iso-168 °C--
                                       140 °C-. A phase diagram of the various mixtures with different fractions of the
                                       BC molecule and BCMP is shown in Figure 4.
                                       phase diagram of the various mixtures with different fractions of the BC molecule and
                                       BCMP is shown in Figure 4.

                                       Figure 3. (a) A typical small-angle-region XRD profile obtained over a temperature range corre-
                                       Figure 3. (a) A typical small-angle-region XRD profile obtained over a temperature range
                                       sponding to Phase-A and XRD profiles of pure B2 (originating from BC molecules) and pure DC
                                       corresponding to Phase-A and XRD profiles of pure B2 (originating from BC molecules) and pure
                                       (originating from BCMP). (b) A typical small-angle-region XRD profile obtained over a temperature
                                       DC (originating from BCMP). (b) A typical small-angle-region XRD profile obtained over a
                                       range corresponding
                                       temperature           to Phase-B and
                                                     range corresponding  to XRD profiles
                                                                             Phase-B      of pure
                                                                                     and XRD      HNF B4
                                                                                               profiles    (originating
                                                                                                        of pure HNF B4from  BC) and from
                                                                                                                        (originating pure
                                       DC (originating
                                       BC)  and pure DCfrom  BCMP). from BCMP).
                                                         (originating

                                            Figure 5a
                                            Figure   5a shows
                                                         showsthe
                                                                thetypical
                                                                    typicalCDCDspectra
                                                                                 spectrainduced from
                                                                                          induced      thethe
                                                                                                    from   positive enantiomeric
                                                                                                               positive  enantiomericdo-
                                       mains   in Iso, ,    and      for the binary  system   consisting  of
                                       domains in Iso, , and  for the binary system consisting of 70 wt% BC  70   wt%  BC
                                       molecule   and  30 wt% BCMP.   The  absorbance  spectrum of the  binary system  is
                                       molecule and 30 wt% BCMP. The absorbance spectrum of the binary system is shown in shown   in the
                                       inset of Figure 5a. Figure 5b shows the maximum CD peak intensity of the positive domain
                                       the inset of Figure 5a. Figure 5b shows the maximum CD peak intensity of the positive
                                       at approximately 415 nm as a function of temperature. Intriguingly, a small change in the
                                       domain at approximately 415 nm as a function of temperature. Intriguingly, a small
                                       peak intensity was observed; this occurred within the phase-transition temperatures of the
Polymers 2022, 14, x FOR PEER REVIEW   change in the peak intensity was observed; this occurred within the phase-transition
                                                                                                                          6 of 10
                                       binary mixture. Significant CD signals were detected in , and these increased
                                       temperatures of the binary mixture. Significant CD signals were detected in , and
                                       gradually when the temperature decreased. Finally, the CD signals detected in
                                       these increased gradually when the temperature decreased. Finally, the CD signals
                                       were significantly larger than those seen in .
                                       detected in  were significantly larger than those seen in .

                                     Figure
                                 Figure     4. Phase
                                        4. Phase     diagram
                                                 diagram      of various
                                                          of various     mixtures
                                                                      mixtures    containing
                                                                               containing    different
                                                                                          different    fractions
                                                                                                    fractions  of of
                                                                                                                   BCBCmolecule
                                                                                                                        moleculeand
                                                                                                                                 and BCMP.
                                 BCMP.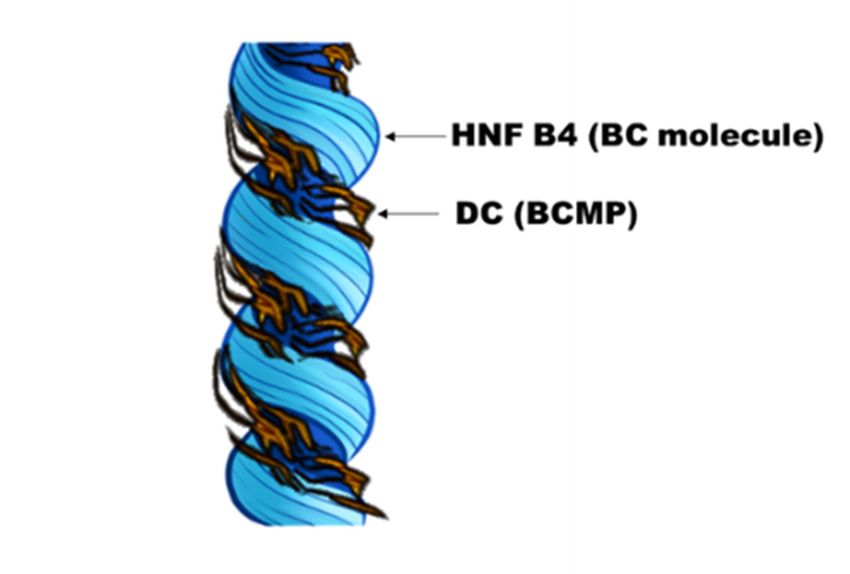
Polymers 2022, 14, 2823   Figure 4. Phase diagram of various mixtures containing different fractions of BC molecule 6and
                                                                                                                      of 9
                          BCMP.

                          Figure
                           Figure5.5.(a)
                                       (a)Typical
                                           Typicalinduced
                                                    induced CD
                                                             CD spectra
                                                                  spectrafrom  positive
                                                                            from        enantiomeric
                                                                                  positive            domains
                                                                                           enantiomeric         in Iso,
                                                                                                          domains       ,
                                                                                                                    in Iso,       and
                                                                                                                            ,
                             in  a binary  mixture  consisting of 70  wt%  BC molecule and  30 wt%  BCMP
                           and  in a binary mixture consisting of 70 wt% BC molecule and 30 wt% BCMP (inset:(inset: absorbance
                          spectrum
                           absorbanceofspectrum
                                           binary mixture)    and (b) and
                                                    of binary mixture)    maximum     CD peak
                                                                              (b) maximum        intensity
                                                                                            CD peak         of of
                                                                                                      intensity positive
                                                                                                                   positivedomain
                                                                                                                            domainatat
                          approximately 415 nm as a function of temperature.
                           approximately 415 nm as a function of temperature.

                          4. Discussion
                               We focused on the nanosegregated  phase with unusually large enantiomeric
                          domains (a few millimeters in size) and giant CD signals. Figure 6a shows a comparison
                          of the typical induced CD spectra of pure HNF B4 (BC molecule), pure DC (BCMP), and
                           (binary mixture). The absorbance spectra of the BC molecule and BCMP are
                          presented in the inset of Figure 6a. A large optical rotation was predicted for the DC
                          phase [5]; however, the observed CD signals were negligible in this case. This was because
                          the observed spot size (1 mm in diameter) was larger than that of the enantiomeric domains
                          (a few hundred micrometers) of the DC phase. Although a single enantiomeric domain
                          possesses a large optical rotation, the two small enantiomeric domains with almost the
                          same degree of optical rotation but different signs, and observed within the same spot size,
                          canceled each other out. However, in , the sizes of the enantiomeric domains
                          increased to a few millimeters (see Figure 2b), and a significantly strong CD intensity
                          signal was observed, as shown in Figure 6a. The small (or negligible) CD signals of HNF
                          B4 (or DC) were amplified by the nanosized separation between HNF B4 and DC. The
                          effect of linear birefringence in  should be considered because the observed CD
                          is the sum of the actual CD and the sample birefringence [18]. To confirm that the linear
                          birefringence did not contribute to the CD signal, POM images were taken while rotating
                          the cell about the cell surface normal under uncrossing conditions. As shown in Figure 6b,
                          the two colors attributable to the two enantiomeric domains with almost the same degree
                          of optical rotation but different signs were not inverted by the rotation of the cell. Thus,
                          the significantly strong CD signals of  are attributable to actual CD and not to
                          linear birefringence.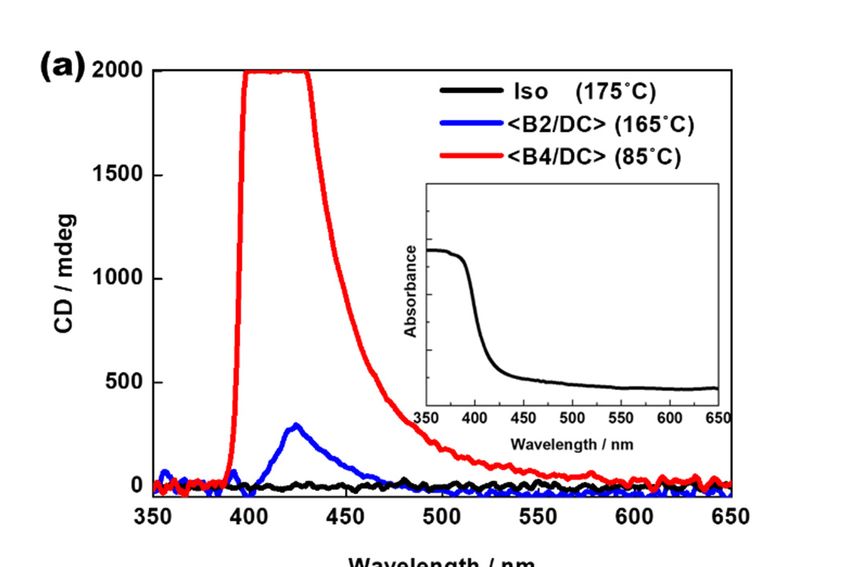
Polymers 2022, 14, 2823                                                                                                       7 of 9

                                        These unusual phenomena observed in  are similar to those reported in the
                                   nanoseparation phases in a mixture consisting of BC and calamitic molecules [17,18]. The
                                   structural chirality of HNF B4 affects the conformation of the BCMP embedded within the
                                   HNF B4 networks of the BC molecules, causing the BCMP to exhibit a chiral conformation,
                                   as shown in Figure 7. In addition, the structural chirality in HNF B4 was amplified by the
                                   DC medium of the BCMP. Thus, the flexibility of the polymeric chains consisting of DC
                                   affected the chiral conformation of the BCMP. As shown in Figure 5b, at a temperature
Polymers 2022, 14, x FOR PEER REVIEW                                                                                    8 of 10
                                   of 50 ◦ C, which is the Tg of the BCMP, the CD intensity in  decreased. This is
                                   because the effect of the structural chirality of HNF B4 on the conformation of the BCMP
                                   was weakened by the lowered flexibility of the polymer chains in the DC phase.

                               Figure 6. (a) Typical induced CD spectra of pure HNF B4 (BC molecule), pure DC (BCMP), and
                                Figure 6. (a) Typical induced CD spectra of pure HNF B4 (BC molecule), pure DC (BCMP), and
                                (binary mixture) (inset: absorbance spectra of pure HNF B4 (BC molecule) and pure DC

                               (BCMP)). (b)(binary
                                              POMmixture)  (inset:
                                                   images of       absorbance
                                                                       spectra
                                                                       taken by       of pure
                                                                                rotating       HNF
                                                                                          the cell   B4 (BC
                                                                                                   about cellmolecule)  and pure
                                                                                                              surface normal     DC
                                                                                                                              under
                                (BCMP)).  (b) POM  images
                               uncrossing conditions.      of    taken by rotating  the cell about cell surface normal under
                                uncrossing conditions.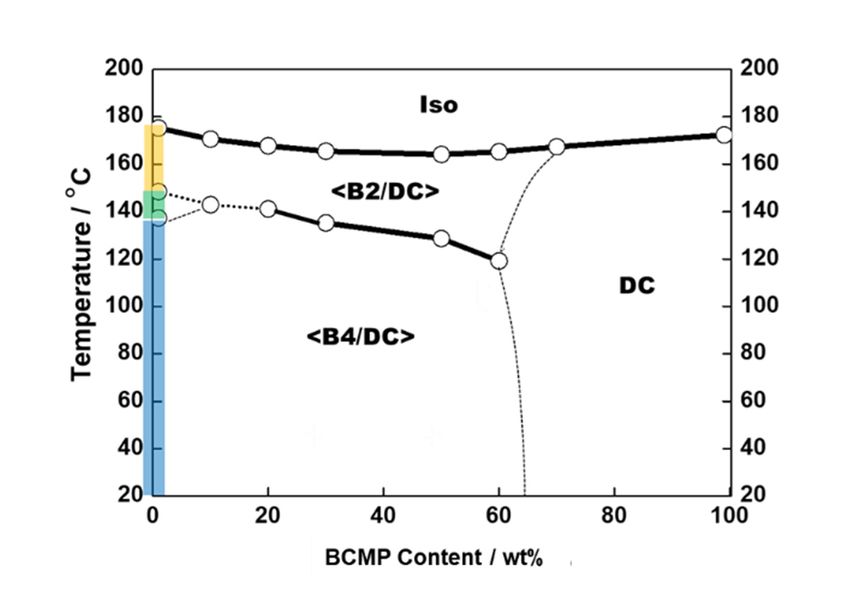
Figure 6. (a) Typical induced CD spectra of pure HNF B4 (BC molecule), pure DC (BCMP), and
                       (binary mixture) (inset: absorbance spectra of pure HNF B4 (BC molecule) and pure DC
Polymers 2022, 14, 2823
                      (BCMP)). (b) POM images of  taken by rotating the cell about cell surface normal under                 8 of 9
                      uncrossing conditions.

                                      7. Proposed
                               Figuremodel
                  Figure 7. Proposed                modelsuperstructure
                                            of the chiral   of the chiral superstructure in the
                                                                            in the ,     ,
                                                                                             assuming thatassuming  that the polymer
                                                                                                           the polymer
                               chains of BCMP   align  in parallel to the groove
                  chains of BCMP align in parallel to the groove of the HNFs.    of the HNFs.

                                 5. Conclusions
                                      Chiroptic observations were performed on a novel binary mixture consisting of a BC
                                 molecule possessing an HNF B4 phase and a main-chain polymeric material possessing
                                 a DC phase. Two distinct nanosegregated phases were observed in the binary system. In
                                 the  phase, observed in the high-temperature range, the BC molecule was in the
                                 B2 phase and the BCMP was in the DC phase. In contrast, another  phase was
                                 observed in the low-temperature range, in which the BC molecule was in the HNF B4 phase
                                 and the BCMP was in the DC phase. In , the enantiomeric domains grew to a few
                                 millimeters, and a significantly strong CD intensity was observed. We confirmed that these
                                 CD signals were not attributed to linear birefringence but to actual CD. It is likely that the
                                 HNF B4 networks of the BC molecules play an important role in the unusual phenomena
                                 observed in this system. The structural chirality of HNF B4 affects the conformation of the
                                 BCMP embedded within the HNF B4 networks of the BC molecules, conferring the BCMP a
                                 chiral conformation. The mesophase systems exhibiting spontaneous phase separation and
                                 hierarchical molecular organization presented in this study should lead to the emergence
                                 of novel chiroptical materials.

                                Author Contributions: Conceptualization, S.-W.C.; validation, J.-Y.K. and J.-J.L.; investigation, J.-Y.K.;
                                writing—original draft preparation, S.-W.C.; writing—review and editing, S.-W.C.; visualization,
                                J.-Y.K. and J.-J.L.; supervision, S.-W.C.; funding acquisition, S.-W.C. All authors have read and agreed
                                to the published version of the manuscript.
                                 Funding: This research was funded by the National Research Foundation of Korea (Grant No. NRF-
                                 2022R1A2C1005620, NRF-2022K2A9A2A08000179, and NRF-2020R1A6A1A03048004) and by the
                                 Ministry of Education (No. 2019R1A6C1010052).
                                 Institutional Review Board Statement: Not applicable.
                                 Informed Consent Statement: Not applicable.
                                 Data Availability Statement: The data presented in this study are available on request from the
                                 corresponding author.
                                 Conflicts of Interest: There are no conflict to declare.

References
1.   Sekine, T.; Niori, T.; Watanabe, J.; Furukawa, T.; Choi, S.W.; Takezoe, H. Spontaneous helix formation in smectic liquid crystals
     comprising achiral molecules. J. Mater. Chem. 1997, 7, 1307–1309. [CrossRef]
2.   Kim, K.; Kim, H.; Jo, S.Y.; Araoka, F.; Yoon, D.K.; Choi, S.W. Photomodulated supramolecular chirality in achiral photoresponsive
     rodlike compounds nanosegregated from the helical nanofilaments of achiral bent-core molecules. ACS Appl. Mater. Interfaces
     2015, 7, 22686–22691. [CrossRef] [PubMed]
Polymers 2022, 14, 2823 9 of 9
3. Kim, B.C.; Choi, H.J.; Lee, J.J.; Araoka, F.; Choi, S.W. Circularly polarized luminescence induced by chiral super nanospaces. Adv.
Funct. Mater. 2019, 29, 1903246. [CrossRef]
4. Lee, J.J.; Kim, B.C.; Choi, H.J.; Bae, S.; Araoka, F.; Choi, S.W. Inverse helical nanofilament networks serving as a chiral nanotemplate.
ACS Nano 2020, 14, 5243–5250. [CrossRef] [PubMed]
5. Hough, L.E.; Spannuth, M.; Nakata, M.; Coleman, D.A.; Jones, C.D.; Dantlgraber, G.; Tschierske, C.; Watanabe, J.; Körblova, E.;
Walba, D.M.; et al. Chiral isotropic liquids from achiral molecules. Science 2009, 325, 452–456. [CrossRef] [PubMed]
6. Hough, L.E.; Jung, H.T.; Krüerke, D.; Heberling, M.S.; Nakata, M.; Jones, C.D.; Chen, D.; Link, D.R.; Zasadzinski, J.; Heppke, G.; et al.
Helical nanofilament phases. Science 2009, 325, 456–460. [CrossRef] [PubMed]
7. Chen, D.; Maclennan, J.E.; Shao, R.; Yoon, D.K.; Wang, H.; Korblova, E.; Walba, D.M.; Glaser, M.A.; Clark, N.A. Chirality-
preserving growth of helical filaments in the B4 phase of bent-core liquid crystals. J. Am. Chem. Soc. 2011, 133, 12656–12663.
[CrossRef] [PubMed]
8. Park, W.; Yoon, D.K. Orientation control of helical nanofilament phase and its chiroptical applications. Crystals 2020, 10, 675.
[CrossRef]
9. Zhu, C.; Chen, D.; Shen, Y.; Jones, C.D.; Glaser, M.A.; Maclennan, J.E.; Clark, N.A. Nanophase segregation in binary mixtures of a
bent-core and a rodlike liquid-crystal molecule. Phys. Rev. E 2010, 81, 011704. [CrossRef] [PubMed]
10. Tschierske, C. Mirror symmetry breaking in liquids and liquid crystals. Liq. Cryst. 2018, 45, 2221–2252. [CrossRef]
11. Gimeno, N.; Sánchez-Ferrer, A.; Sebastián, N.; Mezzenga, R.; Ros, M.B. Bent-core based main-chain polymers showing the dark
conglomerate liquid crystal phase. Macromolecules 2011, 44, 9586–9594. [CrossRef]
12. Takezoe, H.; Takanishi, Y. Bent-core liquid crystals: Their mysterious and attractive world. Jpn. J. Appl. Phys. 2006, 45, 597–625.
[CrossRef]
13. Reddy, R.A.; Tschierske, C. Bent-core liquid crystals: Polar order, superstructural chirality and spontaneous desymmetrisation in
soft matter systems. J. Mater. Chem. 2006, 16, 907–961. [CrossRef]
14. Le, K.V.; Takezoe, H.; Araoka, F. Chiral superstructure mesophases of achiral bent-shaped molecules—Hierarchical chirality
amplification and physical properties. Adv. Mater. 2017, 29, 27966798. [CrossRef] [PubMed]
15. Walba, D.M.; Eshdat, L.; Körblova, E.; Shoemaker, R.K. On the nature of the B4 banana phase: crystal or not a crystal? Cryst.
Growth Des. 2005, 5, 2091–2099. [CrossRef]
16. Takanishi, Y.; Shin, G.J.; Jung, J.C.; Choi, S.W.; Ishikawa, K.; Watanabe, J.; Takezoe, H.; Toledano, P. Observation of very large
chiral domains in a liquid crystal phase formed by mixtures of achiral bent-core and rod molecules. J. Mater. Chem. 2005, 15,
4020–4024. [CrossRef]
17. Otani, T.; Araoka, F.; Ishikawa, K.; Takezoe, H. Enhanced optical activity by achiral rod-like molecules nanosegregated in the B4
structure of achiral bent-core molecules. J. Am. Chem. Soc. 2009, 131, 12368–12372. [CrossRef] [PubMed]
18. Jeon, S.W.; Kim, D.Y.; Araoka, F.; Jeong, K.U.; Choi, S.W. Nanosegregated chiral materials with self-assembled hierarchical
mesophases: Effect of thermotropic and photoinduced polymorphism in rodlike molecules. Chem. Eur. J. 2017, 23, 17794–17799.
[CrossRef] [PubMed]
19. Akutakawa, T.; Matsunaga, Y.; Yashuhara, K. Mesomorphic behaviour of 1,3-phenylene bis[4-(4-alkoxyphenyliminomethyl)
benzoates] and related compounds. Liq. Cryst. 1994, 17, 659–666. [CrossRef]You can also read