The Virgo Cluster - Cambridge University Press
←
→
Page content transcription
If your browser does not render page correctly, please read the page content below
Advancing the Physics of Cosmic Distances
             Proceedings IAU Symposium No. 289, 2012
                                                                                           c International Astronomical Union 2013
             Richard de Grijs, ed.                                                                  doi:10.1017/S1743921312021527

                                                    The Virgo Cluster
                                                               Jeremy Mould1,2
                   1
                       Centre for Astrophysics and Supercomputing, Swinburne University, Hawthorn 3122,
                                                            Australia
                                2
                                  ARC Centre of Excellence for All-sky Astrophysics (CAASTRO)
                                                  email: jmould@swin.edu.au

             Abstract. In the era of precision cosmology, the Virgo cluster takes on a new role in the cosmic
             distance scale. Its traditional role of testing the consistency of secondary distance indicators
             is replaced by an ensemble of distance measurements within the Local Supercluster, united by
             a velocity-field model obtained from a reconstruction based on redshift surveys. The Wilkin-
             son Microwave Anisotropy Probe (WMAP) leads us to see the Hubble constant as one of six
             parameters in a standard model of cosmology with considerable covariance among parameters.
             Independent experiments, such as WMAP, the Hubble Space Telescope Key Project on the
             Extragalactic Distance Scale, and their successors constrain these parameters.
             Keywords. surveys, galaxies: distances and redshifts

             1. Introduction
               At the height of the 1980s distance-scale controversy, the Virgo cluster had iconic
             status. Now, following the Las Campanas Virgo Cluster survey (Binggeli et al. 1985)
             and X-ray imaging, we see Virgo as a concentration of matter to be mapped. Its place
             has been taken by an ensemble of distance measurements within z < 0.01, linked by
             a velocity-field model developed from the 2mass redshift survey. Some expansion-rate
             myths are discussed in this review, and how to see past them. We should be aiming to
             measure H0 to 1% accuracy.

             2. Virgo galaxy distances
                Fig. 1 has been prepared from the NASA Extragalactic Database (NED) compilation of
             Virgo distances. Similar results have been obtained by Mei et al. (2007) using the surface
             brightness fluctuations (SBFs) distance indicator. A map of the cluster in projection is
             furnished by Bohringer et al. (1994), based on ROSAT observations.
                In a dozen years, we have moved from the distance-scale controversy illustrated by
             Table 1 of Tammann (1999) to a cluster-mapping perspective. It is noteworthy that the
             Tully–Fisher (TF) relation, which celebrates its 35th anniversary this year, provided the
             first correct measurement of the distance to Virgo (Mould et al. 1980), (m − M )0 =
             31.0 ± 0.1 mag. No morphological-type dependence was seen (Aaronson & Mould 1983).
             One might ask, what about two galaxies with the same rotational velocity/linewidth
             (ΔV ) and significantly different bulges? Semi-analytic models show a TF morphological-
             type dependence (C. Tonini et al., in prep.), which can be removed by plotting a new
             dynamical parameter combining velocity dispersion and ΔV . The reason for the weakness
             of the TF morphological-type dependence is the strong correlation of galaxy mass with
             bulge velocity dispersion (Catinella et al. 2012).

                                                                            262

Downloaded from https://www.cambridge.org/core. IP address: 46.4.80.155, on 17 Mar 2021 at 22:35:11, subject to the Cambridge Core terms of use, available at
https://www.cambridge.org/core/terms. https://doi.org/10.1017/S1743921312021527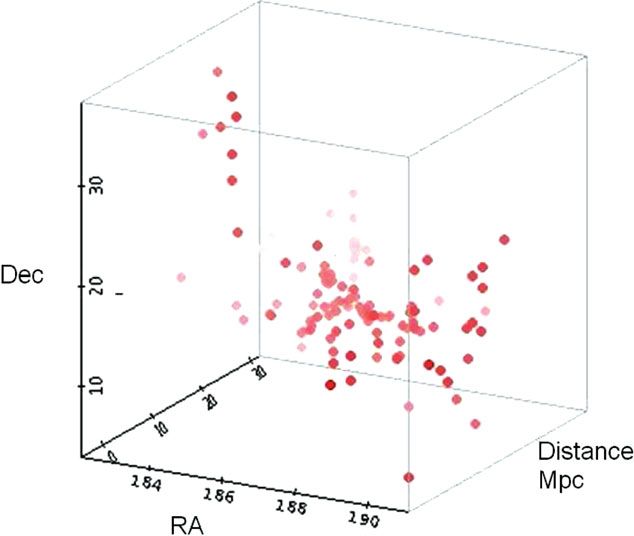
The Virgo Cluster                                                          263

                           Figure 1. Structure of the Virgo cluster based on the NED 1D database.

                      Table 1. Virgo cluster distance modulus from various methods (Tammann 1999).
                                  Method                          (m − M )V irg o            Hubble type
                                  Cepheids                          31.52±0.21               Spiral
                                  SNe Ia                            31.39±0.17               Elliptical, Spiral
                                  Tully–Fisher                      31.58±0.24               Spiral
                                  Globular clusters                 31.67±0.15               Elliptical
                                  Dn –σ                             31.85±0.19               S0, Spiral
                                  Novae                             31.46±0.40               Elliptical
                                  Mean:                            31.60±0.08                (≡ 20.9 ± 0.8 Mpc)

             3. Secondary distance indicators in Virgo
               In the ACS Virgo cluster survey, Mei et al. (2007) provide Hubble Space Telescope
             (HST)/ACS imaging of 100 early-type galaxies and derive distances to 84 based on
             application of the SBF technique. Five galaxies have distances d ≈ 23 Mpc and are
             members of the W Cloud. For the remaining 79 galaxies, the mean distance is 16.5 ± 0.1
             (random) ±1.1 (systematic) Mpc. The rms distance scatter is 0.6 ± 0.1 Mpc. The back-
             to-front depth of the cluster is 2.4 ± 0.4 Mpc. The M87 (Cluster A) and M49 (Cluster B)
             subclusters lie at 16.7 ± 0.2 and 16.4 ± 0.2 Mpc, respectively. Virgo’s early-type galaxies
             appear to define a slightly triaxial distribution, with axis ratios of (1:0.7:0.5).
               Following this, we have the Next Generation Virgo Survey (NGVS; Ferrarese et al.
             2012). They anticipate distance errors of 0.13 mag from the NGVS data, corresponding
             to ±1 Mpc. It is possible to study how galaxy properties correlate with the true local
             environment determined from 3D positions. They expect distances for more than 200
             galaxies, allowing spatial segregation by galaxy type.
               The M87 distance from an HST colour–magnitude diagram is provided by Bird et al.
             (2010). A deep (V, I) imaging dataset of M87 with HST’s ACS camera resolved its bright-
             est red-giant stars. As a byproduct, they obtained a preliminary measurement of the
             distance to M87 with the tip of the red giant branch (TRGB) method; the result was
             (m − M )0 = 31.12 ± 0.14 mag (d = 16.7 ± 0.9 Mpc).

Downloaded from https://www.cambridge.org/core. IP address: 46.4.80.155, on 17 Mar 2021 at 22:35:11, subject to the Cambridge Core terms of use, available at
https://www.cambridge.org/core/terms. https://doi.org/10.1017/S1743921312021527
264 J. Mould
Figure 2. Density field (coloured) in the Supergalactic Plane and the velocity field within 150
Mpc based on 2mrs (Erdoğdu et al. 2006). We are at the centre (origin). The largest structure
shown is the Shapley Supercluster.
For TRGB and Cepheids, Mould & Sakai (2008, 2009a,b) find that when the TRGB is
used as a standard candle, the value of the Hubble constant is the same as when Cepheid
stars are used. This finding is in agreement with Tammann (this volume). This confirms
the findings of the HST Key Project on the Extragalactic Distance Scale, although that
finding is in disagreement with Tammann’s.
The globular cluster luminosity function (GCLF) is not reviewed elsewhere in this
Symposium. Villegas et al. (2010) studied the GCLF turnover magnitude, μz , for all
galaxies in the ACS Virgo and Fornax cluster surveys. They found μz = (23.51 ± 0.11) +
(0.04 ± 0.01)Mz ,gal , plus an offset of δ(m − M ) = 0.20 ± 0.04 mag for the galaxies in
Fornax.
We can also ask if secondary distance indicators continue to be necessary if Cepheids
can be found and measured in the Coma cluster.†
4. Replacing Virgo with the ensemble of local supercluster distances
Fig. 2 shows the velocity field that allows Local Supercluster distances to be used as
an ensemble to supplement the Virgo cluster distance in the traditional distance-scale
ladder. A similar velocity field has been calculated by Lavaux & Tully (2010), also from
† Samantha Hoffmann will present these in her PhD thesis talk at the 2013 winter American
Astronomical Society meeting.
Downloaded from https://www.cambridge.org/core. IP address: 46.4.80.155, on 17 Mar 2021 at 22:35:11, subject to the Cambridge Core terms of use, available at
https://www.cambridge.org/core/terms. https://doi.org/10.1017/S1743921312021527The Virgo Cluster 265
the 2mrs survey. The corresponding distance catalog is compiled from the following
sources:
• HST Cepheids;
• EDD (Tully);†
• sdss Fundamental Plane (George);‡
• Feldman, Watkins, & Hudson (2010) catalog;
• Nearby supernovae Type Ia (SNe Ia) distances;
• SBF distances (Tonry 2001);
• SFI++ (Springob et al.2007);
• NED database;
One can, however, ask, does mass follow light? Reconstructions are based on the as-
sumption that it does, but chinks in that argument exist in the separation of dark and
luminous matter in the Bullet Cluster and in evidence for bulk flows not predicted by
2mrs (Magoulas 2012).
One may also ask about the uncertainties in this velocity field. One answer is consis-
tency with the Lavaux et al. (2010) velocity field which is also based on 2mrs. Com-
parisons between Erdoğdu et al. (2006) and Lavaux et al. (2010) show a lot of scatter.
Another answer is to recompute Erdoğdu’s velocities by adding Monte Carlo-style per-
turbations to it. A third answer is to adopt some heuristic errors scaled to the density
of the region of any particular galaxy of interest. For example, in cluster density regions
(e.g. Virgo)—where there tend to be few spirals anyway—the uncertainty is as large as
the cluster velocity dispersion, because the region is virialized. Indeed, in such regions
one is best off using the cluster distance for all galaxies within a projected Mpc or so.
Then there are very low-density regions, where computed velocities should be near perfect
(modulo the uncertainty in biasing). And there are intermediate-density regions where
the uncertainty would be somewhere in between. Future improvements to the velocity
field will come from
• more distances: e.g. wallaby/SkyMapper¶ and wnshs/PanSTARRS
• deeper redshift surveys: e.g. taipan (UK Schmidt telescope),†† the ongoing 2mrs
(Huchra et al. 2012), and possibly future work at Apache Point Observatory.
• better velocity calculations beyond the linear approximation and employing higher
resolution.
5. Myths
A long-standing furphy‡‡ is that there is no such thing as the Hubble constant. Density
variations make the expansion rate a function of position H(θ, φ, z). A recent misunder-
standing is that the traditional distance ladder has been replaced by fitting cosmic mi-
crowave background (CMB) anisotropies and what they evolve into. The sound horizon
is the new standard ruler. A third fundamentalist (or extreme empiricist) view is that
H0 from CMB anisotropies is model-dependent and not strictly relevant to measuring
the Hubble constant. To these misconceptions, we respond, discard the myths. Embrace
the orthodoxy: the standard model of cosmology.
In this view of the distance scale, which is widely shared, H0 is the first parameter
in a model of an evolving expansion rate. In real experiments, there is a covariance
† http://edd.ifa.hawaii.edu/
‡ http://physics.uq.edu.au/ap/cosmicflow/?page id=14
¶ http://db.ipmu.jp/seminar/sysimg/seminar/666.pdf
http://www.astron.nl/˜jozsa/wnshs/
†† http://physics.uq.edu.au/ap/cosmicflow/?page id=14
‡‡ Australian slang for a rumour, or an erroneous or improbable story
Downloaded from https://www.cambridge.org/core. IP address: 46.4.80.155, on 17 Mar 2021 at 22:35:11, subject to the Cambridge Core terms of use, available at
https://www.cambridge.org/core/terms. https://doi.org/10.1017/S1743921312021527266 J. Mould
Figure 3. Redshift–distance relation for a steady-state Universe with ΩM = 0.27. This is a
curvature-dominated Friedmann equation. Data points: supernovae and gamma-ray bursts. For
comparison, the standard model of cosmology with dark energy and zero curvature is shown as
a dashed line.
between H0 and other parameters. There are a number of observational constraints on
this parameter. They include, but are not confined to, measurements at z > 0. Variations
of density from the mean can be mapped and corrections to a global expansion rate made
to local measurements.
A suitable conclusion to a digression on myths is the steady-state Universe. Its fit to
supernova data is shown in Fig. 3. To plot the model, I have set Ω3 = 0 in the polyno-
mial Friedmann equation of Mould (2011) and Ω0 = ΩM . This corresponds to a constant
matter density which does not decrease as (1 + z)3 . The result is a curvature-dominated
Universe. In resurrecting the steady-state Universe, one discards conservation of mass.
In accepting the standard model of cosmology, one accepts a 70-order-of-magnitude dis-
crepancy between predicted and observed vacuum energy (Martin 2012). However, even
if one were to make a choice between these two evils, it is clear from Fig. 3 that the
steady-state Universe does not even fit the data for z < 1, let alone the CMB.
6. New motivations for an accurate distance scale
The Wilkinson Microwave Anisotropy Probe model has six free parameters, one of
which is the number of relativistic species in the earlier thermal history of the Universe.
Steigman (2012) summarizes the evidence that there are four ‘neutrinos.’ Other evidence
is presented by Suyu et al. (2012) and Freedman et al. (2012). If these results are to
be raised to the mandatory (Higgs) 5σ significance, the Hubble constant will need to
Downloaded from https://www.cambridge.org/core. IP address: 46.4.80.155, on 17 Mar 2021 at 22:35:11, subject to the Cambridge Core terms of use, available at
https://www.cambridge.org/core/terms. https://doi.org/10.1017/S1743921312021527The Virgo Cluster 267
be measured to 1%. Allan Sandage, to whom this symposium is dedicated, famously
described cosmology as the search for two numbers (Sandage 1961). So, he did not sub-
scribe to any of the myths listed in the previous section. Now, there are six numbers. It
is a safe prediction that there will be more parameters required to compose a theory of
physical cosmology and also that they will steadily become better determined through
observations.
7. Summary
The Virgo cluster once had an iconic status in the extragalactic distance-scale ladder.
In its place, we now have an ensemble of local supercluster distances, connected by a
velocity field based on redshift-survey reconstructions. The ladder is now just one of
a number of experiments aimed at measuring H0 , which is one of six parameters in
the current standard model of cosmology. Other experiments are the CMB and baryon
acoustic oscillations (BAO). The ladder itself may be bifurcating into the Cepheid–SN Ia
ladder and a megamaser–BAO ladder. The former may be the luminosity-distance scale.
The latter is an angular-diameter-distance scale. Parameters in the standard model have
covariance (degeneracies). This leads to new reasons to constrain H0 to 1% (e.g. #
neutrinos).
Acknowledgements
I would like to thank Roger Blandford for hosting a workshop at the Kavli Institute
(KIPAC) at Stanford in February 2012, where a number of these ideas were developed.
I would also like to recall John Huchra’s contributions to the distance scale up to his
untimely death in 2010. The study of the dark Universe is supported by the Australian
Research Council (ARC) through CAASTRO.† The Centre for All-sky Astrophysics is
an ARC Centre of Excellence, funded by grant CE11001020
References
Aaronson, M. & Mould, J. 1983, ApJ, 265, 1
Bird, S., Harris, W., Blakeslee, J., & Flynn, C. 2010, A&A, 524, 71
Binggeli, B., Sandage, A., & Tammann, G. 1985, AJ, 90, 1681
Bohringer, H., Briel, U., Schwarz, R., Voges, W., Hartner, G., & Trumper, J. 1994, Nature, 368,
828
Catinella, B., Kauffmann, G., Schiminovich, D., et al. 2012, MNRAS, 420, 1959
Erdoğdu, P., Lahav, O., Huchra, J. P., et al. 2006, MNRAS, 373, 45
Feldman, H., Watkins, R., & Hudson, M. 2010, MNRAS, 407, 2328
Ferrarese, L., Côté, P., Cuillandre, J.-C., et al. 2012, ApJS, 200, 4
Freedman, W. L., Madore, B. F., Scowcroft, V., Burns, C., Monson, A., Persson, S. E., Seibert,
M., & Rigby, J. 2012, ApJ, 758, 24
Huchra, J. P., Macri, L. M., Masters, K. L., et al. 2012, ApJS, 199, 26
Lavaux, G., Tully, R. B., Mohayaee, R., & Colombi, S. 2010, ApJ, 709, 483
Magoulas, C. 2012, Ph.D. thesis, University of Melbourne, Australia
Martin, J. 2012, in: Comptes Rendus de l’Academie des Sciences, in press (arXiv:1205.3365)
Mei, S., Blakeslee, J. P., Côté, P., et al. 2007, ApJ, 655, 144
Mould, J. 2011, PASP, 123, 1030
Mould, J., Aaronson, M., & Huchra, J. 1980, ApJ, 238, 458
Mould, J. & Sakai, S. 2008, ApJ, 686, L75
Mould, J. & Sakai, S. 2009a, ApJ, 694, 1331
† www.caastro.org
Downloaded from https://www.cambridge.org/core. IP address: 46.4.80.155, on 17 Mar 2021 at 22:35:11, subject to the Cambridge Core terms of use, available at
https://www.cambridge.org/core/terms. https://doi.org/10.1017/S1743921312021527268 J. Mould
Mould, J. & Sakai, S. 2009b, ApJ, 697, 996
Sandage, A. 1961, ApJ, 133, 355
Springob, C. M., Masters, K. L., Haynes, M. P., Giovanelli, R., & Marinoni, C. 2007, ApJS, 172,
599
Steigman, G. 2012, in: Neutrino Physics, Advances in High Energy Physics, in press
(arXiv:1208.0032)
Suyu, S., Treu, T., Blandford, R. D., et al. 2012, in: KIPAC workshop on the Hubble constant
(arXiv:1202.4459)
Tammann, G. 1999, IAU Symp., 183, 31
Tonry, J. L., Dressler, A., Blakeslee, J. P., Ajhar, E. A., Fletcher, A. B., Luppino, G. A., Metzger,
M. R., & Moore, C. B. 2001, ApJ, 546, 681
Villegas, D., Jordán, A., Peng, E. W., et al. 2010, ApJ, 717, 603
Discussion
Michael Feast: Your F350LP observations are going to have problems with calibration
and extinction.
Jeremy Mould: We’ll work on these in the next six months and also work on photo-
metric simulation. Observations at V and I have also been made.
Giuseppe Bono: Your Coma magnitudes seem to differ from what I would expect.
Jeremy Mould: Our preliminary Virgo–Coma modulus within the current uncertainties
is consistent with the ratio of Coma’s redshift and Virgo’s flow-corrected redshift. When
we have taken the steps I just alluded to, the uncertainty in NGC 4921’s distance will
drop to perhaps 5% (I’m guessing) and then we’ll see.
Downloaded from https://www.cambridge.org/core. IP address: 46.4.80.155, on 17 Mar 2021 at 22:35:11, subject to the Cambridge Core terms of use, available at
https://www.cambridge.org/core/terms. https://doi.org/10.1017/S1743921312021527You can also read