Impacts of Saharan Dust intrusions on Bacterial communities of the Low troposphere - Nature
←
→
Page content transcription
If your browser does not render page correctly, please read the page content below
www.nature.com/scientificreports

            OPEN           Impacts of Saharan Dust Intrusions
                           on Bacterial Communities of the
                           Low Troposphere
                           Elena González-Toril1, Susana Osuna1, Daniel Viúdez-Moreiras1, Ivan Navarro-Cid1,
                           Silvia Díaz del Toro2, Suthyvann Sor3, Rafael Bardera3, Fernando Puente-Sánchez4,
                           Graciela de Diego-Castilla1 & Ángeles Aguilera1 ✉
                           We have analyzed the bacterial community of a large Saharan dust event in the Iberian Peninsula
                           and, for the first time, we offer new insights regarding the bacterial distribution at different altitudes
                           of the lower troposphere and the replacement of the microbial airborne structure as the dust event
                           receeds. Samples from different open-air altitudes (surface, 100 m and 3 km), were obtained onboard
                           the National Institute for Aerospace Technology (INTA) C-212 aircrafts. Samples were collected during
                           dust and dust-free air masses as well two weeks after the dust event. Samples related in height or
                           time scale seems to show more similar community composition patterns compared with unrelated
                           samples. The most abundant bacterial species during the dust event, grouped in three different
                           phyla: (a) Proteobacteria: Rhizobiales, Sphingomonadales, Rhodobacterales, (b) Actinobacteria:
                           Geodermatophilaceae; (c) Firmicutes: Bacillaceae. Most of these taxa are well known for being
                           extremely stress-resistant. After the dust intrusion, Rhizobium was the most abundant genus,
                           (40–90% total sequences). Samples taken during the flights carried out 15 days after the dust event
                           were much more similar to the dust event samples compared with the remaining samples. In this
                           case, Brevundimonas, and Methylobacterium as well as Cupriavidus and Mesorizobium were the most
                           abundant genera.

                           Airborne microbes are ubiquitous in the atmosphere1 and are thought to play important roles in meteorological
                           processes (i.e. clouds and snow formation or precipitation patterns alterations)2,3, as well as in the long-range
                           dispersal of plant and livestock pathogens4,5 and in the maintenance of the diversity in aquatic systems6. Likewise,
                           airborne bacteria can have important effects on human health, producing allergic asthma and seasonal allergies,
                           and could interfere in the productivity of managed and natural ecosystems7. Global abundance of aerial micro-
                           organisms has been estimated, based on data from terrestrial environments, to range between 104 to 106 m−3 8.
                           However, more recent studies, incorporating direct counting by microscopy or quantitative PCR9, have yielded,
                           more accurate, higher estimates of the abundance of airborne microbes and seasonal patterns10. Additionally,
                           the atmosphere is one of the most extreme environments and microorganisms inhabiting in the troposphere
                           are exposed to higher UV radiation, desiccation, cold temperatures and nutrient deprivation than in other
                           environments11,12.
                               Several studies have also demonstrated the potential for microorganisms to be transported over long distances
                           through the atmosphere, associated to desert dust, as a route for the colonization of new habitats13,14. Thus, desert
                           dust clouds may serve not only as a source of nutrients for terrestrial plants and primary producers in nutrient
                           depleted oceanic waters15,16, but may also serve as a vehicle for global transport of microorganisms, including
                           pathogens13,17.
                               The Sahara-Sahel regions of North Africa are the dominant sources of aerosolized soil dust in the North
                           Hemisphere atmosphere (50 to 75% of the current estimate), contributing as much as one billion metric tons
                           of dust per year to the atmosphere13,18. Large dust storm events that originate from North Africa are capable of
                           continent-wide, transoceanic, and global dispersion13,17 and frequently affect air quality in Africa, the Middle

                           1
                            Centro de Astrobiología (CSIC-INTA). Carretera de Ajalvir Km 4, Torrejón de Ardoz, 28850, Madrid, Spain.
                           2
                            Department of Genetics, Physiology and Microbiology. Biology Faculty. C/José Antonio Novais, 12, Universidad
                           Complutense de Madrid (UCM), 28040, Madrid, Spain. 3Aerodinamic Department (INTA). Carretera de Ajalvir Km 4,
                           Torrejón de Ardoz, 28850, Madrid, Spain. 4Systems Biology Program. Centro Nacional de Biotecnología. C/ Darwin
                           n° 3, Campus de Cantoblanco, 28049, Madrid, Spain. ✉e-mail: aguileraba@cab.inta-csic.es

Scientific Reports |   (2020) 10:6837 | https://doi.org/10.1038/s41598-020-63797-9                                                            1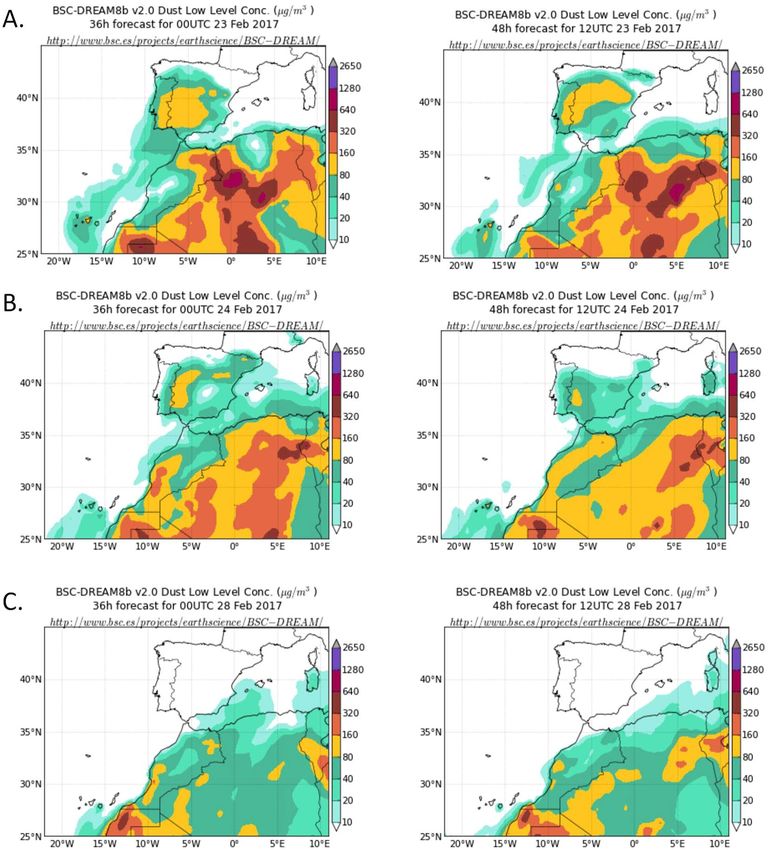
www.nature.com/scientificreports/                                                               www.nature.com/scientificreports

                           Figure 1. Schematic diagram of the atmospheric bioaerosol sampling device used in the C-212 airplane, as well
                           as the approximated trajectories of the four flights carried out.

                           East, Europe, Asia, the Caribbean, and the Americas15,16,18–21. However, the southern Mediterranean is the most
                           influenced areas by atmospheric intrusions of Saharan dust18,22. This intrusions account for ~50% of global dust
                           production23. It has been estimated that 80–120 tn of dust per year are carried across the Mediterranean towards
                           Europe, with dust clouds recorded to reaching an altitude of up to 8 km the Mediterranean basin24–26.
                               Despite the importance of the aerial microbial dispersion phenomena, studies dealing with the microbial
                           ecology associated to African dust are very limited, being almost nonexistent in southern European areas. African
                           dust-associated microbes has been explored after transatlantic long-distance transport17,21,27–29, after dust dep-
                           osition in snow (Dolomite Alps)30, in high mountain lakes (Pyrenees)6, over the Turkish Mediterranean coast-
                           line31,32, Greece33, Corsica and Sardinia (Italy)34 and in the southern Iberian Peninsula35. These studies conclude
                           that, although there is higher diversity in the airborne microbial composition during dust events, the amounts
                           and the specific microbes associated remain topics of debate.
                               Furthermore, most studies to date on the atmospheric microbiome are restricted to samples collected near
                           the Earth’s surface (e.g., top of mountains (ca. 2 km) or buildings). The tropospheric microbial ecology at high
                           altitudes and in open air masses, where long-range atmospheric transport is more efficient, remains poorly char-
                           acterized. This fact is mostly due to difficulties associated with obtaining enough biomass for analysis, not to
                           mention the difficulty to access to aerial platforms (i.e. aircrafts) to sampling the air from the microbiological
                           point of view. In this regard, to our knowledge, there are only four references regarding microbial ecology in
                           the troposphere by using aircrafts, one related to tropical storms36, another to the airborne bacteria in the lower
                           stratosphere31 and two reporting changes in the microbial atmospheric composition during Asian dust events in
                           Japan32,37. Increasing our knowledge of this field will also contribute to improved models of microbial dispersal
                           and microbial biogeography36.
                               In order to reduce these knowledge deficiencies, we obtained several open air high-altitude samples (up to
                           ∼3 km) by using aircrafts during a severe Saharan dust intrusion in the Iberian Peninsula in the winter of 2017.
                           Due to the advances in culture-independent techniques such as massive Illumina sequencing technologies, we
                           were able to study the changes in the airborne bacterial community during and after this dust event at different
                           altitudes. Airborne bacterial diversity was estimated based on their 16S rRNA gene sequences on both, Saharan
                           dust days and non-Saharan dust days. Our results provide new insights into the species composition, relative
                           abundance and dynamics of the bacterial and dynamics of the bacterial communities of the lower troposphere
                           and, for the first time, the tropospheric influences of an African dust event.

                           Materials and methods
                           Sampling locations and collection. Samples were obtained onboard the National Institute of Aerospace
                           Technology (INTA) C-212 aircraft platform. Air outside of the airplane was collected using the onboard sampler.
                           The inlet was inserted into the air intake, which opens at the leading edge of the airplane, to avoid boundary
                           effects. Bioaerosols were collected on glass fiber filter PM10 (X100, EPM2000, 47 mm in diameter, Whatman) by
                           filtering air from outside the aircraft using a vacuum pump (Fig. 1). Glass fiber filters were previously sterilized in

Scientific Reports |   (2020) 10:6837 | https://doi.org/10.1038/s41598-020-63797-9                                                              2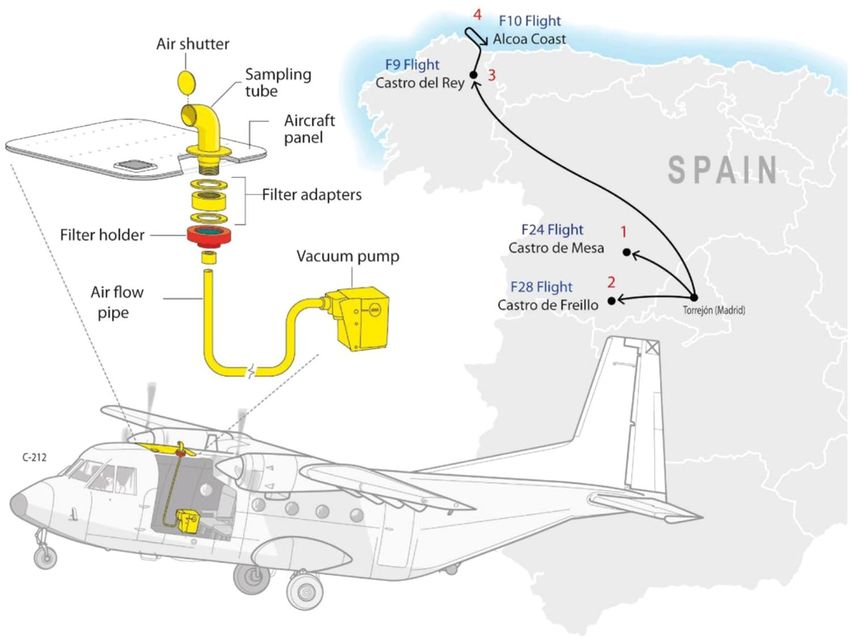
www.nature.com/scientificreports/                                                                www.nature.com/scientificreports

                            Date         Sample*    Local time (h) Sampling area       LAT (deg) LONG (deg) Altitude (m) Meteorology
                            23/02/2017   SU-23F     11:30         Avila (NW Spain)     40.52     −4.38        1.5          High Dust
                            24/02/2017   SU-24F     11:00         Avila (NW Spain)     40.52     −4.38        1.5          High Dust
                            24/02/2017   F24-HT     11:0          Avila (NW Spain)     40.52     −4.38        2740**       High Dust
                            24/02/2017   F24-LT     12:00         Avila (NW Spain)     40.72     −4.94        100          High Dust
                            28/02/2017   SU-28F     11:00         Avila (NW Spain)     40.30     −4.60        1.5          After rain
                            28/02/2017   F28-HT     11:00         Avila (NW Spain)     40.33     −4.60        2740**       After rain
                            28/02/2017   F28-LT     13:00         Avila (NW Spain)     40.72     −4.94        120          After rain
                            09/03/2017   SU-9M      13:00         Lugo (NW Spain)      42.85     −6.52        1.5          Pristine
                            09/03/2017   F9-HT      13:00         Lugo (NW Spain)      42.85     −6.52        3040**       Pristine
                            09/03/2017   F9-LT      14:00         Lugo (NW Spain)      43.10     −7.47        160          Pristine
                            10/03/2017   F10-HT     11:00         Lugo (NW Spain)      43.57     −7.28        3040**       Pristine
                            10/03/2017   F10-LT     12:00         Lugo (NW Spain)      43.57     −7.28        100          Pristine

                           Table 1. Averaged sampling data. *Sample: (SU) Surface; (F) Flight; (HT) High Troposphere flight; (LT) Low
                           Troposphere flight. **Altitude over the sea level.

                           a dry oven (400 °C, 4 hours) in order to remove all possible DNA contaminates. Before every sampling flight, the
                           filter adapters, the filter holder and the air shutter were submerged in isopropyl alcohol for, at least 4 hr in order to
                           be sterilized. After that, it was dried in a laminar flow hood with the UV connected. At the same time, surface air
                           samples were collected using the same sampling device, in the same approximate area in which the airplane was
                           sampling and during the same time (60 min). A subsample of ca. 1cm2 of each filter was cut with a sterile scalpel
                           and stored at 4 °C until electronic microscopy observation were carried out. Remaining filters were kept at −20 °C
                           until DNA extraction.
                                To account for possible contamination associated with sample processing, appropriate negative controls were
                           added: (i) a blank control for detecting molecular kit contaminates38,39 (ii) a blank glass fiber filter PM10 (X100,
                           EPM2000, 47 mm in diameter, Whatman) previously sterilized in a dry oven (400 °C, 4 hours) (iii) swabs in 5 ml
                           tubes wetted with PBS (Phosphate Buffered Saline, pH 7.4) for detecting contaminates on the inlet surface previ-
                           ously rinsed with isopropyl alcohol. These negative controls were treated exactly the same as all samples through
                           the entire experiments process, including amplification, sequencing and OTU detection.
                                The occurrence of atmospheric Saharan dust and its drift were confirmed by LIDAR (Light Detection and
                           Ranging) data from the NOAA and Saharan dust intrusion from Spanish Meteorological Agency (AEMET, www.
                           aemet.es). The geographic origin of African dust was determined by back-trajectory analysis (http://ready.arl.noaa.
                           gov/HYSPLIT.php). The flights covered a total period of about 4 weeks (February 23, 2017–March 10, 2017). Air
                           samples were collected from 23 and 24 February 2017 (dust severe conditions), 28 February 2017 (3 days after the
                           end of the dust intrusion and after a heavy rain), and 9–10 March 2017 (15 days after the end of the dust event)
                           (Table 1). The airplane took off from Torrejón Military Aerial Base (Madrid) and started collection of samples in
                           the air of Avila (80 km NW Madrid), and Lugo (400 km NW Madrid). Samples from ∼100 m and ∼3,000 m were
                           taken during the four flights, in addition to the surface samples mentioned previously (Table 1, Fig. 2). During each
                           flight, biomass from atmospheric air was collected over a period of 1 h on average per sample. In total, over 15,000 l
                           were filtered and thus, the samples were presumably representative of the air masses sampled. During sampling, we
                           recorded the time, altitude, longitude and latitude, visibility, aircraft heading and course, airspeed and ground speed.

                           Scanning electron microscopy (SEM) and energy dispersive x-ray spectroscopy (EDS).
                           Subsamples of each filter were examined in a Jeol 5600LV scanning electron microscope (SEM) equipped with a
                           backscattered electron (BSE) detector and an INCA Oxford X-ray energy dispersive spectroscopy (EDS) microa-
                           nalytical system. The size, morphology, and chemical composition of individual particles (ca.15–20 particles per
                           sample) as well as areas of ca. 400 μm2 of each sample was evaluated. Conditions were set to 15 kV accelerating
                           voltage and 100 s of effective counting time. Matrix corrections were made following the standard procedures
                           using a combination of silicate, oxides, and pure metals (wollastonite for Ca and Si, jadeite for Na, orthoclase for
                           K, corundum for Al, periclase for Mg, metallic Fe and Ti for Fe and Ti).

                           Model for back-trajectory simulations. The back-trajectories of air masses were computed using the
                           HYbrid Single-Particle Lagrangian Integrated Trajectory (HYSPLIT) model40, accessed via web-based Real-time
                           Environmental Applications and Display sYstem (READY) and developed by the National Oceanic and
                           Atmospheric Administration (NOAA) Air Resources Laboratory41. Thus, the Global Data Assimilation System
                           (GDAS) was input to the HYSPLIT model in order to compute 3-days back-trajectories for air masses, taking into
                           account each sampling location and time (Suplementary Table S1). Trajectories were computed during a time
                           period t-∆t, where t is a particular sampling time and ∆t is selected to be equal to 36 h, in time intervals of 6 h, in
                           order to get insights at possible changes in the atmospheric patterns (e.g. winds) just previous to the sampling
                           time, which could imply more than one predominant air mass trajectory influencing the concentrations within
                           a particular parcel sampled. Altitudes around the sampling altitude were also derived for sensitivity analysis,
                           showing similar results. In addition, the concentration of Saharan dust in the atmosphere, particularly during the
                           Saharan dust intrusion, was obtained by means of HYSPLIT in its dispersion model approach, accessed by the
                           Barcelona Supercomputing Center.

Scientific Reports |   (2020) 10:6837 | https://doi.org/10.1038/s41598-020-63797-9                                                                3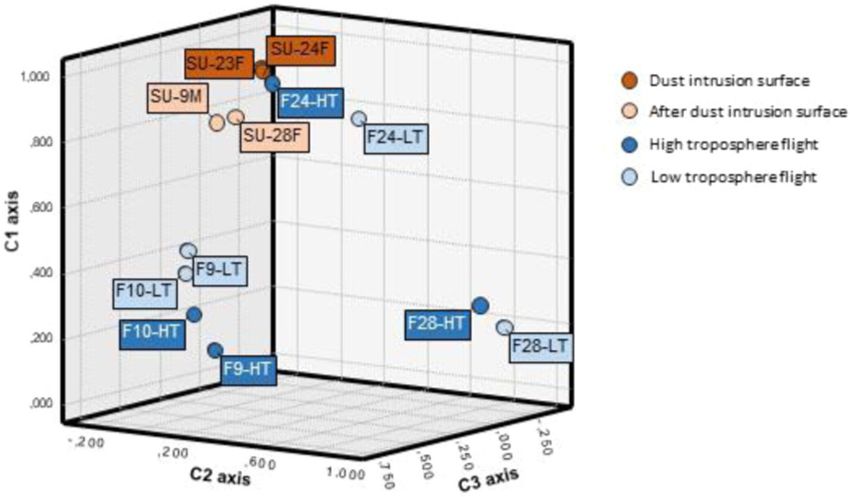
www.nature.com/scientificreports/                                                             www.nature.com/scientificreports

                           Figure 2. Flight profiles and sampling information (altitude, sampling time, locations).

                           DNA extraction, amplicons preparation and Illumina sequencing. Filters were cut into small pieces
                           with a sterile scalpel, and introduced into a Lysing Matrix Tube from FastDNA SPIN Kit for Soil (MP Biomedicals,
                           LLC). To disrupt cells, three 30-s pulses of the FastPrep-2 5 G Instrument (MP Biomedicals, LLC) at speed 4.0
                           were performed. Genomic DNA extraction and elution was done according to the manufacturer’s instructions
                           and purified DNAs were quantified by Quant-iT Pico-Green dsDNA Assay Kit (Invitrogen).
                               DNA extracted was used in a first PCR of 27 cycles with Q5 Hot Start High-Fidelity DNA Polymerase (New
                           England Biolabs) in the presence of 100 nM primers for 16 S amplification, V3V4-CS1 (S-D-Bact-0341-b-S-17)
                           (5′ACACTGACGACATGGTTCTACACCTACGGGNG GCWGCAG-3′) and V3V4-CS2 (S-D-Bact-
                           0785-a-A-21) (5′-TACGGTAGCAGAGACTTG G T CTGACTACHVGGGTATCTAATCC-3′), these primers
                           amplify the V3-V4 region of 16 S42. Each sample was amplified and, after the first PCR, a second PCR of 14
                           cycles was performed with Q5 Hot Start High-Fidelity DNA Polymerase (New England Biolabs) in the presence
                           of 400 nM of primers (5′ AATGATACGGCGACCACCGAGATCTACACTGACGACATGGTT C TACA-3′ and
                           5′-CAAGCAGAAGACGGCATACGAG AT-[barcode]-TACGGTAGCAGAGAC TTGGT CT-3′) of the Access
                           Array Barcode Library for Illumina Sequencers (Fluidigm). The finally obtained amplicons were validated and
                           quantified by an Agilent 2100 Bioanalyzer using DNA7500 chips, and an equimolecular pool of these amplicons
                           was purified by agarose gel electrophoresis to eliminate primers/dimers. This purified pool was titrated by quanti-
                           tative PCR using the “Kapa-SYBR FAST qPCR kit forLightCycler480” and a reference standard for quantification.
                           Finally, the pool of amplicons was denatured prior to be seeded on a flowcell at a density of 10pM, where clusters
                           were formed and sequenced using a “MiSeq Reagent Kit v3”, in a 2 × 300 pair-end sequencing run on a MiSeq
                           sequencer.

                           OTU detection and classification.         Sequence processing and analyses procedures were carried out using
                           Mothur v.1.38.143. Sequences were pre-processed by strictly following the standard operating procedure (MiSeq
                           SOP)44. Pre-processed sequences, aligned and normalized, were used to generate an uncorrected pairwise dis-
                           tance matrix, which was then used to cluster the sequences using the furthest neighbor algorithm and to detect
                           OTUs at 0.03 distance level. OTUs detected at a genetic distance of 0.03 were classified by comparing a repre-
                           sentative sequence from each cluster against the Silva (v123) reference database45, using BLAST to identify sim-
                           ilar sequences46 and the k-Nearest Neighbor algorithm to determine the consensus taxonomy from the 10 most
                           similar sequences in the database. Sequences were classified according to the RDP6 taxonomy scheme47. Chao 1
                           estimator, Shannon and Simpson indices were calculated to predict community richness using PAST software48.
                           The sequences reads in the negative controls were compared with the sequences read in the samples by BLAST.
                           All sample sequences that showed a similarity ≥98% with the control sequences were eliminated prior taxonomic
                           OTU assignment.

Scientific Reports |   (2020) 10:6837 | https://doi.org/10.1038/s41598-020-63797-9                                                          4
www.nature.com/scientificreports/ www.nature.com/scientificreports
Statistical analysis. Principal Component Analyses (PCA) on the relative proportion of OTUs (at a 0.03
distance) among the samples were obtained. Using the three components as new variables, hierarchical dendro-
grams by Euclidean squared distance method were also calculated (IBM SPSS Statistics 23 package)49. Shannon
and Simpson diversity indices and number of OTUs (at 0.03 distance) as well as Chao1 index were used as biolog-
ical dataset (CANODRAW 4.0 software was used for graphical presentation).
Results and Discussion
Significant intensification of Sahara dust intrusions has been noticed during the last few decades50. These intru-
sions, and the subsequent dust deposition, are relevant for nutrient dispersal and soil development51,52, as well as
for the introduction and dispersal of external microorganisms, including pathogens, into ecosystems and popu-
lations17,30,53. Despite the relevance of these phenomena, there are few studies analyzing variations on the atmos-
pheric microbial diversity as a result of Sahara dust intrusions in Southern Europe34,35,54,55. Here, we analyzed the
microbial load of one of the largest winter-occurring Saharan dust events in the Iberian Peninsula and, for the first
time, we offer new insights into bacterial distribution at different altitudes of the lower troposphere, as well as the
replacement of the native microbial airborne structure as the dust event disappears.
Samples collected and microscopic analysis. The sampling campaign operated three continental flights
within the Iberian Peninsula (flights from Madrid to Avila and Lugo (NW Spain)) and one flight off the coast in
the north (Fig. 1) during which samples were taken. Macroscopic differences among the filters in terms of dust/
particles recovery were clearly distinguished, showing lower coloration as the altitude increases (Suplementary
Fig. S1). SEM analysis showed that the samples collected during the dust event were a collection of loose grains
to which small particles adhered (Suplementary Fig. S2). Under these in situ conditions, it was difficult to distin-
guish microbes from clay particles, diatom fragments and other adhering material. As expected, samples from the
other flights showed lower amounts of dust particles. Nevertheless, obvious cellular structures were visible in all
samples analyzed. The most frequent images clearly shows rounded individual cells-like particles of ca. 6–10 μm,
as well as cells forming clusters of variable shapes and sizes. Cells and clusters are always covered by an irregular
coat of extracellular polymeric substances (EPSs). Fragments of diatom shells could be also seen.
Dust particles showed irregular morphology and great size variability (www.nature.com/scientificreports/ www.nature.com/scientificreports
Figure 3. Dust concentration (μg/m3) predicted by model BSC-DREAM8b v2.0 for (A) 23 February 2017 at 00
UTC (left) and 12 UTC (right). (B) 24 February 2017 at 00 UTC (left) and 12 UTC (right). (C) 28 February 2017
at 00 UTC (left) and 12 UTC (right). On March 9th and 10th, dust concentration data for the Iberian Peninsula
was very similar to that of February 28th (data not shown), predicted by model BSC-DREAM8b v2.0, Barcelona
Supercomputing Center.
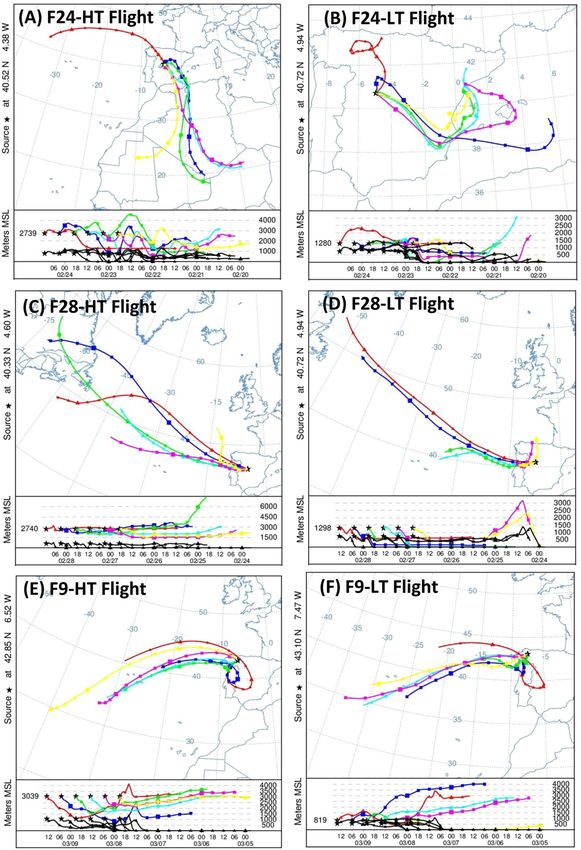
the large amount of Saharan dust present at this time (Fig. 4B) which was previously transported by air masses at
higher altitudes33.
The situation was completely different in the case of F28-HT (Fig. 4C). During this flight, samples were
obtained at ~3,000 m, as in F24-HT but, as previously described, dust intrusion had finalized. Wind pattern above
the Iberian Peninsula changed to predominant north-northwesterly winds, and precipitation favored dust set-
tling on the Iberian Peninsula. Thus, back-trajectories computed via HYSPLIT showed predominant westerly air
masses originating (72-hours) from the free troposphere above the Atlantic Ocean. A similar pattern was roughly
observed in F28-LT (Fig. 4D), where the air masses also interacted with the Iberian Peninsula and marine PBL’s.
F9-HT back-trajectories showed predominant air masses originating from the Atlantic Ocean (72 h), after
strong recirculation above the northwest side of the Iberian Peninsula (Fig. 4E), in addition to a direct interaction
with lower atmospheric layers, including the PBL in some cases, due to the vertical movement of the air masses.
This recirculation was also observed in F9-LT, although to a lesser extent, taking into account the transport of the
air masses through the PBL (Fig. 4F). Back-trajectories for F10-LT and F10-HT are not shown here because they
were similar to those presented for F9-LT and F9-HT, respectively. The summary of back-trajectory results as well
as the predominant source for every sample is shown in Suplementary Table S1.
Scientific Reports | (2020) 10:6837 | https://doi.org/10.1038/s41598-020-63797-9 6www.nature.com/scientificreports/ www.nature.com/scientificreports
Figure 4. Three-days back-trajectories computed by HYSPLIT for the different sampling area flights. Air mass
trajectories within the 48h-interval previous to the sampling time. (A) F24-HT flight (3,000 m altitude); (B)
F24-LT flight (100 m altitude); (C) F28-HT flight (3,000 m altitude); (D) F28-LT flight (100 m altitude); (E)
F9-HT flight (3,000 m altitude); (F) F9-LT flight (100 m altitude). F10 flights presented similar trajectories than
F9 flights.
Sequencing analysis and estimated richness. The collections of amplicons were sequenced, and the
number of reads is summarized in Supplementary Table S2. After total DNA extraction from each of the collected
samples, 16 S rDNA PCR amplification and DNA sequencing, a total of ∼1.5 ×10⁶ sequences were obtained
across all samples, about 120,000 per sample on average. The analysis of the read length distributions indicated a
modal distribution between 442 and 444 nt. After quality control checks, chimera sequence removal and controls
Scientific Reports | (2020) 10:6837 | https://doi.org/10.1038/s41598-020-63797-9 7www.nature.com/scientificreports/ www.nature.com/scientificreports
Figure 5. Relative abundance and Phylum-class level distribution of bacterial OTUs for each sampling. Only
groups with relative abundances >1% are shown. Classification and histogram were performed by Mothur
package.
sequences subtraction, a total of ∼140,000 sequences remained, about 11,000 per sample on average. Chloroplast
sequences were detected (and removed) in all samples, with their proportion varying between 0.47 and 5.2%. The
number of OTUs detected at a distance of 0.03, was between 30 to 375 per sample, with a total of 1,708 of bacterial
OTUs observed. Nevertheless, Chao1estimations suggest that we were able to identify from 72 to 96% of the total
OTU population. In general, samples taken during the flights showed lower number of OTUs than the surface
samples (∼50% less).
Samples were collected at different altitudes (Surface, 100 m and 3,000 m) during three different atmospheric
scenarios, a severe winter Saharan dust intrusion (23–24 February), a dust free environment after intense rains
(28 February) and two weeks after the dust event (9–10 March). It is interesting to note that during dust event
days, samples from the surface and flights showed a higher richness in bacterial population (Chao1) than the
samples from non-dust event days. Conversely, although Shannon H diversity index showed higher values in
the surface samples, similar values were found between dust-event days and non-dust samples. However, the
Shannon H index was generally higher in surface samples than in the flight ones (∼47% less), except during
the dust-event, in which no differences were found between surface and flight samples. Besides, sample F28-LT
showed the lowest diversity (Shannon H index 0.5). Although similar studies of airborne bacterial diversity
across different altitudes during a dust intrusion are currently nonexistent, our results are comparable to the
diversity patterns observed in other studies dealing with desert dust events. Thus, samples collected during the
dust intrusion showed a higher diversity (Chao1 and Shannon H index, Supplementary Table S2) than non-dust
related samples, which is in agreement with other previous studies4,13,30,34,35,60. Additionally, rarefaction analysis
(Suplementary Fig. S4) revealed that tropospheric communities are less complex compared to many habitats on
Earth such as soils or waters61.
Diversity of bacteria. Sequences were affiliated with 27 bacterial phyla and/or classes, among which
Alphaproteobacteria (∼60%), Actinobacteria (∼10%), Firmicutes (∼10%) and Bacteroidetes (∼7%) were domi-
nant, representing ∼90% of the total microbial community (Fig. 5, Suplementary Table S3). Approximately 7% of
representative sequences could not be classified. Only six phyla were detected exclusively in the samples collected
during the dust-event days, Armatimonadetes, Candidate division WPS- 1 and 2, Nitrospirae, Parcubacteria and
Synergistetes, although each of them accounted for less than 1% of the sequences. In order to reveal any underly-
ing trends in the composition of the different bacterial populations, hierarchical dendrogram at the phylum/class
level (Suplementary Fig. S5) was generated via the Euclidean squared distance method. All the samples associ-
ated with dust intrusion (SU-23F, SU-24F, F24-HT and F24-LT) clustered together, and very near to the surface
samples collected during the non-dust event (SU-28F and SU-9M). Additionally, samples from flights after the
rain episode (F28-HT and F28-LT) grouped together, showing also the highest amounts of Alphaproteobaterias in
F28-LT samples (∼90% of the total sequences) and Chloroflexi in F28-HT (∼9% of the total sequences). On the
other hand, low troposphere flight samples from non-dust event day (F9-LT, F9-HT) as well as samples taken dur-
ing the off-shore flights (F10-LT and F10-HT) showed a completely different microbial composition and clustered
together. Samples from flight F9-LT revealed the highest amounts of Fusobacteria (96% of the total Fusobacteria
related sequences) and Cloacimonetes were detected only in samples from off-shore flights (F10-LT and F10-HT).
These samples also produced the highest percentages of Spirochaetes and Saccharibacteria (94% and 75% of the
total respective phylum sequences).
In turn, SSU rRNA gene sequences Principal Component Analysis (PCA) at 0.03 distance (Fig. 6), as well as
the associated hierarchical clustering (Suplementary Fig. S6) was performed, explaining 71% of the total vari-
ance with three components. The PCA analysis revealed three major clusters among the samples, revealing that
Scientific Reports | (2020) 10:6837 | https://doi.org/10.1038/s41598-020-63797-9 8www.nature.com/scientificreports/ www.nature.com/scientificreports
Figure 6. Principal Component Analyses (PCA) on the relative proportion of OTUs (at a 0.03 distance).
samples related in height or collection time seem to show more similar community composition patterns when
compared to unrelated samples. The first cluster grouped all the surface samples (SU-23F, SU-24F, SU-28F and
SU-9M) plus the samples from the first flight collected during the dust-event (F24-LT and F24-HT). This results
reflected the influence of the dust intrusion in the microbial composition of the low troposphere, suggesting that
desert dust intrusions aerosolize a large number of new cells and taxa, dramatically affecting the composition of
the low tropospheric microbial communities, at least up to the 3,000 m sampled. Back trajectory analysis (22–23
Feb) showed that air mases coming from North Africa (and microbial cells transported with them) experienced
a strong vertical mixing with different atmospheric layers, including the Saharan Planetary boundary layer (PBL)
in origin, and were brought aloft during the dust intrusion event. This could explain the similarity among the
samples taken at different altitudes during the intrusion.
Interestingly, surface samples from days after the dust intrusion event (SU-28F and SU-9M) are also included
in this cluster (although forming a subcluster), showing a clear similarity with the microbial community dur-
ing the dust intrusion (Fig. 6). This result suggest that, changes in the local atmospheric microbial composition
near the surface caused by the dust intrusions may remain for several days after the major event has passed60.
This desert influence in the atmosphere could extend even to several weeks in the presence of thermal inversion
phenomena, which are frequently associated with hot air desert intrusions in the Iberian Peninsula during the
winter62.
The Saharan origin of these microbial communities is revealed by the high conformity of principal bacterial
genera described for Saharan desert with those present in these samples63. Thus, the most abundant bacterial spe-
cies in all samples taken during the dust event (∼30–40% of the total sequences in these samples) (Suplementary
Table S3), gruped in three different phyla, previously reported during desert dust events35,60,63–65: (a)
Proteobacteria-Rhizobiales (Rhizobium and Microvirga), Sphingomonadales, Rhodobacterales (Rubellimicrobium),
(b) Actinobacteria- Geodermatophilaceae; (c) Firmicutes- Bacillaceae,. Most of these species are well known for
being extremely stress-resistant, including, high temperatures, such as Rubellimicrobium63, high radiation and
desiccation, specially Geodermatophilus64,65, or spore formation such as Bacillus, which increase the probability
of survival during transportation66.
Additionally, other highly stress-resistant bacteria groups were also detected, although in low amounts, repre-
senting always less than 1% of the total sequences in each sample. Thus, species related to, (a) high temperature:
Pseudonocardia, Streptomyces, Thermomonosporaceae, Nitrospira and Porphyrobacter; (b) radiation: Deinococcus,
Hymenobacter, Methylobacterium and Rubrobacter; (c) desiccation: Kineococcus and Methylobacterium; (d) psy-
chrotolerance: Planococcus, Subtercola and Modestobacter; and (e) halophyly: Salinarimonas and Nocardioides,
were also detected in all the samples related to the dust event (SU-23F, SU-24F, F24-LT, F24-HT) as well as in the
surface samples taken after it (SU-28F, SU-9M).
The second cluster observed in the PCA analysis (Fig. 6 and Suplementary Fig. S6) grouped the samples
obtained during the second flight, after the rain event (F28-LH and F28-HT), pointing out a completely different
situation. After the rain, the atmospheric microbial community from samples collected during the flights changed
completely, with samples being clearly related by time scale rather than altitude. Thus, samples from flights after
the rain period (F28-LT and F28-HT) clustered together and separately from the samples taken during the flights
two weeks after the dust event (F9-LT, F9-HT, F10-LT and F10-HT). These results reflected the completely differ-
ent atmospheric situation once the dust intrusion was over. Winds pattern above the Iberian Peninsula changed
to predominant north-northwesterly winds, and the precipitations favored dust deposition. Our results are in
agreement with previous studies in which it has been hypothesized that an important variable affecting the dif-
ferences in atmospheric bacterial composition may be due to variability in the predominant winds at any given
time64,65. In these samples, Rhizobium is the main represented genera (∼40–90% of the total sequences in these
samples). Rhizobium is a sporulating Gram-negative soil bacteria that form endosymbiotic nitrogen-fixing asso-
ciations with plant roots such as legumes67. Consistent analysis from previous studies reported that, in continental
Scientific Reports | (2020) 10:6837 | https://doi.org/10.1038/s41598-020-63797-9 9www.nature.com/scientificreports/ www.nature.com/scientificreports
and temperate regions, plants are one of the main sources of atmospheric bacteria. This is suggested by the large
quantity of plant associated bacteria, such as Sphingomonadales and Rhizobiales, and the high number of chloro-
plast sequences retrieved in the samples collected (data not shown). Besides, a previous study demonstrated that
soil-inhabiting bacteria, such as Actinobacteriales, Firmicutes and Rhizobiales, prevailed in the atmosphere during
cold seasons68. In our case, it is tentative to suggest that the abundance of Rhizobiales in the atmosphere could be
a result of the land area surrounding the flight samplings, which are mainly used for agricultural purposes, where
seasonal plowing and cultivation processes may contribute to the atmospheric bacterial sources69. Rhizobiales
were also found in the dust event related samples, but represented less than the 5% of the total sequences found.
PCA analysis also revealed that the microbial communities in the samples taken during the flights that took
place 15 days after the dust event (F9-HT, F9-LT, F10-HT and F10-LT) were much more similar among them
when compared to the other samples collected. In this case, Brevundimonas, and Methylobacterium as well as
Cupriavidus and Mesorizobium were the most abundant genera respectively (∼20–50% of the total sequences in
these samples) (Fig. 6 and Suplementary Fig. S6). Brevundimonas species are ubiquitous in the environment and
is one of few bacteria showing high survival rates under radiation simulating Martian conditions, while some
species of Cupriavidus are known by their high resistance to oxidative stress70,71.
Our results showed that, despite the similitudes in the bacterial diversity between our atmospheric samples
and the previously reported ones, there are a number of important and stark differences. For example, we did
not find any sequence related to Afipia sp., one of the main constituents of the troposphere community (>40%
of total community) reported by DeLeon-Rodriguez et al. (2013), as well as some of the most abundant families
recently described by Smith et al. (2018) in the lower stratosphere (such as Staphylococcaceae, Moraxellaceae,
Lachnospiraceae and Ruminococcaceae), although we found a similar number of OTUS. Furthermore, one of
the main components found in our samples related to Saharan intrusion, Microvirga sp., has not been reported
previously in the consulted literature. Additionally, contrary to previous studies, we did not find what has been
described as a “core microbiome”36 since there are no bacterial species common to all the samples analyzed, not
even within the flight samples.
On the other hand, Triado-Margarit et al. (2019) reported that the bacterial composition of bioaerosols col-
lected by passive natural deposition at high-elevated mountains were closer to the bacterial microbiome from the
free troposphere. Our results showed also comparable patterns, since samples from the same flights at low and
high troposphere were similar in terms of bacterial diversity. Besides, our analysis showed a different bacterial
community structure in samples collected over the open ocean, during desert dust events or after a rain period,
as described in the mentioned study72. Interestingly, these authors stated that only Oxalobacteraceae were nota-
bly more abundant in wet deposition, with Noviherbaspirillum and Massilia as dominant genera72. In our case,
although these genera have been found in most of the samples, they account for less than 1% of the total commu-
nity in all cases. These examples support the idea of a highly dynamic and diverse atmospheric microbiome that
deserve considerably more attention due to the different bioaerosol origins, the assortment of known emission
sources and the potential for long range atmospheric dispersal31.
Potential health threats. After long-range transport, the diversity of bacteria associated with dust events
may play a significant role in human, plant and animal health, although it is not clear what are the limits on the
overall transport of pathogens around the planet. We have found that most of the potential pathohogenic-relevant
bacteria are mainly found in the dust event related samples, in both surface and flight samples. Although HtS
methods did not permit assigning species, several environmental genera that contain opportunistic patho-
gens25,27,73, were identified including Legionella, Neisseria, Staphylococcus, Chlamydia, Acinetobacter, Arthrobacter,
Gordonia, Kocuria, Brevibacterium, Rasltonia, Pantoea, Pseudomonas, Mycobacterium and Bacillus.
Special attention should be paid to the samples taken during the flights carried out on 9 March, in which
approximately 50% of the sequences corresponded to the genus Brevundimonas, a Gram-negative bacterium
recently described as an emerging global opportunistic pathogen in nosocomial infections72. Furthermore,
sequences related to Brucella (associated to brucellosis) and Haemophilus (associated to bacterial flu) genera
were also found in significant amounts in these flight samples. Although no reports of human infectious diseases
related to long-distance dispersal of pathogens associated to dust events exists to date, aside from increasing inci-
dences of asthma, the World Health Organization has reported dust storm events in the sub-Sahara region as one
of the main origins for local occurrences of meningococcal meningitis (Neisseria meningitidis), causing around
50,000 deaths every year73. Thus, enhanced desertification will introduce more dust into the atmosphere, increas-
ing the importance of monitoring microbial communities in intercontinental winds. This is especially relevant in
terms of the aerial dispersal of plant pathogens, due to the limited genetic diversity of the majority of the modern
crops that make them highly susceptible to new pathogens17,20.
Overall, we observed that samples related in height or time scale showed more similar community composi-
tion patterns compared with unrelated samples. Additionally, the dust intrusion had a profound influence in the
microbial composition of free trophosphere areas with little influence of ground surface contamination, such as
areas located up to 3,000 m. In this study, Sahara desert storms were able to aerosolize a large number of cells and
species that have been distributed along the entire air column, strongly resembled the bioaerosols collected near
the ground even 15 days after the dust event. There is still a lack of knowledge about the atmospheric microbial
community, its spatial and temporal distribution, how they can adapt to this environment and wheter they are
able to actively metabolize organic and inorganic compounds and proliferate in order to consider the atmosphere
as an ecosystem in its own right rather than as a conduit for life. It is also important to understand how atmos-
pheric phenomena (i.e. dust storms, hurricanes, etc…) suspend and transport microbial communities globally.
For this reason, there is a need for improvement and implementation of suitable sampling systems and the devel-
opment of manned and unmanned aerial systems capable of sampling large volumes of air for subsequent analy-
ses, as it would provide a wide range of applications in atmospheric, environmental and health sciences.
Scientific Reports | (2020) 10:6837 | https://doi.org/10.1038/s41598-020-63797-9 10www.nature.com/scientificreports/ www.nature.com/scientificreports
Received: 10 October 2019; Accepted: 31 March 2020;
Published: xx xx xxxx
References
1. Smets, W., Moretti, S., Denys, S. & Lebeer, S. Airborne bacteria in the atmosphere: presence, purpose, and potential. Atmos. Environ.
139, 214–221 (2016).
2. Fröhlich-Nowoisky, J. et al. Bioaerosols in the Earth system: Climate, health, and ecosystem interactions. Atmos. Res. 182, 346–376
(2016).
3. Morris, C. E. et al. Bioprecipitation: A feedback cycle linking Earth history, ecosystem dynamics and land use through biological ice
nucleators in the atmosphere. Glob. Chang. Biol. 20, 341–351 (2014).
4. Polymenakou, P. N., Mandalakis, M., Stephanou, E. G. & Tselepides, A. Particle size distribution of airborne microorganisms and
pathogens during an intense African dust event in the Eastern Mediterranean. Environ. Health Perspect. 116, 292–296 (2008).
5. Pillai, S. D. & Ricke, S. C. Bioaerosols from municipal and animal wastes: background and contemporary issues. Can. J. Microbiol.
48, 681–696 (2002).
6. Hervàs, A., Camarero, L., Reche, I. & Casamayor, E. O. Viability and potential for immigration of airborne bacteria from Africa that
reach high mountain lakes in Europe. Environ. Microbiol. 11, 1612–1623 (2009).
7. Moorman, J. E. et al. Current asthma prevalence in United States, 2006-2008. MMWR Surveill Summ 60, 84–86 (2011).
8. Lighthart, B. Mini-review of the concentration variations found in the alfresco atmospheric bacterial populations. Aerobiologia 16,
7–16 (2000).
9. Gonzalez-Martin, C., Teigell-Perez, N., Lyles, M., Valladares, B. & Griffin, D. W. Epifluorescent direct counts of bacteria and viruses
from topsoil of various desert dust storm regions. Res. Microbiol. 164, 17–21 (2013).
10. Cáliz, J., Triadó-Margarit, X., Camarero, L. & Casamayor, E. O. A long-term survey unveils strong seasonal patterns in the airborne
microbiome coupled to general and regional atmospheric circulations. Proc. Natl. Acad. Sci. 115, 12229–12234 (2018).
11. Smith, D. J. Microbes in the upper atmosphere and unique opportunities for astrobiology research. Astrobiology 13, 981–990 (2013).
12. Smith, D. J., Griffin, D. W. & Schuerger, A. C. Stratospheric microbiology at 20 km over the Pacific Ocean. Aerobiologia 26, 35–46
(2010).
13. Griffin, D. W. Atmospheric movement of microorganisms in clouds of desert dust and implications for human health. Clin.
Microbiol. Rev. 20, 459–477 (2007).
14. Reche, I., D’Orta, G., Mladenov, N., Winget, D. M. & Suttle, C. A. Deposition rates of viruses and bacteria above the atmospheric
boundary layer. ISME J. 12, 1154–1162 (2018).
15. Okin, G. S., Mahowald, N., Chadwick, O. A. & Artaxo, P. Impact of desert dust on the biogeochemistry of phosphorus in terrestrial
ecosystems. Global Biogeochem. Cycles 18 (2004).
16. Duarte, C. M. et al. Aerosol inputs enhance new production in the subtropical northeast Atlantic. J. Geophys. Res. Biogeosciences 111
(2006).
17. Kellogg, C. A. & Griffin, D. W. Aerobiology and the global transport of desert dust. Trends Ecol. Evol. 21, 638–644 (2006).
18. Moulin, C., Lambert, C. E., Dulac, F. & Dayan, U. Control of atmospheric export of dust from North Africa by the North Atlantic
oscillation. Nature 387, 691 (1997).
19. Shinn, E. A. et al. African dust and the demise of Caribbean coral reefs. Geophys. Res. Lett. 27, 3029–3032 (2000).
20. Brown, J. K. M. & Hovmøller, M. S. Aerial dispersal of pathogens on the global and continental scales and its impact on plant disease.
Science 297, 537–541 (2002).
21. Prospero, J. M., Blades, E., Mathison, G. & Naidu, R. Interhemispheric transport of viable fungi and bacteria from Africa to the
Caribbean with soil dust. Aerobiologia 21, 1–19 (2005).
22. Foltz, G. R. & McPhaden, M. J. Impact of Saharan dust on tropical North Atlantic. J. Clim. 21, 5048–5060 (2008).
23. Bangert, M. et al. Saharan dust event impacts on cloud formation and radiation over Western Europe. Atmos. Chem. Phys. 12,
4045–4063 (2012).
24. d’Almeida, G. A. A Model for Saharan dust transport. J. Clim. Appl. Meteorol. 25, 903–916 (1986).
25. Dulac, F. et al. Quantitative remote sensing of African dust transport to the Mediterranean in The impact of desert dust across the
Mediterranean (eds. Guerzoni, S. & Chester, R.) 25–49 (Springer Netherlands, 1996).
26. Alpert, P., Kishcha, P., Shtivelman, A., Krichak, S. & Joseph, J. Vertical distribution of Saharan dust based on 2.5-year model
predictions. Atmos. Res. 70, 109–130 (2004).
27. Griffin, D. W., Garrison, V. H., Herman, J. R. & Shinn, E. A. African desert dust in the Caribbean atmosphere: Microbiology and
public health. Aerobiologia 17, 203–213 (2001).
28. Weir-Brush, J. R., Garrison, V. H., Smith, G. W. & Shinn, E. A. The relationship between Gorgonian coral (Cnidaria: Gorgonacea)
diseases and African dust storms. Aerobiologia 20, 119–126 (2004).
29. Griffin, D. W., Gonzalez-Martin, C., Hoose, C. & Smith, D. J. Global scale atmospheric dispersion of microorganisms in
Microbiology of Aerosols (eds. Delort, A. & Amato, P.) 155–194 (John Wiley & Sons, Inc., 2017).
30. Weil, T. et al. Legal immigrants: invasion of alien microbial communities during winter occurring desert dust storms. Microbiome 5,
32 (2017).
31. Smith, D. J. et al. Airborne bacteria in Earth’s lower stratosphere resemble taxa detected in the Troposphere: results from a new
NASA aircraft bioaerosol collector (ABC). Front. Microbiol. 9, 1752 (2018).
32. Yamaguchi, N., Ichijo, T., Sakotani, A., Baba, T. & Nasu, M. Global dispersion of bacterial cells on Asian dust. Sci. Rep. 2, 525 (2012).
33. Kaskaoutis, D. G., Nastos, P. T., Kosmopoulos, P. G. & Kambezidis, H. D. Characterising the long-range transport mechanisms of
different aerosol types over Athens, Greece during 2000–2005. Int. J. Climatol. 32, 1249–1270 (2012).
34. Rosselli, R. et al. Microbial immigration across the Mediterranean via airborne dust. Sci. Rep. 5, 16306 (2015).
35. Sánchez de la Campa, A., García-Salamanca, A., Solano, J., de la Rosa, J. & Ramos, J. L. Chemical and microbiological
characterization of atmospheric particulate matter during an intense African dust event in Southern Spain. Environ. Sci. Technol. 47,
3630–3638 (2013).
36. DeLeon-Rodriguez, N. et al. Microbiome of the upper troposphere: Species composition and prevalence, effects of tropical storms,
and atmospheric implications. Proc. Natl. Acad. Sci. 110, 2575–2580 (2013).
37. Kobayashi, F. et al. Bioprocess of Kosa bioaerosols: Effect of ultraviolet radiation on airborne bacteria within Kosa (Asian dust). J.
Biosci. Bioeng. 119, 570–579 (2015).
38. Salter, S. J. et al. Reagent and laboratory contamination can critically impact sequence-based microbiome analyses. BMC Biol. 12, 87
(2014).
39. Minich, J. J. et al. KatharoSeq enables High-Throughput microbiome analysis from low-biomass samples. mSystems 3, e00218–17
(2018).
40. Stein, A. F. et al. NOAA’s HYSPLIT atmospheric transport and dispersion modeling system. Bull. Am. Meteorol. Soc. 96, 2059–2077
(2015).
41. Rolph, G., Stein, A. & Stunder, B. Real-time environmental applications and display system: READY. Environ. Model. Softw. 95,
210–228 (2017).
Scientific Reports | (2020) 10:6837 | https://doi.org/10.1038/s41598-020-63797-9 11www.nature.com/scientificreports/ www.nature.com/scientificreports
42. Klindworth, A. et al. Evaluation of general 16S ribosomal RNA gene PCR primers for classical and next‐generation sequencing‐
based diversity studies. Nucleic Acids Res 41(1), e1 (2013).
43. Schloss, P. D. et al. Introducing mothur: open-Source, platform-independent, community-supported software for describing and
comparing microbial communities. Appl. Environ. Microbiol. 75, 7537–7541 (2009).
44. Kozich, J. J., Westcott, S. L., Baxter, N. T., Highlander, S. K. & Schloss, P. D. Development of a dual-Index sequencing strategy and
curation pipeline for analyzing amplicon sequence data on the MiSeq Illumina sequencing platform. Appl. Environ. Microbiol. 79,
5112–5120 (2013).
45. Pruesse, E. et al. SILVA: a comprehensive online resource for quality checked and aligned ribosomal RNA sequence data compatible
with ARB. Nucleic Acids Res. 35, 7188–7196 (2007).
46. Altschul, S. F., Gish, W., Miller, W., Myers, E. W. & Lipman, D. J. Basic local alignment search tool. J. Mol. Biol. 215, 403–410 (1990).
47. Cole, J. R. et al. The Ribosomal Database Project: improved alignments and new tools for rRNA analysis. Nucleic Acids Res. 37,
141–145 (2008).
48. Hammer, O., Harper, D. A. T. & Ryan, P. D. Palaeontological statistics software package for education and data analysis. Palaeontol.
Electron. 4, (2001).
49. Braak, C. J. F. & Šmilauer, P. CANOCO reference manual and CanoDraw for Windows user’s guide. Softw. canonical community
ordination (version 4.5). Microcomput. Power, Ithaca, NY 500 (2002).
50. Goudie, A. S. Dust storms: recent developments. J. Environ. Manage. 90, 89–94 (2009).
51. Swap, R., Garstang, M., Greco, S., Talbot, R. & Kallberg, P. Saharan dust in the Amazon Basin. Tellus B 44, 133–149 (1992).
52. Gallisai, R., Peters, F., Volpe, G., Basart, S. & Baldasano, J. M. Saharan dust deposition may affect phytoplankton growth in the
Mediterranean Sea at ecological time scales. PLoS One 9, e110762 (2014).
53. Barberán, A., Henley, J., Fierer, N. & Casamayor, E. O. Structure, inter-annual recurrence, and global-scale connectivity of airborne
microbial communities. Sci. Total Environ. 487, 187–195 (2014).
54. Griffin, D. W. et al. Airborne desert dust and aeromicrobiology over the Turkish Mediterranean coastline. Atmos. Environ. 41,
4050–4062 (2007).
55. Gat, D., Mazar, Y., Cytryn, E. & Rudich, Y. Origin dependent variations in the atmospheric microbiome community in Eastern
Mediterranean dust storms. Environ. Sci. Technol. 51, 6709–6718 (2017).
56. Moreno, T. et al. Geochemical variations in aeolian mineral particles from the Sahara–Sahel dust corridor. Chemosphere 65, 261–270
(2006).
57. Alastuey, A. et al. Characterisation of TSP and PM2.5 at Izaña and Sta. Cruz de Tenerife (Canary Islands, Spain) during a Saharan
Dust Episode (July 2002). Atmos. Environ. 39, 4715–4728 (2005).
58. Rodríguez, S. et al. Transport of desert dust mixed with North African industrial pollutants in the subtropical Saharan Air Layer.
Atmos. Chem. Phys. 11, 6663–6685 (2011).
59. Kallos, G., Astitha, M., Katsafados, P. & Spyrou, C. Long-Range transport of anthropogenically and naturally produced particulate
matter in the Mediterranean and North Atlantic: current state of knowledge. J. Appl. Meteorol. Climatol. 46, 1230–1251 (2007).
60. An, S., Sin, H. H. & DuBow, M. S. Modification of atmospheric sand-associated bacterial communities during Asian sandstorms in
China and South Korea. Heredity (Edinb). 114, 460–467 (2014).
61. Delmont, T. O., Simonet, P. & Vogel, T. M. Describing microbial communities and performing global comparisons in the ‘omic era.
Isme J. 6, 1625 (2012).
62. Queroll Carceller, X., Urós, A. A. & Fernández, S. C. Impacto de las emisiones desérticas de polvo africano sobre la calidad del aire
en españa. Macla Rev. la Soc. Española Mineral. 8, 22–27 (2008).
63. Favet, J. et al. Microbial hitchhikers on intercontinental dust: catching a lift in Chad. Isme J. 7, 850–867 (2012).
64. Cao, C. et al. Inhalable microorganisms in Beijing’s PM2.5 and PM10 pollutants during a severe smog event. Environ. Sci. Technol.
48, 1499–1507 (2014).
65. Rainey, F. A. et al. Extensive diversity of ionizing-radiation-resistant bacteria recovered from Sonoran Desert soil and description of
nine new species of the genus Deinococcus obtained from a single soil sample. Appl. Environ. Microbiol. 71, 5225–5235 (2005).
66. Nicholson, W. L., Munakata, N., Horneck, G., Melosh, H. J. & Setlow, P. Resistance of Bacillus endospores to extreme terrestrial and
extraterrestrial environments. Microbiol. Mol. Biol. Rev. 64, 548–572 (2000).
67. Sawada, H., Kuykendall, L. D. & Young, J. M. Changing concepts in the systematics of bacterial nitrogen-fixing legume symbionts.
J. Gen. Appl. Microbiol. 49, 155–179 (2003).
68. Gandolfi, I., Bertolini, V., Ambrosini, R., Bestetti, G. & Franzetti, A. Unravelling the bacterial diversity in the atmosphere. Appl.
Microbiol. Biotechnol. 97, 4727–4736 (2013).
69. Bowers, R. M. et al. Seasonal variability in bacterial and fungal diversity of the near-surface atmosphere. Environ. Sci. Technol. 47,
12097–12106 (2013).
70. Nies, D. H. Microbial heavy-metal resistance. Appl. Microbiol. Biotechnol. 51, 730–750 (1999).
71. Dartnell, L. R., Hunter, S. J., Lovell, K. V., Coates, A. J. & Ward, J. M. Low-Temperature ionizing radiation resistance of Deinococcus
radiodurans and Antarctic Dry Valley bacteria. Astrobiology 10, 717–732 (2010).
72. Triadó-Margarit, X., Caliz, J., Reche, I. & Casamayor, E. O. High similarity in bacterial bioaerosol compositions between the free
troposphere and atmospheric depositions collected at high-elevation mountains. Atmospheric Environment. 203, 79–86 (2019).
73. Griffin, D. W., Kellogg, C. A. & Shinn, E. A. Dust in the wind: long range transport of dust in the atmosphere and its implications for
global public and ecosystem health. Glob. Chang. Hum. Heal. 2, 20–33 (2001).
Acknowledgements
C212 airborne access was generously provided by INTA, coordinated by the Aerial Platforms for Research team
and with the logistical and operational support of 47 Group of the Spanish Air Force. We gratefully acknowledge
the NOAA Air Resources Laboratory (ARL) for the provision of the HYSPLIT transport and dispersion model
and/or READY website (http://www.ready.noaa.gov), in addition to the SPAIN HYSPLIT website (http://
www.ciecem.uhu.es/hysplit), used in this publication. This work was funded by the Spanish Economy and
Competitiveness Ministry (MINECO) grants CGL2015-69758-P, CGL2017-92086-EXP, ESP2016-79612-C3-1-R,
RTI2018-094867-BI00 and i-LINK 1151 grant founded by the Council for Scientific Research (CSIC). FPS was
supported by the MINECO grant CTM2016-80095-C2-1-R.
Author contributions
E.G.T., S.O. and A.A. conceived and designed the experiments. S.O., S.S. and R.B. designed the field work
campaigns. I.N.C., S.D.T. and G.D.C. performed the experiments. E.G.T., F.P.S. and A.A. analyzed the data and
prepared tables and figures. D.V.M. analyzed metheorological data and trayectory analysis. A.A. cordinated works
and wrote the manuscript. All authors read and provided helpful discussions and approved the final version.
Scientific Reports | (2020) 10:6837 | https://doi.org/10.1038/s41598-020-63797-9 12www.nature.com/scientificreports/ www.nature.com/scientificreports
Competing interests
The authors declare no competing interests.
Additional information
Supplementary information is available for this paper at https://doi.org/10.1038/s41598-020-63797-9.
Correspondence and requests for materials should be addressed to Á.A.
Reprints and permissions information is available at www.nature.com/reprints.
Publisher’s note Springer Nature remains neutral with regard to jurisdictional claims in published maps and
institutional affiliations.
Open Access This article is licensed under a Creative Commons Attribution 4.0 International
License, which permits use, sharing, adaptation, distribution and reproduction in any medium or
format, as long as you give appropriate credit to the original author(s) and the source, provide a link to the Cre-
ative Commons license, and indicate if changes were made. The images or other third party material in this
article are included in the article’s Creative Commons license, unless indicated otherwise in a credit line to the
material. If material is not included in the article’s Creative Commons license and your intended use is not per-
mitted by statutory regulation or exceeds the permitted use, you will need to obtain permission directly from the
copyright holder. To view a copy of this license, visit http://creativecommons.org/licenses/by/4.0/.
© The Author(s) 2020
Scientific Reports | (2020) 10:6837 | https://doi.org/10.1038/s41598-020-63797-9 13You can also read