Understanding In-Flight Icing - Nick Czernkovich
←
→
Page content transcription
If your browser does not render page correctly, please read the page content below
Understanding In-Flight Icing
                                        Nick Czernkovich

                Transport Canada Aviation Safety Seminar – November 17, 2004

Introduction

In recent years there has been growing concern over the issue of aircraft structural icing. It is the
cause of approximately 30 fatalities and 14 injuries, on average, per year as well as US $96 million
annually in personal injuries and damages in the United States alone (Hallet et al, 2002). In 1997 the
Federal Aviation Administration (FAA) released its In-flight Aircraft Icing Plan which contained
explicit recommendations for a comprehensive redefinition of aircraft icing certification envelopes
(Cober and Isaac, 2002). This recommendation stemmed from the October 1994 crash of an ATR-
72 near Roselawn Indiana, which was attributed primarily to severe structural icing. Since 1994
there have been several more serious accidents involving aircraft icing which have further increased
motivation to better our understanding of icing conditions so that they can more accurately be
characterized, detected and predicted.

1995 saw the first Canadian Freezing Drizzle Experiment (CFDE) conducted out of St. John’s
Newfoundland. Subsequent studies in 1996/1997, 1997/1998 and 1999/2000, 2002/2003,
2003/2004 referred to as CFDE II/III and AIRS I/1.5/II, respectively, were conducted out of
Ottawa, Ontario with flights over the Montreal, Quebec region during AIRS. All studies employed
in-situ measurements using research aircraft like the NRC Convair-580, the NASA-Glenn Twin
Otter and the SPEC Lear-25 as well as ground-based remote sensing units such as radar and lidar.
The main objectives of AIRS, the most recent study, in order of priority were the following: 1) to
improve our ability to remotely sense aircraft icing regions using satellite, aircraft or ground-based
systems, 2) to obtain additional data to characterize the icing environment which might be used in a
revision of “FAR-25 Appendix C”, the criteria used to certify aircraft for icing conditions, 3) to
improve our ability to forecast icing conditions and to understand how these conditions develop,
and 4) to obtain measurements of aircraft performance within icing conditions and shapes of
accretion that might be used on verification of icing model codes or in wind tunnel studies to
simulate icing conditions (Isaac et al., 2001). AIRS was the joint effort between many interested
parties who contributed both ground and air based measurement equipment as well as funding for
the program.

Recent studies have shown that pilot awareness and understanding about in-flight icing needs
improvement. Of particular concern are pilots’ understanding of conditions that cause supercooled
liquid water (SLW) to form in the atmosphere, the dynamics of icing and the performance
degradation associated with icing encounters. In this paper we will attempt to examine some of
these aspects of icing. We will begin with the physics of icing, followed by the dynamics of icing
and conclude with flight planning and in-flight strategies. At the end of this paper there are included
references which are highly recommended for anyone intending to fly into icing conditions.

                                                 1/21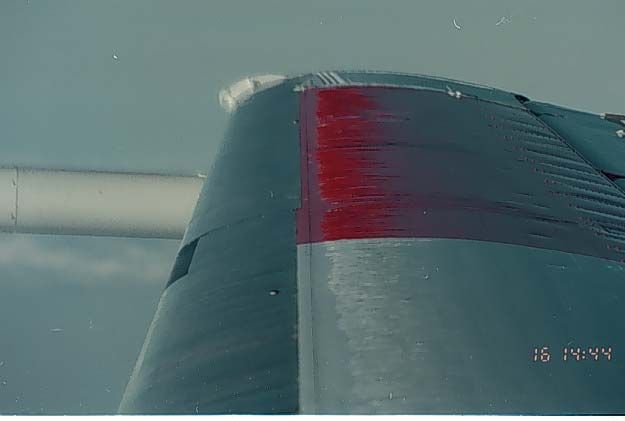
Physics of Icing

Before speculating as to where icing conditions are likely to exist along our intended route of flight,
we must understand the physics of how supercooled liquid water (SLW) is formed in our atmosphere.
To do so, we will begin with the basics of cloud droplet formation and work our way up through the
various scales that are of interest to us in studying icing. Before continuing however, it will be
necessary to go through a bit of the nomenclature that will be used throughout the following
discussion.

Some basic definitions

In general, when someone says the word water most people think of liquid. What is unique about
water however is that it has the ability to exist in our atmosphere, in equilibrium, in all three phases
(solid, liquid and vapour). Transition between phases takes place all the time in our atmosphere and
results in what we refer to as weather. In every transition, energy known as latent heat, is either
absorbed or released by the water molecules in question. Figure 1 shows the various phase
transitions and their associated names.

    •    Condensation is the process by which water changes phase from vapour to liquid. This
         process releases energy to its surroundings because liquid is a lower energy state than vapour.
    •    Evaporation is just the opposite of condensation, wherein a phase change from liquid to
         vapour occurs. This process consumes energy from its surroundings because the system
         moves to a higher energy state.
    •    Freezing is the process by which water changes phase from liquid to solid (ice). This process,
         like condensation, releases energy to the atmosphere because ice is a lower energy state than
         liquid.
    •    Melting is just the opposite of freezing, wherein a phase change from solid to liquid occurs.
         This process consumes energy from its surroundings because it moves to a higher energy
         state.
    •    Sublimation is the term used for the transition between solid and vapour in either direction.
         Transition from vapour to solid is often also called deposition, although both terms are
         correct. In the interest of clarity, we will use sublimation to refer to transitions from solid to
         vapour and deposition to refer to transitions from vapour to solid. Clearly sublimation
         consumes energy from the surroundings and deposition releases energy.

To summarize, the three phases in order of increasing energy state are: solidÆliquidÆvapour. When
changing phase from left to right, energy must be absorbed by the water molecules from the
surroundings. When changing phase from right to left, energy is released by the water molecules to
the surroundings.

It isn’t necessary to memorize Figure 1, but there are two points to note about the phase transitions
of water that are paramount in our understanding of icing physics. Firstly, liquid water and ice can
co-exist in equilibrium at 0 °C. It is the point where phase transition between liquid water and ice
should naturally occur. People will often use the terms melting point and freezing point interchangeably
to refer to this temperature, but as will become clear later in our discussion, ice will always begin to
melt when temperatures are just slightly above 0 °C, but liquid water will not always solidify when

                                                   2/21
temperatures drop below 0 °C. In essence, this is why we must contend with aircraft icing. The
second point is that evaporation, sublimation and deposition need not occur at any specific
temperature. In general, there are temperature regimes in which these processes are often more
likely, but the reasons for this are beyond our discussion in this paper and will not affect our
understanding of aircraft icing.
The formation of clouds and cloud droplets
Clouds are visible moisture in the atmosphere. This moisture can be in the form of liquid water
droplets or ice crystals. They can form through any number of processes, but in all cases the air
must be cooled to saturation for visible moisture to develop. This cooling will generally be the
result of air being lifted and cooled as a result of terrain, fronts, buoyancy, etc. We will discuss this
further shortly, but let’s digress for a moment to clarify our understanding of water vapour in the
atmosphere. Pilot’s are generally taught to look at the temperature-dew point spread to determine
how close to saturation the air is. In other words, the smaller the temperature-dew point spread the
higher the relative humidity. Thus, supposing we lift an air parcel from the surface, with a
temperature of 12 °C and a dew point of 10 °C, we would expect condensation (i.e. cloud
development) to form about 700 ft AGL. Now suppose we take another parcel of air with a
temperature of 20 °C and a dew point of 10 °C and lift it, we would expect to find cloud bases just
above 3000 ft. (These estimations are based on the dry adiabatic lapse rate of 3 °C/1000 ft, which
provides reasonable results for the lowest few thousand feet of the atmosphere). Clearly the first
parcel had a higher relative humidity than the second, but it is also important to note that both
parcels have the same absolute humidity – the actual amount of water vapour stored in the parcel.
Dew point temperature is a measure of water vapour in a parcel (not temperature), and roughly
speaking it is a measure of how much water vapour is available for condensation and cloud
development. As a rule, dew point is
always less than or equal to the
temperature. So temperature puts a
cap on dew point and hence the
amount of water vapour that an air
parcel can hold. There are many
complications to this problem but in
general higher dew points combined
with strong lifting can produce clouds
of relatively higher liquid water
content (LWC).
Consider first the formation of a warm
cloud. We define this as a cloud with
temperatures throughout its depth
entirely above 0 °C. In such a cloud
we expect to find only liquid cloud
droplets. In most cases the cloud
forms as a result of some lifting
mechanism which brings the air to
saturation. This mechanism can be Figure 1 – Phase transitions of water and associated latent heats
frontal lifting, orographic lifting (air
3/21flowing up terrain), buoyancy, convergence, turbulence or any host of other possibilities. As the air
is lifted it expands and cools until it reaches saturation (relative humidity, RH = 100 %). Further
lifting beyond this point, without the production of visible moisture, would result in supersaturation
where RH > 100 %. The level at which saturation occurs is known as the lifting condensation level
(LCL). Up to this point the amount of moisture contained in the air has remained constant.
Beyond this point we observe the nucleation (formation) of cloud droplets through the process of
condensation, and hence the conversion of some of the water vapour into liquid water. Nucleation
comes in two flavours, homogeneous and heterogeneous. Homogeneous nucleation is the direct
transformation from vapour to liquid. For reasons beyond our discussion here, this mechanism is
not observed in the atmosphere. Rather, the latter mechanism prevails in the atmosphere wherein
vapour condenses onto tiny particles called cloud condensation nuclei (CCN). These particles can be
anything from salts, dust, biogenic and anthropogenic materials, etc., but the important point is that
they are always in abundance in the atmosphere. Hence supersaturation in clouds is usually quite
limited because once the LCL is reached, vapour is quickly condensed into cloud droplets. Typical
cloud droplet diameters range in size from about 10 to 20 microns (1 micron is 10-6 metres). Also
worth mentioning is that the time scales on which average cumulus clouds are formed is on the
order of 10 to 20 minutes.
Once the cloud has formed, if the conditions are right, rain may be produced in as little as 10
minutes. Up to this point the cloud droplets grew by condensation of water vapour onto existing
drops. But once they reach about 20 microns in diameter a new process begins to prevail. This
process is known as collision and coalescence. Simply put, cloud droplets can grow rapidly by colliding
with one another and sticking together. As they grow, their fall speeds increase and they scavenge
more droplets on the way down. Eventually, the fall speeds of these droplets exceeds the updraft
speed of the cloud and we get precipitation. Typically, stratus clouds have much smaller updraft
velocities than cumulus clouds (20 to 30 cm/s vs several metres per second), so stratus clouds can
often only support drizzle (100 to 500 microns in diameter) whereas cumulus clouds more often
produce rain (500 to 5000 microns in diameter). This entire process, from start to finish, is referred
to as the warm rain process.
Now let’s consider how ice particles and snow are formed. The situation begins in the same manner
as the warm cloud process except that this time, some or all of the cloud is below 0 °C. Once air is
lifted to the 0 °C isotherm (freezing level) and visible moisture is present, there is a possibility of
forming ice particles. This can occur through the freezing of liquid droplets or by direct deposition
(vapour to ice). Like the warm cloud process, ice particles must also form on some sort of nucleus,
but in this case they are called ice or freezing nuclei (IN/FN). All things being equal, snow and ice
particles would develop as soon as saturated air reached the freezing level, but as we find in the
atmosphere FN are far less abundant than CCN. Thus even though liquid droplets may be lifted
well above the freezing level, they are not guaranteed to freeze unless they come into contact with a
FN. Liquid droplets that exist below 0 °C are referred to as supercooled droplets. To put things into
perspective, at 0 °C only about one FN in every one million CCN is found to exist (pretty poor
odds!). The number concentration of FN has been found to correlate well with temperature, as
shown in Figure 2, and moreover we see that only negligible concentrations of FN exist at
temperatures above –15 °C. This is one reason why observations have shown that in general,
aircraft icing conditions are most hazardous and most common when cloud temperatures are
warmer than about –15 °C (remember though, this is in general, it is not a rule!). It should also be
noted that once ice particles begin to form, they can quickly multiply and deplete the liquid water in
4/21a cloud. This process is known as glaciation.
This is why meteorologists are often
concerned with cloud top temperatures
(CCT). If the CCT is below –15 °C there is a
greater likelihood of ice particles forming near
the top of the cloud and glaciating the cloud
from the top down. However, even this
rationale can break down if the updraft
velocities in the cloud are strong enough.
Zawadzki, et al (2000) showed the conditions
under which liquid water and ice can co-exist
in a cloud. That being said, the main point to
remember is that when temperatures are
between 0 °C and –40 °C there is always the
possibility of SLW existing in cloud, it is just
that the probability of finding SLW begins to
decrease as temperatures drop below –15 °C.
–40 °C is given as the lower limit because this
Figure 2 – Concentrations of Freezing Nuclei as a
is the theoretical temperature at which SLW
function of temperature. Lines represent results from
freezes spontaneously.
various researchers. (Pruppacher and Klett,1997)
Let’s summarize briefly the important points to remember about cloud microphysics. First, latent
heat is absorbed or released during the various phase transitions of water. The relevance of this to
in-flight icing will become apparent in subsequent sections. Second, dew point is a measure of the
absolute humidity of the air, not temperature. So when assessing the available moisture in an
airmass, remember that although temperature will put a cap on the dew point, it is dew point that
actually reveals the moisture content of the air. Also, strong and/or sustained updrafts can often
yield relatively high LWC values and large droplet environments (provided the moisture is available
for condensation). Upslope flow around mountains and fronts can be the ideal locations for these
conditions to form. With respect to warm clouds, droplets are formed though condensation onto
CCN, followed by growth to precipitation through the collision-coalescence process. In cold
clouds, ice particles can form either by direct deposition onto FN or by the freezing of existing
droplets when they come into contact with an FN. However, given the relative scarcity of FN, it is
not unlikely to find liquid droplets at temperatures well below 0 °C. These liquid droplets may form
in above freezing temperatures and then get lifted up above the freezing level, or they may form
entirely below 0 °C. Recall that CCN are very abundant in the atmosphere, so when the LCL is
reached, if no FN are available supercooled liquid will naturally condense onto CCN. For
completeness, I should also mention that rain can be produced by snowflakes that form in sub-
freezing temperatures aloft, and then fall below the freezing level were they melt and hit the ground
as rain. This however doesn’t really affect our discussion on aircraft icing.
From cloud droplets to precipitation
We have already mentioned the process by which warm rain forms. We now consider how several
other types of precipitation form and how they affect aircraft icing conditions. We will also examine
how these precipitation types are observed at the ground in the hopes that it may help us infer what
icing conditions are likely to exist aloft. (NOTE: The information in this section is derived primarily
5/21from the COMET training module entitled “Icing Assessment Using Observations and Pilot
Reports”). The following discussion will focus on snow (SN), graupel/snow pellets (GS), freezing
drizzle (FZDZ), freezing rain (FZRA) and ice pellets (PL).
When snow conditions exist at the ground, the likelihood of icing aloft is reduced. Recall firstly that
when clouds contain ice particles they tend to glaciate relatively quickly. So a cloud which is
producing precipitation sized snow particles is less likely to contain SLW. If you have the benefit of
being at the site where snow has fallen, take a closer look at the particles that hit the ground. If the
snowflakes are pristine, you can be more confident that the lowest cloud layer has little or no SLW.
If on the other hand you observe tiny droplets frozen to the snowflake you will probably encounter
some SLW while in cloud. This is evidenced by the small frozen droplets that were collected by the
snowflake as it fell through the cloud. In any event, snowflakes at the ground reduce the likelihood
of finding SLW in the lowest cloud layer, but it by no means eliminates the possibility! Remember,
liquid water and ice can co-exist and many studies have shown this. As well, snow falling at the
surface does not say anything about upper cloud layers.
Graupel or snow pellets, occur at the ground when snowflakes fall into a region containing high
SLW. The snowflake becomes so heavily rimed with SLW that its original structure is collapsed and
completely unrecognizable. Graupel at the surface is certainly an indicator that significant amounts
of SLW are likely to exist aloft. Large graupel can also be an indicator of the presence of
thunderstorms. Use caution when flying through regions where graupel is reported at the surface.
Freezing rain can form through two methods. In the first, ice-phase precipitation falls into an
above-freezing layer aloft (inversion), melts or partially melts and then supercools as it falls into a
sub-freezing layer below. This is referred to as the classical mechanism for freezing rain formation.
This situation is often associated with frontal inversions, but can result from many other processes
as well. One example is when sub-freezing air is channelled into a valley below a layer of above-
freezing air. Even though stations in the surrounding area may be reporting only rain, areas within
the valley may experience freezing rain. The second mechanism for freezing rain formation is
dubbed the non-classical mechanism. Here, SLW forms entirely through collision and coalescence,
otherwise known as the warm rain process. In this case no melting layer exists aloft. This is important
to note, because pilots should not expect that a climb will take them into an above freezing layer. In
one study by Huffman and Norman (1988), they showed that about 62 % of freezing rain cases
formed through the classical mechanism, while 38 % were attributed to the non-classical
mechanism. When freezing rain is reported, expect that significant icing conditions exist from the
surface to some level above ground. Also be cautious that even if a melting layer does exist, there
may still be SLW above the layer that has formed through the collision-coalescence process.
There is no clear division between freezing drizzle and freezing rain, but for our purposes we will
define freezing drizzle as supercooled precipitation-sized particles with a diameter less than 500
microns. Freezing rain is thus defined as having a diameter of greater than 500 microns. Freezing
drizzle more often forms through the non-classical mechanism but has been shown to form through
the classical mechanism as well. Huffman and Norman (1988) found that 78 % of the cases they
studied were formed through the non-classical mechanism, while about 22 % formed through the
classical mechanism. Freezing drizzle, like freezing rain, is a good indicator that significant icing
conditions exist from the surface to some level above ground.
6/21Ice pellets form through a manner similar to the classical mechanism, only in this case the melting
layer is usually shallower. Snow falling into the layer partially melts and then refreezes as it falls into
the sub-freezing layer below. The presence of ice pellets at the surface suggests that freezing rain or
freezing drizzle exists at some altitude above ground, and hence significant icing conditions can be
expected. I must reiterate that both the classical and non-classical mechanisms can be present at the
same time; thus icing conditions may exist well above the melting layer.
Observed properties of clouds
The majority of aircraft icing encounters will take place in cloud. As a result, it is worth while taking
a moment to examine some of the observed properties of clouds so that we can more safely navigate
this beautiful, but sometimes deadly phenomenon.
Cumuliform clouds are less likely in the winter than in the summer, but have been observed at all
times of the year. Typically the droplet concentrations (#/m3) are higher and liquid water contents
(LWC) lie between 0.1 to 3.0 g/m3 (Paraschivoiu and Saeed). Droplets also tend to be skewed
toward larger diameters as updraft velocities are typically several metres per second. These clouds
tend to produce greater rates of ice accretion, but their horizontal extents are usually on the order of
5 to 10 km. The lifecycle of an average cumulus is about 30 min, but cumulus that are associated
with large scale systems like fronts and cyclones can continually regenerate resulting in a quasi-steady
state that can last for days. Cumulus, and in particular cumulonimbus, should be considered to have
high LWC and large drops and should be avoided whenever possible. Icing conditions in these
clouds can extend many thousands of feet vertically and even short exposure times can prove to be
hazardous.
Stratiform clouds are far more common in the winter than cumuliform. Although these clouds are
generally perceived as being less of a threat, many icing accidents have occurred in these clouds.
LWC tends to range between 0.1 and 0.8 g/m3 (Paraschivoiu and Saeed), but higher values have
been observed. Droplet sizes are usually smaller than in cumulus although this is not a guarantee.
Stratiform clouds tend to be more limited in vertical extent than cumulus, but can span many
hundreds of kilometres horizontally. Many freezing precipitation events originate from stratiform
clouds, often through the collision-coalescence process, and given their large horizontal range can
leave an unsuspecting pilot without any outs. The best option is usually to fly above the cloud layer,
but be careful on the climb-out because the highest LWC and the largest droplets are often found at or near
the cloud top. Incidentally, this can also be true for cumuliform clouds as well, depending on where
the tops are.
Perkins and Reike (2001) report on some statistical findings of aircraft icing environments. Results
of some of these findings are shown in Figures 3. For stratiform and cumuliform clouds, 90 %
have LWC less than 0.6 g/m3 and 1.2 g/m3, respectively. Also, 90 % of layered clouds have vertical
extents of 3000 ft or less (Figure 3a). In terms of horizontal extent, it has been found that 90 % of
icing conditions last 50 statute miles or less (Figure 3b). The overall probability of encountering
icing along your route of flight is about 40 % when temperatures are at or below 0 °C, and only
about 14 % when temperatures drop below –20 °C. Nevertheless, icing conditions do exist at all
temperatures down to –40 °C, so caution and preparation are always necessary no matter what the
temperature. To put things into perspective, Korolev, et al (2002) report on an icing encounter
during AIRS in which the NRC Convair-580 encountered severe icing at 18 000 ft and –29 °C. The
7/21Figure 3 – Cumulative frequency distribution of (a) depth of an icing encounter, and (b) distance flown
horizontally in icing during an encounter. (From Perkins and Reike, 2001)
pilots increased power by 20 to 30 % to maintain flight conditions, and after only 5 min were forced
to climb above cloud top to deice. The moral, expect the unexpected!
Icing Certification and Supercooled Large Droplets (SLD)
The icing environments required for certifying aircraft into icing conditions are outlined in the U.S.
Federal Aviation Regulations 23/25 Appendix C for commuter and transport category aircraft,
respectively. In Canada, these standards are located in Canadian Aviation Regulations 523/525
Appendix C, again for commuter and transport category aircraft. Although the names are different,
the icing environments required under all these regulations are identical. Thus for our purposes,
from this point forward we will refer to all of these standards collectively as CAR 525-C.
In order for an aircraft to be certified into known icing, the manufacturer must demonstrate that the
aircraft can safely penetrate regions with meteorological conditions specified under CAR 525-C.
The conditions are shown in Figures 4 a & b. Figure 4a is meant to represent icing in layered, or
stratiform clouds. This is referred to as continuous maximum icing. Figure 4b is referred to as
intermittent maximum icing, and is designed to represent conditions in cumuliform clouds. The curves
were developed over 40 years ago by the U.S. National Advisory Committee for Aeronautics
(NACA) following flight research. “These design standards were determined on the basis of an ice
protection system providing nearly complete protection in 99 percent of the icing encounters, and
that some degradation of aircraft performance would be allowed” (Aircraft Icing Handbook, 2000).
There are several important points to note about aircraft icing protection systems. All systems, no
matter what category of aircraft, must meet these basic minimums. Some aircraft may be capable of
penetrating regions of much greater icing, but these results are not required to be reported during
flight testing. So no matter how big or small the aircraft you fly is, don’t assume that it is capable of
more than the minimums. Furthermore, often pilots believe that aircraft are certified to remain in
8/21Figure 4 – CAR 525-C curves for (a) continuous and (b) intermittent maximum icing
icing conditions. Understand that the CAR 525-C curves are based on standard horizontal extents
of 17.4 nautical miles and 2.6 nautical miles for continuous and intermittent maximum icing,
respectively. Although flight test standards are quite stringent (such as safely demonstrating a 45
minute hold in icing), aircraft are not designed to remain in icing conditions indefinitely. Should you
decide to study icing further, a common theme among all instructional material is the following:
whenever you encounter icing, you should always start working to get out. We will discuss strategies for this in
subsequent sections.
CAR 525-C specifies conditions of LWC, temperature and mean effective drop diameter (MVD)
that an aircraft must be able to penetrate. Notice that the curves allow for lower LWC as
temperature decreases. Also notice that while intermittent maximum icing allows for MVD up to 50
microns, continuous maximum icing only allows for droplets up to 40 microns. Given that typical
droplet radii in cloud are in the range of 10 to 20 microns, this is usually not a concern. However,
under certain circumstances these maximum allowable MVDs can be exceeded, and in such cases
these droplets are referred to as supercooled large droplets (SLD). These insidious creatures are thought
to have caused several major icing accidents (including the one in Roselawn Indiana), and have been
the focus of much of our present research.
Freezing precipitation is one form of SLD. Freezing drizzle and freezing rain both far exceed the
icing certification envelopes and thus should never be intentionally penetrated. But SLD need not
be associated with precipitation. In some instances cloud droplets, particularly in clouds of greater
vertical extent, can grow by collision-coalescence to sizes much greater than 50 microns. When
updraft velocities in cloud are strong enough these droplets can remain in cloud without
precipitating out. Also note, that once precipitation leaves the cloud base it enters a sub-saturated
region and will begin to evaporate. From this we can infer two things: (1) freezing precipitation is
generally most hazardous at cloud base, and (2) freezing precipitation may exist aloft, even if it is not
reported at the ground. In the next section we will examine the dynamics of icing and why it is
never advisable to fly through regions that exceed CAR 525-C.
9/21The Dynamics of Icing and Icing Intensity Classification
We have already shown that CAR 525-C sets explicit limitations on the LWC, temperature and
MVD for aircraft icing environments. In this section we will see how each of these parameters
affects flight performance individually and cumulatively. We will begin with the types of icing
possible and then describe how the various environmental parameters affect how icing forms on an
aircraft and the performance penalties incurred. We will conclude with the standards for classifying
icing intensity.
Types of icing
Ice can form on an aircraft anytime liquid water strikes a surface where the total air temperature
(TAT) is below freezing. Recall that SLW is a meta-stable state, meaning it only exists because there
are insufficient freezing nuclei available for glaciation. The TAT is the sum of the static air
temperature (SAT, read off a stationary thermometer) and the kinetic rise resulting from airspeed
(Perkins and Reike, 2001). It is necessary to note that the relevant parameter here is TAT, because
this value can vary across an airfoil due to pressure variations. For example, the TAT will be highest
at the stagnation point on the leading edge of an airfoil because of the local pressure rise.
Conversely, the temperature will generally be lowest on the low pressure side of the airfoil (for wings
this is the top), as a result of the pressure decrease due to the Bernoulli effect. Wind tunnel testing
of a standard airfoil at 150 kts true airspeed, showed a temperature drop of 1.9 °C across the wing
(Aircraft Icing Handbook, 2000). Although outside air temperature (OAT) gauges generally measure
TAT, never assume that temperature is being reported with complete accuracy and realize also that
temperature can vary along an airfoil. Use caution when temperatures are at or slightly above 0 °C.
There are effectively three types of icing that an aircraft can experience: Clear (also known as Glaze),
Rime and Mixed. Clear ice usually occurs in regions where temperatures are near 0 °C and droplets
are relatively large. As a result, SLW striking the aircraft does not freeze instantly on impact. As the
droplet strikes the wings for example, it partially freezes and releases some latent heat (recall that ice
is a lower energy state than liquid, so energy must be released). This latent heat, in combination with
the kinetic temperature rise at the leading edge of the airfoil can cause some of the droplets to
runback before freezing entirely. This creates a smooth, dense coating of ice that can not only prove
to be very hazardous but can also be very difficult to detect visually, especially at night. In addition,
if allowed to accumulate it can form protrusions from the leading edge of the airfoil which can
significantly reduce aircraft performance. Clear ice is generally perceived as being the most
detrimental to flight characteristics (but again, this is not a rule!).
Rime ice forms when droplets impacting the airfoil freeze on contact. The conditions most
conducive to this type of ice are small droplets and low temperatures. These factors can act to
reduce TAT and runback. Because droplets freeze on impact air becomes trapped between the
frozen droplets producing a milky white appearance that is much easier to detect than clear ice.
Rime tends to be less dense and generally conforms to the airfoil leading edge. It is often seen as
being less dangerous than clear icing, but if left unattended can degrade airfoil performance
significantly.
10/21The mixed icing category encompasses a
continuum of icing types between rime
and clear. It can form protrusions like
clear ice, but by definition is milky white
in colour similar to rime. Mixed icing
can degrade performance in the same
manner as rime and clear, and should be
treated with the same level of caution.
Figure 5 shows a few icing shapes that
were produced on a cylinder in the
NASA icing wind tunnel, and illustrates
the wide range of icing that can be
observed in flight.
Figure 5 – A few ice shapes observed on a cylinder in the
In general, temperature and MVD NASA icing wind tunnel. (From Perkins and Reike, 2001)
account for icing type and shape, while
LWC and to a lesser degree MVD are responsible for the rate of accretion and hence severity of an
icing encounter. It should be noted however that the complex interplay between these three
parameters is still not very well understood. LWC is seen as being the most important factor, and it
has been speculated that for a given airspeed, temperature and MVD, an increase in LWC may cause
a transition from rime ice to clear ice (Hansmann, 1989). Also of supreme importance is the
duration of exposure. Longer exposure times will result in more quantities of ice being collected.
As well, ice protrusions formed on the leading edge of an airfoil can enhance the collection
efficiency of the airfoil and thus ice accretion will not necessarily increase in a linear fashion.
When flight planning, a rule of thumb for determining what type of icing can be expected in cloud is
the following: Clear (0°C to –10 °C), Mixed (–10 °C to –15 °C ) and Rime (–15 °C to –40 °C). Also,
stratiform clouds more typically contain rime while cumuliform are more often associated with clear.
These however are very general rules and should only be used as a guideline. Recall also that
freezing precipitation, which generally forms clear ice, can be produced in both cumuliform and
stratiform clouds at any temperature.
Dynamics of icing
The first point to note about ice accretion is that it is heavily dependent on the shape of the object
upon which the droplet is impinging – remember this throughout our discussion. What follows is a
general discussion of the dynamics of ice accretion, but it by no means is exhaustive. There are
many factors which affect ice accretion and this is still a very active area of research. For more
detailed discussion about types of ice protection available, please see the references at the end of this
paper.
Ice protection systems on aircraft are designed to meet the conditions specified in CAR 525-C. A
closer look at the wing of an aircraft certified for flight into known icing will reveal that on most
aircraft, only the leading edge of the wing is protected. This is based on the principle that droplets
which fall within the limits of CAR 525-C will not impinge beyond this protected surface. Very
small droplets have little inertia and thus for the most part are steered by the airflow. Figure 6
shows the airflow around a typical airfoil and demonstrates some possible droplet trajectories as a
11/21Figure 7 – Picture of icing runback beyond the
Figure 6 – Airflow around a typical airfoil. Also protected surface (circled). Icing encounter occurred on
shown are possible droplet trajectories. (From Perkins February 16, 2000 during AIRS and was classified
and Reike, 2001) by the pilots as severe. (From Isaac et al, 2001)
function of droplet size. Notice that small drops either impinge at or near the stagnation point, or
are completely deflected around the airfoil by the streamlines. Larger droplets have the ability to
break some of the streamlines and impact further aft on the airfoil. As a result, the overall collection
efficiency is increased. So even when LWC is low but droplet sizes are large, icing can still be
significant. When SLD conditions are encountered, depending on the airfoil, droplets may have the
ability to impinge beyond the protected surface. This can produce a ridge of ice beyond the
protected surface that cannot be cleared by the ice protection equipment. It can also act as a dam
which will rapidly collect ice and grow, causing a further degradation to airfoil performance. Ridging
is a very dangerous phenomenon and is common of SLD encounters. The best method for
removing a ridge of ice is to fly into above-freezing air or to get on top of the cloud where the ice
can sublimate. Note that ice-impingement can occur on both sides of the wings when SLD are
present. An example of ridging is shown in Figure 7.
Ice impingement is also a function of object shape and airspeed. A thicker wing section will tend to
deflect streamlines further up stream, and resultantly will generally accrete ice at a slower rate for a
given airspeed, temperature, LWC and MVD. As will be discussed near the end of this paper, this is
one reason why tailplane horizontal stabilizers have a higher collection efficiency and tend to accrete
ice more rapidly than wing sections. Airspeed affects ice accrete in an opposite manner to object
size. Higher airspeeds leave less time for the droplets to deflect and hence higher rates of accretion
may be observed on faster wing sections. Note however that the TAT when the airspeed is
increased will increase proportionally near the leading edge and may in fact bring the wing section
above 0 °C (Don’t count on this though!). An example of this kinetic heating effect is illustrated by
the ice protection equipment on most propeller systems. Often these propellers are heated electro-
thermally from the root to about the mid-point along the span in order to prevent or remove ice
accretion. From the mid-point to the tip, the propeller is moving fast enough that kinetic heating
keeps the blade above 0 °C and does not allow droplets to freeze on this portion of the propeller.
As stated earlier, LWC is perceived as being the most important factor in aircraft icing. As LWC
increases the rate of accretion and severity of the icing encounter will increase proportionally. As
this happens, increasing amounts of latent heat are released as droplets strike the airfoil and begin to
freeze. If enough liquid water is present some of the water may remain in liquid form long enough
to runback beyond the protected surface and form a ridge as shown in Figure 7. Runback ice can be
12/21a concern for both pneumatic boots and heated leading edges. In the case of heated leading edges, it
is possible under certain circumstances for the thermal device to enhance runback. Under normal
operating conditions, thermal de-icing/anti-icing is designed to evaporate most or all of the ice
impinging on the protected surface. If the heat supply becomes insufficient to evaporate the water
(e.g. due to low power settings, cold temperatures and LWC outside CAR 525-C), SLW impinging
on the heated surface may be warmed enough to remain in liquid form and runback beyond the
protected surface causing ridging. This is why LWC outside the CAR 525-C curves can be very
dangerous.
Performance penalties resulting from ice accretion
The aerodynamic penalties incurred when ice is accreted are given in Paraschivoiu & Saeed and can
be summarized as follows:
• Decreased Lift • Changes in pressure distribution
• Increased drag • Early boundary layer separation
• Decreased stall angle • Reduced controllability
• Increased vibration
Icing studies have shown that airfoil drag can increase up to 40 % or more while lift can be reduced
by as much as 30 % or more. Even small amounts of ice can increase stall speed by as much as 15
to 20 %. Vibrations can also create added stress on iced components leading to structural damage.
Propellers that become heavily iced may experience increased vibrations in addition to a loss of
efficiency of up to 19 %. Even when de-icing/anti-icing equipment is properly functioning, residual
ice remaining on unprotected surfaces can still be hazardous. On one research mission, the NASA-
Glenn Twin Otter experienced a 36 % drag increase resulting from ice collected on the unprotected
surfaces. This reiterates the point made earlier, whenever you encounter icing, you should always start working
to get out.
When icing is encountered be aware that any accreted ice will reduce your stall margin. If you are
unable to maintain airspeed and altitude, be prepared to accept a controlled descent in stead of a
control anomaly. Your chances of survival are much greater in a controlled descent than in a
recovery from a stall or spin.
Classification of aircraft icing environments
Standards for the classification of icing intensities are given in AIP 2.4 and are summarized below.
Trace Ice becomes perceptible. The rate of accretion is slightly greater than the rate of sublimation.
It is not hazardous, even though de-icing or anti-icing equipment is not used, unless encountered for
an extended period of time (over 1 hour)
Light Rate of accumulation may create a problem if flight is prolonged in this environment (over 1 hour)
Moderate The rate of accumulation is such that even short encounters become potentially hazardous, and use of
de-icing or anti-icing equipment or diversion is necessary
Severe The rate of accumulation is such that de-icing or anti-icing equipment fails to reduce or control the
hazard. Immediate diversion is necessary
13/21These definitions have been under review for quite some time now. There is much debate as to
their usefulness because they can be very subjective. As discussed earlier, different airfoils will
accrete ice at different rates. So all things being equal, two aircraft transiting the same region may
report two different intensities, based on the fact that one airfoil tends to accrete ice faster than the
other. And in reality, all things are not equal, so pilot experience and comfort level will also
influence his/her perception of icing intensity. These varying opinions can even be seen between
flight crews on research aircraft! So when encountering icing, try to be as objective as possible, but
realize that one pilot’s light encounter may be another pilot’s severe encounter.
Flight Planning
Proper flight planning and preparation are the key to effectively negotiating in-flight icing. Don’t be
fooled, no matter what aircraft you fly icing is always a hazard, but the risks can be limited by
making sure you have done everything possible to secure the safety of your flight. References made
to websites in the following paragraphs are also given with full web addresses at the end of this
paper.
Checking the weather
We start with a climatology of freezing rain and freezing drizzle over North America as shown by
Cortinas, et al (2004) in Figure 8. From this figure we see that there are in general three distinct
maxima; one located over the Great Lakes, one on the southwest side of Hudson Bay and the other
across eastern Labrador and Newfoundland. There is also a non-negligible frequency of freezing
precipitation which occurs across a large portion of Canada and the central United States. We will
not speculate as to why this distribution occurs, but you are encouraged to study this figure to get an
insight as to where icing conditions are likely to be. Remember though, this is a climatology based
on surface observations; in-flight icing can occur anywhere and at present a concrete climatology of
in-flight icing does not exist. In terms of locations of aircraft icing accidents, Cole and Sand (1991)
conducted a statistical study of aircraft icing accidents and found that 53 % occurred near
mountainous terrain, 14 % occurred near large bodies of water and 33 % occur in other regions.
Keep this information in mind when flight planning.
There is really no correct way to check the
weather, but whatever method you use make
sure it is systematic. This way you can be sure
that you have obtained all the key
components to the weather picture.
Generally a look at the big picture is usually
the first step. This can be done by looking at
the latest surface analysis given on
Environment Canada’s weather page (EC),
the U.S. Aviation Weather Center (AWC),
Aviation Digital Data Service (ADDS) or Nav
Canada’s flight planning site (NC). NC is the
usual reference for Canadian pilots, but I
encourage you to check out some of the other Figure 8 – Median annual hours of freezing drizzle
weather links. In particular, if you’re flying and freezing rain between 1976 and 1990. (From
down to the U.S., ADDS has a lot of great Cortinas, et al. 2004)
14/21weather resources available to pilots. Based on your knowledge of icing physics, you can begin to
draw a mental picture of where icing conditions may exist. Although icing is always a possibility
when TAT is at or below 0 °C, you can improve your analysis by identifying regions conducive to
the formation of high LWC and large droplet environments. Look for regions of strong and/or
persistent lifting such as fronts, low pressure centers (cyclones) and areas of upslope flow. The
latter point is an important one. When forecasting weather, always know your terrain. Many times all
the conditions may be right for a particular weather event to occur, but it doesn’t simply because
orographic features influenced the weather pattern (recall the example of freezing rain in the valley).
When considering fronts, recall that warm fronts have a slope of about 1:200, so icing conditions are
often found to exist as far as 300 statute miles or more ahead of the surface warm front. Icing may
be encountered in cloud or below cloud where freezing precipitation occurs. Cold fronts, although
not commonly associated with surface freezing precipitation, can produce freezing precipitation
aloft. In addition, the sharper slope of cold fronts can often produce clouds of greater vertical
development, and consequently higher LWC and larger droplet environments. Icing near cold
fronts is often observed 25 to 130 statute miles behind the surface cold front. Occluded fronts are
also producers of icing conditions and should be considered in you flight planning.
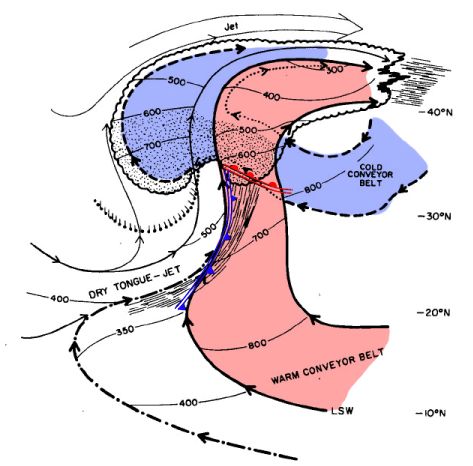
Figure 9 is an idealized picture of the airflow through a typical midlatitude cyclone. It can be used
as a model to assess your particular weather situation. Notice the warm conveyor belt ahead of the cold
front and the cold conveyor belt below the sloping warm front. These are the main air streams usually
observed. An assessment of the strength of the surface winds can give you a rough idea of how
strong the flow around a cyclone is. In addition, always look to see what the source of the airflow is.
If warm moist air (high temperatures and dew points) from the Gulf of Mexico or the east coast is
riding up over cold air that is driving down from the north, you can expect lots of moisture and the
potential for severe icing conditions in cloud and precipitation. A final point on cyclones is that
maximum precipitation is often observed to the west and northwest of a surface low pressure center.
Flight plan carefully around this area because although it is not usually characterized by strong
lifting, for reasons beyond our discussion here, it is a region conducive to the formation of SLD.
After developing a good mental picture of the
surface weather, a quick look at the upper air
charts can give you a good idea of the weather
aloft. The 850mb, 700mb, 500mb and 250mb
correspond roughly to 3000 ft, 10 000 ft, 18
000 ft and 32 000 ft respectively. A detailed
discussion of the information contained in
these charts is beyond this paper, but a couple
points are worth while mentioning. By
looking at any of the charts you can see
stations plotted with wind barbs and
numbers. Aside from pertinent information
given on wind, on the top left of the station
plot you will find temperature and on the
bottom left you will find the temperature-dew
point spread (otherwise known as the dew
point depression). If the dew point Figure 9 – Airflow through a typical midlatitude
depression is 5 °C or less, you can probably cyclone. (Adapted from Carlson, 1980)
15/21expect to find cloud in this region. This is a first step in assessing where clouds are likely to exist
along your route of flight. If you find that clouds are likely to exist through a considerable depth of
the atmosphere, expect the possibility of lots of icing. One downfall to these upper air charts is that
they have poor spatial and temporal resolution. They are based on atmospheric soundings taken
across the continent at 00Z and 12Z, and the stations are usually several hundred kilometres or
more apart. They cannot give a detailed picture of the weather, but with a little bit of extrapolation
they can provide a good estimate of current weather aloft. ADDS also provides forecasts for these
upper air charts.
Once you have formulated a general picture of the weather, you can begin to look at specifics.
Check Graphical Area Forecasts (GFA), Terminal Area Forecasts (TAF), AIRMETS, SIGMETS
and Significant Weather Charts (SIGWX) for your route of flight. GFAs give explicit information
on clouds and weather as well as locations of forecast icing and freezing level. Take note of the areal
extend of clouds, cloud tops and bases, frontal positions, precipitation and freezing level along your
route of flight. If you know nothing else before you leave the ground, know these 5 items! These are all very
important in planning your outs. Confirm that TAFs are consistent with the GFA. Generally TAFs
are more detailed and location specific, so if discrepancies exist, make sure you understand why.
Also confirm that METARs are consistent with forecasts and check to see if any of the precipitation
types discussed earlier exist. If they do, look at surrounding stations to see if they are reporting the
same type of weather. If you suspect freezing precipitation or significant SLW aloft, your best
option may be to avoid the area altogether. Also remember that every weather condition occurs for
a reason. Identify this reason and plan for the possibility that the current observations may change
or move to another region. Two other products available on ADDS are the Current and Forecast
Icing Potentials (CIP/FIP). These products provide an assessment of the likelihood of
encountering icing along your route of flight. They do not provide any information on severity but
can give you insight as to where icing conditions are most probable.
The final step in checking the weather is to look for Pilot Reports (PIREPS) along your route of
flight. Pay particular attention to time, altitude, type of aircraft and severity of icing. Remember that
icing severity is subjective as well as aircraft dependent, so put icing reports into context. Also
remember that icing, particularly severe icing is very transient in nature. What existed as little as 5
minutes ago may not exist right now. This has been demonstrated through the review of PIREPS
during post-accident investigations. Certain features however, such as fronts, tend to be somewhat
quasi-steady so icing PIREPS can to some extent be extrapolated with the front.
Filing the flight plan
With weather in hand you are ready to file your flight plan. You may find that your proposed route
of flight will take you into hazardous icing conditions. In this situation it may either be advisable not
to go, or to take a different route that will keep you out of the bulk of icing conditions. The
following are a few tips that can help you flight plan safely.
The first place to start when anticipating icing conditions is to know your aircraft. Be familiar with
all the systems, in particular the ice protection systems. Also be cognizant of your aircraft’s
performance limitations. Piston aircraft usually cruise at 75-85% power, which reduces their thrust
margin for climbing out of icing conditions should they occur. Keep in mind what the cloud tops
are and know whether your aircraft can climb above them. Realize that an iced wing will not climb
as efficiently as a clean wing. If climbing above cloud tops is not an option, examine the possibility
16/21of descending to a lower altitude where temperatures are above freezing or cloud bases are high
enough that you can get below. Be mindful however of your Minimum Enroute Altitude (MEA)
and ensure that a descent will not create a risk of flying into terrain. If you expect to encounter a
front, penetrate the front at a 90 degree angle to minimize your exposure time. If flying along a
mountain, or elevated terrain, where the wind is flowing at an angle to the ridge line, stay to the
leeward side where descending air is free of clouds and SLW. In both cases a minor diversion can
significantly reduce your risk of encountering icing. In any event, always have an out for every stage of the
flight! It is much easier to think of one on the ground than in the air, when your time is running out.
Preparing the aircraft
Once you’re ready to go, complete a final check of the aircraft. Make sure that all the surfaces are
clean, including wings, horizontal stabilizer, vertical stabilizer, fuselage and pitot/static ports. Also
make sure that no ice has collected in the cavities of the movable surfaces which would inhibit full
deflection of control surfaces. Ensure that pitot/static ports are being properly heated and check to
make sure that de-icing/anti-icing equipment is properly functioning. Ground de-icing/anti-icing
may be necessary. Guidelines and procedures for ground icing operations can be found on
Transport Canada’s web page (given at the end of this paper).
Before take-off, brief the possibility of icing and have a plan. Review the weather for the departure
aerodrome and confirm that it is as expected. A deterioration or change in weather conditions may
warrant the cancellation of your flight, even if this is decided as you taxi onto the runway. As well,
make sure that you have easy access to the weather along your route and review the relevant items
along every phase of your flight.
In-Flight Strategies
The topic of in-flight strategies can be broken down into two categories, monitoring the weather
and flying in ice. We will begin by looking at avoidance techniques while in the air and finish with
examining some strategies that you can use to cope with an icing encounter. The following is only a
brief description of the topic. A much more detailed description of flying procedures in ice can be
obtained through the NASA In-Flight Icing Training for Pilots (CD and videos referenced at the
end of this paper).
Monitoring the weather
Monitoring the weather is a crucial part of flying, no matter what the season. It should become a
natural part of your routine much like the periodic check of flight and engine instruments. The
concept is quite basic and provided you remember your flight planning techniques, it can be
accomplished in minimal time. It is understandable that cockpit workload can be tremendous,
particularly when flying single pilot IFR in ice. If the situation becomes overwhelming, remember
your outs and use them. There is no shame in landing short of your destination to hold for weather
or to take a moment to better analyze the situation. Don’t make weather the last on your priority
list.
The primary purpose of Air Traffic Control is to ensure the smooth and safe flow of traffic
throughout controlled airspace. Although some weather information may be obtained from these
centres, your best option is usually to contact Flight Service (126.7 MHz) in Canada or Flight Watch
17/21(122.0 MHz) in the United States. Periodically contact these services to update weather along your
route. Of interest to you are recent PIREPS, METARS and updated forecasts. PIREPS will give
you information on what other pilots have encountered. Remember, icing is transient and PIREPS
can be subjective, but used in context they can be very helpful. METARS contain several pieces of
information that can help you assess the weather situation. Cloud bases and visibility will help you
determine whether your destination and alternate airports are holding their forecasts as expected.
They can also provide information on precipitation to assess the potential for icing conditions aloft.
Temperature changes and wind shifts, often followed by gusty conditions, can help you assess where
fronts are located if expected along you route of flight. Finally, explain your intentions to the flight
service specialist and ask him/her to interpret the weather for you. They have access to products
such as satellite imagery and radar composites that can help give you a better picture of the weather.
In addition to updating weather along your route, be aware of the weather you are currently in. If
radar equipped, check for regions containing precipitation echoes and try to avoid them. These can
be clues that SLD or freezing precipitation exists in the area. Be sure to monitor your outside air
temperature gauge and confirm that the temperature is what you expected. If your only out was to
descend below the freezing level, and the freezing level begins to drop, reassess your outs and make
sure you don’t get trapped. Also, if flying in and out of clouds, look for visual cues such as building
and newly developing cloud tops and avoid them. Young clouds are more likely to contain SLW.
The rules for checking the weather along your route are simple: Confirm that the weather is holding
as expected, reassess your outs and don’t get trapped!
Coping with icing
There are typically 6 options that you have when you encounter ice (NASA In-Flight Icing Training
for Pilots). These are to climb, descend, continue, divert, return or declare an emergency. It is important that
you never forget that these choices are available to you. With proper flight planning you should
already have an idea of what you intend to do. If icing conditions are minimal, you may decide to
continue and monitor the conditions to make sure that they don’t get any worse. Recall from
Figure 3b that 90 % of icing encounters are less than 50 statute miles in horizontal extent. You can
also descend below the freezing level (being mindful of the MEA) or climb above cloud tops. If you
decide to climb, be cautious near cloud tops because this is where the worst icing conditions can
occur. Even if you can’t top the clouds, recall from Figure 3a that in 9 out of 10 times, a change in
altitude of 3000 ft will take you out of the icing conditions. If you start to pick-up ice, don’t wait
until you have used all available power. Piston aircraft generally have a smaller thrust margin than
turbine aircraft, so quick and accurate pilot decision making skills are imperative. When climbing or
descending, be sure to fly at a safe airspeed recalling that stall angle can be significantly reduced.
Also, keep bank angles to a minimum when ice has been accreted; increasingly icing accidents are
being attributed to control anomalies such as wing stalls and tail stalls. Diverting to an alternate or
turning around are also viable options. Presumably the icing conditions where you came from are
better than those that you are in. Examine these as possibilities if climbing or descending is not an
option. Finally, when all else fails, be aware that you can always declare an emergency. This will
give you priority handling and may be your only way out. The consequences of declaring an
emergency are negligible compared to those of a crash due to icing. Remember that ATC’s primary
function is to ensure the smooth and safe flow of air traffic, and that only you know exactly what
the weather is like where you are. If you feel that the present weather conditions may adversely
18/21You can also read