Important Shifts in Americans' Attitudes Towards Science
←
→
Page content transcription
If your browser does not render page correctly, please read the page content below
Important Shifts in Americans’
     Attitudes Towards Science
     February 2021

       This research was conducted by ScienceCounts to improve understanding of
       the role of science in American society.

       Inquiries:    Christopher Volpe, PhD
                     Executive Director
                     volpe@sciencecounts.org

1735 20th Street, NW, Washington, DC 20009                     www.sciencecounts.org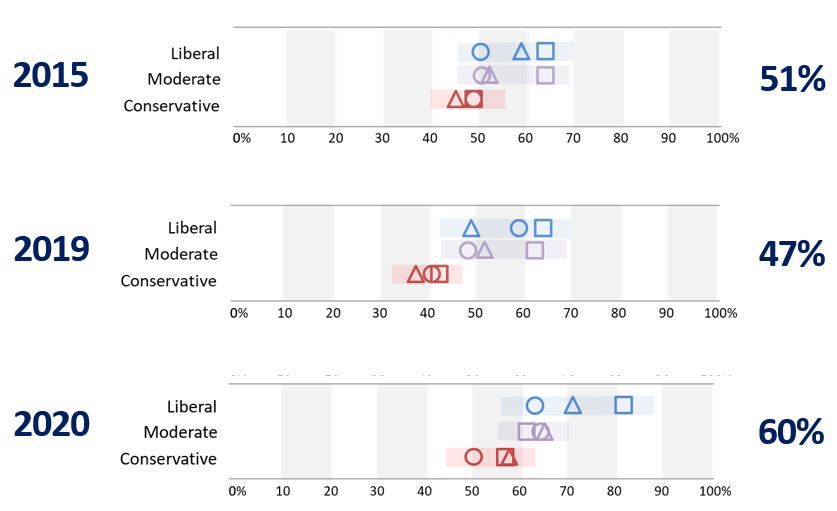
TABLE OF CONTENTS
                              Science Priorities
         4 – 15                    Americans’ prioritization of science plunges in many
                                   areas as COVID-19 and the economy top concerns

                               Trust in Scientists
        16 – 24                    More Americans trust that scientists are acting in
                                   society’s best interest and conduct themselves with
                                   integrity

                               Civic Engagement
         25 – 30                   More Americans want to see scientists engage with
                                   policymakers and the public, although liberals and
                                   conservatives differ to what extent

                               Sector Favorability
        31 – 42                    ‘Science’ is the common denominator among
                                   organization experiencing uptick in public favorability

      ABOUT ScienceCounts
          ScienceCounts is a nonprofit organization committed to supporting science and
          scientists in order to fuel American job creation, drive economic growth, improve
          health care, ensure national security, attain energy independence, foster
          environmental sustainability, and enhance quality of life for all. We conduct opinion
          research and science communication activities to advance our mission.

1735 20th Street, NW, Washington, DC 20009                              www.sciencecounts.org
                                                2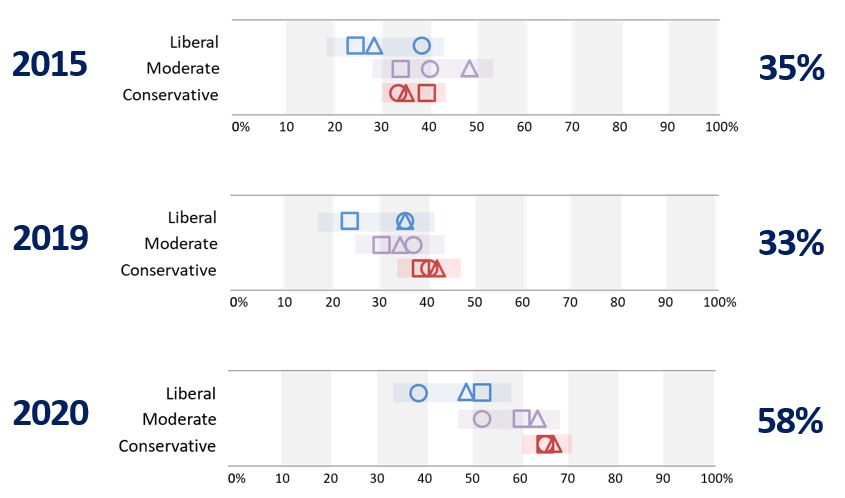
METHODOLOGY
          Surveys were co-designed with, and administered by, Edge Research.

          The 2015 survey was fielded October 15-30, 2015. An online sampling methodology
          was employed using the KnowledgePanel, the largest probability-based online panel
          in the U.S. [then owned by GfK], a leading online research panel provider. Where
          needed, weighting was applied to the data to balance the sample for demographic and
          socio-economic characteristics. Sample size is 2,021. The margin of error [that the
          sample represents the true distribution of the population] is ±2.1 percentage points at
          the 95% confidence level for the whole sample, and varies for subgroups reported.

          The 2019 survey was fielded October 15-30, 2015. IPSOS provided online sample
          through the KnowledgePanel, the largest probability-based online panel in the U.S. A
          national random sample was invited to participate in the survey and where needed,
          weighting was applied to the data to balance the sample for demographic and socio-
          economic characteristics. Sample size is 1,525. The margin of error [that the sample
          represents the true distribution of the population] is ±2.5 percentage points at the
          95% confidence level for the whole sample, and varies for subgroups reported.

          The 2020 survey was fielded November 18-24, 2020. Sample was provided by
          Dynata, a leading online research panel provider. A national random sample was
          invited to participate in the survey and quotas by age, gender, race, ethnicity, and
          region were maintained to ensure the sample composition is representative of the US
          Adult 18+ population. Where needed, weighting was applied to the data to balance
          the sample for demographic and socio-economic characteristics. Sample size is 1,559.
          Statistically significant differences between subgroups of the whole sample are
          reported at the 95% confidence level.

      ACKNOWLEDGEMENTS
          This research was made possible through the generous support of the following:

                                                               Hellman Family

1735 20th Street, NW, Washington, DC 20009                              www.sciencecounts.org
                                               3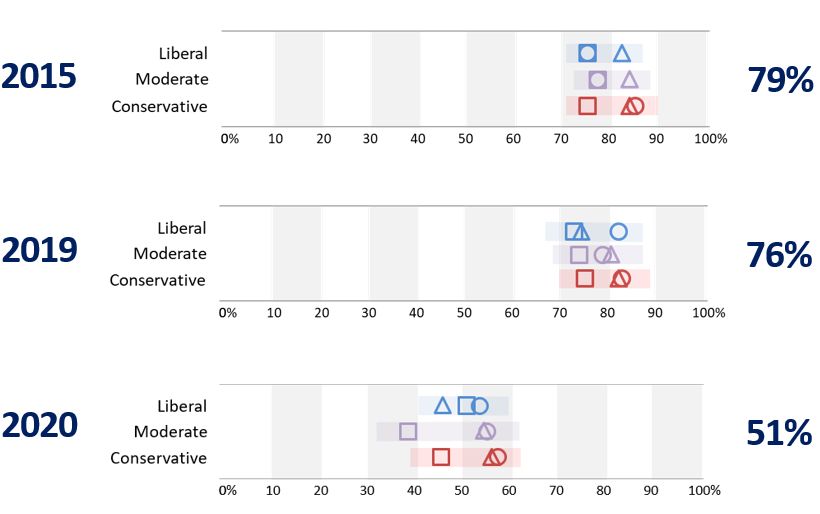
PART I              Science Priorities

     COVID-19 Shakes-up
     Americans’ Science Priorities
     February 2021

       This survey was conducted by ScienceCounts to improve understanding of the
       role of science in American society.

       Inquiries:    Christopher Volpe, PhD
                     Executive Director
                     volpe@sciencecounts.org

1735 20th Street, NW, Washington, DC 20009                     www.sciencecounts.org
                                             4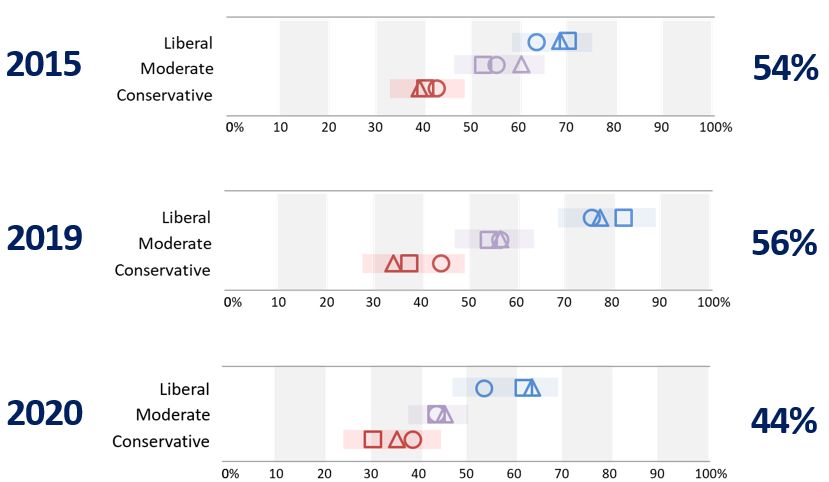
COVID-19 Shakes-up Americans’ Science Priorities
A new survey shows that about half of Americans (53%) say COVID-19 is their top concern in
2021, with another quarter (22%) saying it’s the economy. The public’s sense of urgency
around specific scientific research areas has dramatically shifted to align with these
concerns, in some cases, along partisan lines.
SCIENCE PRIORITIES
Americans’ prioritization of science
In recent years, Americans’ science
plunges in many areas as COVID-19 and
priorities have been steady: the
sense of urgency around seven the economy top concerns
science-related areas changed less
Percentage of respondents who say scientific research
than 4% between 2015 and 2019. urgently needs to focus on:
COVID-19 and its economic
consequences have changed that. 80
Down are the percentage of
respondents who say that
scientific research urgently needs 70 FOOD AND
to focus on non-COVID diseases
WATER SAFETY
(down 25%, from 76% to 51%),
opioid addiction (down 17%, from HUNGER
50% to 33%), the environment
(down 12%, from 56% to 44%), 60 EDUCATION ECONOMY
and food and water safety (down
10%, from 78% to 68%).
Up is the percentage of CURING DISEASE
50
respondents who say that
scientific research urgently needs DISABLED
to focus on economic growth (up ENVIRONMENT
25%, from 33% to 58%), becoming
a high priority for two-thirds of 40
conservative (67%) and half of OPIOID
liberal Americans (48%). ADDICTION
NATIONAL
The urgency of scientific research 30 DEFENSE
associated with national defense
UNDERSERVED
and underserved communities is COMMUNITIES
statistically indistinguishable.
20
Detailed breakdowns by ideology
and education – the two 2015 2019 2020
characteristics often associated Data from ScienceCounts national public
with the greatest variability – are benchmark surveys conducted in the fall of
provided on the following pages. 2015, 2019, and 2020.
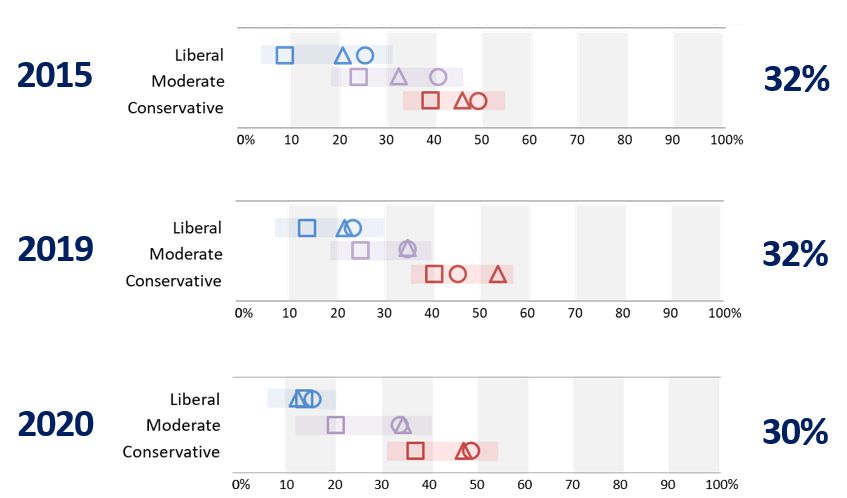
5Ideology-Education Segmentation
Percentage of respondents who say economic growth should be an urgent priority of
scientific research.
Survey year is on the left. Overall percentages per year are on the right. Liberals,
moderates, and conservatives are vertically separated for clarity. Education level
follows the key at the bottom of the page. Uncertainties are ±2.5% at the 95%
confidence level for data representing the whole sample, and no greater that ±5% for
individual population segments.
ECONOMIC GROWTH
High School graduate or less
Some college or trade school
College degree or higher
6Ideology-Education Segmentation
Percentage of respondents who say curing disease should be an urgent priority of
scientific research.
Survey year is on the left. Overall percentages per year are on the right. Liberals,
moderates, and conservatives are vertically separated for clarity. Education level
follows the key at the bottom of the page. Uncertainties are ±2.5% at the 95%
confidence level for data representing the whole sample, and no greater that ±5% for
individual population segments.
CURING DISEASES
(cancer, Alzheimers, etc.)
High School graduate or less
Some college or trade school
College degree or higher
7Ideology-Education Segmentation
Percentage of respondents who say food and water safety should be an urgent priority
of scientific research.
Survey year is on the left. Overall percentages per year are on the right. Liberals,
moderates, and conservatives are vertically separated for clarity. Education level
follows the key at the bottom of the page. Uncertainties are ±2.5% at the 95%
confidence level for data representing the whole sample, and no greater that ±5% for
individual population segments.
FOOD AND WATER SAFETY
High School graduate or less
Some college or trade school
College degree or higher
8Ideology-Education Segmentation
Percentage of respondents who say protecting the environment should be an urgent
priority of scientific research.
Survey year is on the left. Overall percentages per year are on the right. Liberals,
moderates, and conservatives are vertically separated for clarity. Education level
follows the key at the bottom of the page. Uncertainties are ±2.5% at the 95%
confidence level for data representing the whole sample, and no greater that ±5% for
individual population segments.
THE ENVIRONMENT
High School graduate or less
Some college or trade school
College degree or higher
9Ideology-Education Segmentation
Percentage of respondents who say treating opioid addiction should be an urgent
priority of scientific research.
Survey year is on the left. Overall percentages per year are on the right. Liberals,
moderates, and conservatives are vertically separated for clarity. Education level
follows the key at the bottom of the page. Uncertainties are ±2.5% at the 95%
confidence level for data representing the whole sample, and no greater that ±5% for
individual population segments.
OPIOID ADDICTION
High School graduate or less
Some college or trade school
College degree or higher
10Ideology-Education Segmentation
Percentage of respondents who say national defense should be an urgent priority of
scientific research.
Survey year is on the left. Overall percentages per year are on the right. Liberals,
moderates, and conservatives are vertically separated for clarity. Education level
follows the key at the bottom of the page. Uncertainties are ±2.5% at the 95%
confidence level for data representing the whole sample, and no greater that ±5% for
individual population segments.
NATIONAL DEFENSE
High School graduate or less
Some college or trade school
College degree or higher
11Ideology-Education Segmentation
Percentage of respondents who say aiding underserved communities should be an
urgent priority of scientific research.
Survey year is on the left. Overall percentages per year are on the right. Liberals,
moderates, and conservatives are vertically separated for clarity. Education level
follows the key at the bottom of the page. Uncertainties are ±2.5% at the 95%
confidence level for data representing the whole sample, and no greater that ±5% for
individual population segments.
UNDERSERVED COMMUNITIES
High School graduate or less
Some college or trade school
College degree or higher
12Ideology-Education Segmentation
Percentage of respondents who say addressing hunger and poverty should be an
urgent priority of scientific research.
Survey year is on the left. Overall percentages per year are on the right. Liberals,
moderates, and conservatives are vertically separated for clarity. Education level
follows the key at the bottom of the page. Uncertainties are ±2.5% at the 95%
confidence level for data representing the whole sample, and no greater that ±5% for
individual population segments.
HUNGER AND POVERTY
High School graduate or less
Some college or trade school
College degree or higher
13Ideology-Education Segmentation
Percentage of respondents who say improving the education of children should be an
urgent priority of scientific research.
Survey year is on the left. Overall percentages per year are on the right. Liberals,
moderates, and conservatives are vertically separated for clarity. Education level
follows the key at the bottom of the page. Uncertainties are ±2.5% at the 95%
confidence level for data representing the whole sample, and no greater that ±5% for
individual population segments.
EDUCATION OF CHILDREN
High School graduate or less
Some college or trade school
College degree or higher
14Ideology-Education Segmentation
Percentage of respondents who say assisting the disabled should be an urgent priority
of scientific research.
Survey year is on the left. Overall percentages per year are on the right. Liberals,
moderates, and conservatives are vertically separated for clarity. Education level
follows the key at the bottom of the page. Uncertainties are ±2.5% at the 95%
confidence level for data representing the whole sample, and no greater that ±5% for
individual population segments.
ASSISTING THE DISABLED
High School graduate or less
Some college or trade school
College degree or higher
15PART II Trust in Scientists
Americans’ Trust in Scientists
Surged in 2020
February 2021
This survey was conducted by ScienceCounts to improve understanding of the
role of science in American society.
Inquiries: Christopher Volpe, PhD
Executive Director
volpe@sciencecounts.org
1735 20th Street, NW, Washington, DC 20009 www.sciencecounts.org
16Americans’ Trust in Scientists Surged in 2020
A new survey shows that Americans’ trust in scientists, down slightly in recent years,
increased sharply in 2020, a likely consequence of the central role scientists have played in
addressing the COVID-19 pandemic.
MOTIVE AND HONESTY
More Americans trust that scientists are
Americans’ trust in scientists acting in society’s best interest and
increased across the survey
measures by an average of 10% in conduct themselves with integrity
2020, a marked departure from
Percentage of respondents who say they have a great deal of
the slight decline seen between trust or somewhat trust scientists to:
2015 to 2019.
Up is the public’s trust in scientists 80
to act in society’s best interest
(73% from 69%), to act in the REPORT FINDINGS
respondent’s best interest (68% ACCURATELY ACT IN SOCIETY’S
from 58%), and to put their BEST INTEREST
personal politics aside (63% from ACT IN
52%), suggesting that more TELL THE
70 TRUTH
RESPONDENT’S
Americans have a favorable view BEST INTEREST
of scientists’ underlying motives.
PUT ASIDE
PERSONAL
Also up is the public’s trust in
POLITICS
scientists to report findings that go
against their research sponsor REPORT FINDINGS
(60% up from 47% in 2019 and 60 THAT GO AGAINST
51% in 2015) and to admit when THEIR SPONSOR
they are wrong (57% up from ADMIT WHEN
47%), suggesting that more THEY ARE
Americans believe scientists to be WRONG
honest and to report findings
truthfully.
50
Higher levels of trust span the
ideological spectrum, education
levels, age, gender, and race,
although the largest increases are
often among college-educated,
liberal Americans. 40
2015 2019 2020
Detailed breakdowns by ideology
and education – the two Data from ScienceCounts national public
characteristics associated with the benchmark surveys conducted in the fall of
greatest variability – are provided 2015, 2019, and 2020.
in the following pages.
17Ideology-Education Segmentation
Percentage of respondents who say they have a great deal of trust or somewhat trust
scientists to report findings accurately.
Survey year is on the left. Overall percentages per year are on the right. Liberals,
moderates, and conservatives are vertically separated for clarity. Education level
follows the key at the bottom of the page. Uncertainties are ±2.5% at the 95%
confidence level for data representing the whole sample, and no greater that ±5% for
individual population segments.
REPORT FINDINGS
ACCURATELY
High School graduate or less
Some college or trade school
College degree or higher
18Ideology-Education Segmentation
Percentage of respondents who say they have a great deal of trust or somewhat trust
scientists to tell the truth.
Survey year is on the left. Overall percentages per year are on the right. Liberals,
moderates, and conservatives are vertically separated for clarity. Education level
follows the key at the bottom of the page. Uncertainties are ±2.5% at the 95%
confidence level for data representing the whole sample, and no greater that ±5% for
individual population segments.
TELL THE TRUTH
High School graduate or less
Some college or trade school
College degree or higher
19Ideology-Education Segmentation
Percentage of respondents who say they have a great deal of trust or somewhat trust
scientists to report findings even if they go against the sponsor of the research.
Survey year is on the left. Overall percentages per year are on the right. Liberals,
moderates, and conservatives are vertically separated for clarity. Education level
follows the key at the bottom of the page. Uncertainties are ±2.5% at the 95%
confidence level for data representing the whole sample, and no greater that ±5% for
individual population segments.
REPORT FINDINGS THAT GO
AGAINST THE SPONSOR
High School graduate or less
Some college or trade school
College degree or higher
20Ideology-Education Segmentation
Percentage of respondents who say they have a great deal of trust or somewhat trust
scientists to put aside personal politics.
Survey year is on the left. Overall percentages per year are on the right. Liberals,
moderates, and conservatives are vertically separated for clarity. Education level
follows the key at the bottom of the page. Uncertainties are ±2.5% at the 95%
confidence level for data representing the whole sample, and no greater that ±5% for
individual population segments.
PUT ASIDE PERSONAL
POLITICS
High School graduate or less
Some college or trade school
College degree or higher
21Ideology-Education Segmentation
Percentage of respondents who say they have a great deal of trust or somewhat trust
scientists to admit when they are wrong.
Survey year is on the left. Overall percentages per year are on the right. Liberals,
moderates, and conservatives are vertically separated for clarity. Education level
follows the key at the bottom of the page. Uncertainties are ±2.5% at the 95%
confidence level for data representing the whole sample, and no greater that ±5% for
individual population segments.
ADMIT WHEN THEY ARE
WRONG
High School graduate or less
Some college or trade school
College degree or higher
22Ideology-Education Segmentation
Percentage of respondents who say they have a great deal of trust or somewhat trust
scientists to act in your best interest.
Survey year is on the left. Overall percentages per year are on the right. Liberals,
moderates, and conservatives are vertically separated for clarity. Education level
follows the key at the bottom of the page. Uncertainties are ±2.5% at the 95%
confidence level for data representing the whole sample, and no greater that ±5% for
individual population segments.
ACT IN THEIR BEST INTEREST
High School graduate or less
Some college or trade school
College degree or higher
23Ideology-Education Segmentation
Percentage of respondents who say they have a great deal of trust or somewhat trust
scientists to act in society’s best interest.
Survey year is on the left. Overall percentages per year are on the right. Liberals,
moderates, and conservatives are vertically separated for clarity. Education level
follows the key at the bottom of the page. Uncertainties are ±2.5% at the 95%
confidence level for data representing the whole sample, and no greater that ±5% for
individual population segments.
ACT IN SOCIETY’S BEST
INTEREST
High School graduate or less
Some college or trade school
College degree or higher
24PART III Civic Engagement
Since COVID-19, More
Americans See Urgent Role for
Scientists Outside of the Lab
February 2021
This survey was conducted by ScienceCounts to improve understanding of the
role of science in American society.
Inquiries: Christopher Volpe, PhD
Executive Director
volpe@sciencecounts.org
1735 20th Street, NW, Washington, DC 20009 www.sciencecounts.org
25Since COVID-19, More Americans See Urgent Role for
Scientists in Policymaking and Public Engagement
A new survey shows that since the onset of COVID-19, more Americans believe it is a high
priority for scientists to interact with government policymakers and the public.
SCIENTISTS AND SOCIETY More Americans want to see scientists
Since 2019, more Americans engage with policymakers and the public,
believe it should be a high priority although liberals and conservatives differ
for scientists to interact with
policymakers and the public. to what extent
Percentage of respondents who say it should be a high priority
Nearly half (46% up from 33% in for scientists to:
2019) of the public believe
interaction between scientists and 50
government policymakers is a high INTERACT WITH
priority. Liberal (58%) and GOVERNMENT
conservative (41%) Americans are POLICYMAKERS
somewhat divided on this issue.
ENSURE POLICYMAKERS
Overall, 43% of Americans (up USE SCIENCE
from 32% in 2019) believe it is a 40
high priority for scientists to
ensure that policymakers use
scientific evidence in decision
making. Liberal (63%) and ENSURE OUR
conservative (36%) Americans are CULTURE VALUES
more divided on this issue. SCIENCE
30
Some Americans also strongly PROTEST, ADVOCATE,
believe that scientists should OR DEMONSTRATE
ensure that our culture values ABOUT SCIENCE-
science (33%) and protest, RELATED POLICY
advocate, and demonstrate about
science-related policy (27%) – both 20
up 10% from 2019. Liberal and
conservative Americans disagree
on the extent once again: 49% and
40% of liberals view these issues
with high priority versus 28% and
21% for conservatives.
10
Detailed breakdowns by ideology 2019 2020
and education – the two
characteristics associated with the Data from ScienceCounts national public benchmark
surveys conducted in the fall of 2019 and 2020.
greatest variability – are provided
in the following pages.
26Ideology-Education Segmentation
Percentage of respondents who say that should be a high priority for scientists to
interact directly with government policymakers.
Survey year is on the left. Overall percentages per year are on the right. Liberals,
moderates, and conservatives are vertically separated for clarity. Education level
follows the key at the bottom of the page. Uncertainties are ±2.5% at the 95%
confidence level for data representing the whole sample, and no greater that ±5% for
individual population segments.
INTERACT DIRECTLY WITH
GOVERNMENT POLICYMAKERS
High School graduate or less
Some college or trade school
College degree or higher
27Ideology-Education Segmentation
Percentage of respondents who say that should be a high priority for scientists to
ensure that policymakers use scientific evidence.
Survey year is on the left. Overall percentages per year are on the right. Liberals,
moderates, and conservatives are vertically separated for clarity. Education level
follows the key at the bottom of the page. Uncertainties are ±2.5% at the 95%
confidence level for data representing the whole sample, and no greater that ±5% for
individual population segments.
ENSURE THAT POLICYMAKERS
USE SCIENTIFIC EVIDENCE
High School graduate or less
Some college or trade school
College degree or higher
28Ideology-Education Segmentation
Percentage of respondents who say that should be a high priority for scientists to
ensure that our culture values science.
Survey year is on the left. Overall percentages per year are on the right. Liberals,
moderates, and conservatives are vertically separated for clarity. Education level
follows the key at the bottom of the page. Uncertainties are ±2.5% at the 95%
confidence level for data representing the whole sample, and no greater that ±5% for
individual population segments.
ENSURE THAT OUR CULTURE
VALUES SCIENCE
High School graduate or less
Some college or trade school
College degree or higher
29Ideology-Education Segmentation
Percentage of respondents who say that should be a high priority for scientists to
protest, advocate, or demonstrate about science-related policy.
Survey year is on the left. Overall percentages per year are on the right. Liberals,
moderates, and conservatives are vertically separated for clarity. Education level
follows the key at the bottom of the page. Uncertainties are ±2.5% at the 95%
confidence level for data representing the whole sample, and no greater that ±5% for
individual population segments.
PROTEST, ADVOCATE, OR
DEMONSTRATE ABOUT
SCIENCE-RELATED POLICY
High School graduate or less
Some college or trade school
College degree or higher
30PART IV Sector Favorability
Americans View Science
Organizations More Favorably
February 2021
This survey was conducted by ScienceCounts to improve understanding of the
role of science in American society.
Inquiries: Christopher Volpe, PhD
Executive Director
volpe@sciencecounts.org
1735 20th Street, NW, Washington, DC 20009 www.sciencecounts.org
31Americans View Science-Related Organizations
More Favorably Since the Onset of COVID-19
A new survey shows that Americans’ views on science-related organizations has grown more
favorable while their approval of other organizations has remained the same or declined
since last year.
SCIENCE LIFTS ‘Science’ is the common denominator
Since 2019, more Americans have among organization experiencing uptick
a favorable view of for-profit in public favorability
companies, academic institutions,
and government agencies Shift between 2019 (arrow root) to 2020 (arrow head) in the
percentage of respondents with a favorable view of:
connected with science.
30 40 50 60 70 80
Nearly half (48%) of respondents
have a favorable view of
pharmaceutical companies, up PHARMACEUTICAL
+19
19% from 29% in 2019. Views of COMPANIES
federal science agencies and the FEDERAL SCIENCE
science community are also up 8% +8
AGENCIES
(68%, up from 60%) and 7%,
(69% up from 63%), respectively. SCIENTIFIC
+7
The rise in public sentiment spans COMMUNITY
most demographics, but is
AEROSPACE AND
especially pronounced among +2
DEFENSE COMPS
liberal Americans, non-college
educated Americans, older NON-PROFITS
+1
Americans, minorities, and women. AND CHARITIES
In contrast, public favorability PUBLIC COLLEGES /
UNIVERSITIES -2
decreased for technology and
consumer goods companies by 8%
(57%, down from 65%) and 6% U.S. MILITARY -3
(57%, down from 63%),
respectively. IVY LEAGUE COLLEGES
/ UNIVERSITIES
-3
Favorability for other sectors
remained statistically unchanged CONSUMER GOODS
COMPANIES -6
overall, although some movement
was observed for particular TECHNOLOGY
demographic subgroups. COMPANIES
-8
Detailed breakdowns by ideology,
education, age, race, and gender 30 40 50 60 70 80
are provided on the following Data from ScienceCounts national public benchmark
pages. surveys conducted in the fall of 2019 and 2020.
32Segmentation
Shift in the percentage of respondents with a favorable view of pharmaceutical
companies between 2019 and 2020.
The overall response is in the far left column. Breakout by ideology, education, age,
race, and gender in successive columns. Uncertainty is ±2.5% at the 95% confidence
level for data representing the overall sample, and generally no greater than ±5% for
individual population segments.
PHARMACEUTICAL
COMPANIES
IDEOLOGY EDUCATION AGE RACE GENDER
XX 2019 XX 2020
33Segmentation
Shift in the percentage of respondents with a favorable view of federal government
science agencies between 2019 and 2020.
The overall response is in the far left column. Breakout by ideology, education, age,
race, and gender in successive columns. Uncertainty is ±2.5% at the 95% confidence
level for data representing the overall sample, and generally no greater than ±5% for
individual population segments.
FEDERAL GOVERNMENT
SCIENCE AGENCIES
IDEOLOGY EDUCATION AGE RACE GENDER
XX 2019 XX 2020
34Segmentation
Shift in the percentage of respondents with a favorable view of the scientific
community between 2019 and 2020.
The overall response is in the far left column. Breakout by ideology, education, age,
race, and gender in successive columns. Uncertainty is ±2.5% at the 95% confidence
level for data representing the overall sample, and generally no greater than ±5% for
individual population segments.
THE SCIENTIFIC
COMMUNITY
IDEOLOGY EDUCATION AGE RACE GENDER
XX 2019 XX 2020
35Segmentation
Shift in the percentage of respondents with a favorable view of aerospace and defense
companies between 2019 and 2020.
The overall response is in the far left column. Breakout by ideology, education, age,
race, and gender in successive columns. Uncertainty is ±2.5% at the 95% confidence
level for data representing the overall sample, and generally no greater than ±5% for
individual population segments.
AEROSPACE AND
DEFENSE COMPANIES
IDEOLOGY EDUCATION AGE RACE GENDER
XX 2019 XX 2020
36Segmentation
Shift in the percentage of respondents with a favorable view of non-profits and
charities between 2019 and 2020.
The overall response is in the far left column. Breakout by ideology, education, age,
race, and gender in successive columns. Uncertainty is ±2.5% at the 95% confidence
level for data representing the overall sample, and generally no greater than ±5% for
individual population segments.
NON-PROFITS AND
CHARITIES
IDEOLOGY EDUCATION AGE RACE GENDER
XX 2019 XX 2020
37Segmentation
Shift in the percentage of respondents with a favorable view of public colleges and
universities between 2019 and 2020.
The overall response is in the far left column. Breakout by ideology, education, age,
race, and gender in successive columns. Uncertainty is ±2.5% at the 95% confidence
level for data representing the overall sample, and generally no greater than ±5% for
individual population segments.
PUBLIC COLLEGES
AND UNIVERSITIES
IDEOLOGY EDUCATION AGE RACE GENDER
XX 2019 XX 2020
38Segmentation
Shift in the percentage of respondents with a favorable view of the U.S. military
between 2019 and 2020.
The overall response is in the far left column. Breakout by ideology, education, age,
race, and gender in successive columns. Uncertainty is ±2.5% at the 95% confidence
level for data representing the overall sample, and generally no greater than ±5% for
individual population segments.
U.S. MILITARY
IDEOLOGY EDUCATION AGE RACE GENDER
XX 2019 XX 2020
39Segmentation
Shift in the percentage of respondents with a favorable view of Ivy League colleges and
universities between 2019 and 2020.
The overall response is in the far left column. Breakout by ideology, education, age,
race, and gender in successive columns. Uncertainty is ±2.5% at the 95% confidence
level for data representing the overall sample, and generally no greater than ±5% for
individual population segments.
IVY LEAGUE COLLEGES
AND UNIVERSITIES
IDEOLOGY EDUCATION AGE RACE GENDER
XX 2019 XX 2020
40Segmentation
Shift in the percentage of respondents with a favorable view of consumer goods
companies between 2019 and 2020.
The overall response is in the far left column. Breakout by ideology, education, age,
race, and gender in successive columns. Uncertainty is ±2.5% at the 95% confidence
level for data representing the overall sample, and generally no greater than ±5% for
individual population segments.
CONSUMER GOODS
COMPANIES
IDEOLOGY EDUCATION AGE RACE GENDER
XX 2019 XX 2020
41Segmentation
Shift in the percentage of respondents with a favorable view of technology companies
between 2019 and 2020.
The overall response is in the far left column. Breakout by ideology, education, age,
race, and gender in successive columns. Uncertainty is ±2.5% at the 95% confidence
level for data representing the overall sample, and generally no greater than ±5% for
individual population segments.
TECHNOLOGY
COMPANIES
IDEOLOGY EDUCATION AGE RACE GENDER
XX 2019 XX 2020
42You can also read