IMPROVED STEWARDSHIP FOR IMPROVED RETURNS - April 2015 www.RestoreMGM.com - SEC.gov
←
→
Page content transcription
If your browser does not render page correctly, please read the page content below

IMPROVED STEWARDSHIP FOR IMPROVED RETURNS
April 2015

                    www.RestoreMGM.com
                     www.LandandBuildings.com
TABLE OF CONTENTS

 I.   Executive Summary
 II. MGM Has Underperformed
 III. MGM’s History of Poor Stewardship
 IV. Land and Buildings’ Suggestions to Create Value
 V. Our Director Nominees
 VI. Directors We Are Opposing
 VII. Appendix

LANDandBUILDINGS                                   1

I. EXECUTIVE SUMMARY

                       2
LANDandBUILDINGS OVERVIEW
Land and Buildings Investment Management, LLC (“Land and Buildings”) is a registered investment manager founded
in 2008 that specializes in publicly traded real estate and real estate related securities
Land and Buildings seeks to deliver attractive risk‐adjusted returns by opportunistically investing in securities of
global real estate and real estate related companies by leveraging off of our investment professionals' deep
experience, research expertise, and industry relationships
We manage a concentrated portfolio based on extensive fundamental research and we aim to maintain and nurture
constructive relationships with our portfolio companies
After initially meeting with MGM Resorts International (“MGM” or the “Company”) in January 2015, we made a
discrete request to MGM for their form of nomination on February 9th
— In early March 2015 we privately nominated candidates for the MGM Board of Directors (the “Board”) and
expressed a desire to work constructively with the Company
— On March 17, 2015, we issued an investor presentation highlighting our belief that the Company is undervalued
and how significant value could be unlocked if the Company pursued, among other things, a REIT structure
• Note that MGM’s share price increased nearly 11% the day of the release of our proposal
— After further discussions in late March, the Board made it clear to us that they had no interest in working
cooperatively with us
— We subsequently retained an independent investment bank, Houlihan Lokey, Inc. (“Houlihan Lokey”), to provide an
independent review of our proposal – and as a result of that review, we have made certain adjustments to our
analysis which are contained in this presentation
After additional analysis and in observing the Company’s responses to our engagement, we have concluded that
the Board requires meaningful change in order to ensure that the Company undertakes a credible review of all
reasonable alternatives to create sustainable shareholder value, including, but not limited to, our proposed REIT
structure
LANDandBUILDINGS 3
OVERVIEW OF MGM
MGM is a leading operator and developer of global integrated resorts,
with its assets principally located in Las Vegas
– The Company owns a 51% stake in MGM China Holdings Limited
2016E EBITDA Breakdown by Market(1)
(“MGM China”) and a 50% stake in CityCenter Holdings LLC
(“CityCenter”)
Jim Murren has served as the Company’s Chairman and CEO since U.S. Regional
December 1, 2008, and has been an executive at MGM since 1998 15%
MGM, in its current form, is the result of a merger between MGM Grand Macau
Inc. and Mirage Resorts, Incorporated in May 2000 13% Las Vegas
71%
– Following that merger, MGM went on to make more acquisitions,
including a merger with Mandalay Resort Group in 2005
In 2004, MGM formed a joint venture to develop a casino in Macau and
the MGM Grand Macau opened in 2007
Also in 2004, MGM announced Project CityCenter
– After numerous mishaps, the project began opening in late 2009
– At a cost of $9.2 billion – more than double the original cost estimate of $4 billion – it was the largest privately
funded construction project in U.S. history
• The Company has since written down 50% of their share of the CityCenter investment
• The CityCenter debacle and other poor investment decisions (see page 30) have prevented the Company from
recovering to its pre‐2008 financial crisis level, while similar gaming companies have recovered and thrived
(1) Note: Represents Land and Buildings 2016 EBITDA estimates; Based on MGM’s pro rata ownership percentage of each asset
LANDandBUILDINGS 4
MGM 20-YEAR TIMELINE

                         $100.00
                                                                                                                                         October 30, 2007
                                                                                                                                 In a Reuters article, Mr. Murren
                               $90.00                                                                                              states that the sale of half of
                                                                                                                                    CityCenter to Dubai World
                                                                                                                               “evaporates” risks for shareholders
                               $80.00

                                                                                                                                     December 5, 2007 – May 31, 2008
                               $70.00
                                                             July 14, 2004 ‐ December 31, 2007                                       MGM repurchases 20 million shares
                                                             MGM repurchases 20 million shares                                         at a total cost of $1.4 billion
    Adjusted Price Per Share

                               $60.00                            at a total cost of $1.1 billion
                                                                                                                                               July 14, 2010
                                                                                                                                 The Veer Towers, the final component of
                               $50.00                                                                                            CityCenter, opens with the project’s final
                                                                                                                                   construction cost totaling $9.2 billion
                                                                      November 9, 2004
                               $40.00                              MGM announces Project                                                    2009‐2010
                                                                      CityCenter with a                                                  MGM issues 211
                                                                     projected cost of $4                                                million shares to
                               $30.00           January 1998                                                June 29, 2006                 increase shares
                                             Jim Murren named       billion, setting grand
                                                                    opening for late 2009                    MGM breaks                 outstanding by 76%
                                              Director and CFO                                                ground on
                               $20.00                                                                         CityCenter
                                                                                                             construction

                               $10.00
                                                                                              December 1, 2008
                                                                                     Jim Murren named Chairman and CEO
                                $0.00
                                    Apr‐95   Apr‐97       Apr‐99        Apr‐01        Apr‐03       Apr‐05        Apr‐07     Apr‐09       Apr‐11         Apr‐13         Apr‐15

Source: Capital IQ (line graph); Company filings (text boxes)

LANDandBUILDINGS                                                                                   5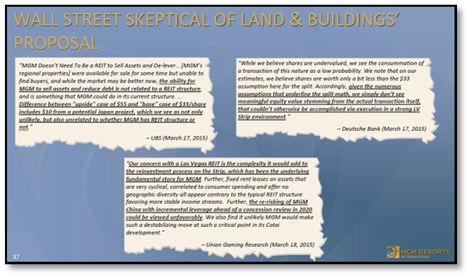
MGM HAS UNDERPERFORMED
MGM has been a perennial underperformer for years, most poignantly indicated in the mere 88% in total shareholder
return (TSR) since the appointment of Jim Murren as Chairman and CEO
– This compares to the TSR peer median of 533% over the same period
When evaluating MGM’s performance, we used two sets of peers: TSR peers and operational peers
– TSR peers relevant public gaming and lodging companies which we believe represent a reasonable proxy for
comparing MGM’s shareholder returns over different periods of time (see Appendix for list of selected peers and
peer group rationale)
– Operational peers are simply Las Vegas Sands Corporation (“Sands”) and Wynn Resorts, Limited (“Wynn”), as these
two companies are most similar to MGM in size, revenue sources, and geographic footprint
From share price, valuation, and operational perspectives, MGM demonstrates consistent poor performance,
including:
Total shareholder return vs. TSR peers over nearly any period
EV/EBITDA valuation metric (the gold standard for valuing MGM and its operational peers)
Net debt/EBITDA
EBITDA margin
Return on invested capital
MGM has consistently underperformed despite its enviable collection of assets
Source: Bloomberg
LANDandBUILDINGS 6
ROOT CAUSES OF MGM UNDERPERFORMANCE
Despite years of underperformance and being on the brink of bankruptcy in 2009, MGM has never adequately
addressed the key reasons for their poor performance and consistently depressed valuation
– The key problems at MGM, which nearly rendered the Company extinct in 2009, are still weighing on the Company
today and have prevented MGM from reaching its considerable potential
– We believe that our suggested proposal would help the Company address what are, in our view, the root causes of
their poor performance and unrelenting undervaluation:
Overlevered Balance Sheet
Subpar Operations
Lack of Capital Allocation Discipline
– Whether or not MGM undertakes our proposed structure, we believe the Company must address these issues
A complacent board has failed to address the issues that have plagued the
Company’s performance for years
LANDandBUILDINGS 7
MGM’S BOARD NEEDS IMPROVED STEWARDSHIP
When we began our engagement with the Company, we fully expected MGM’s management (“Management”) and
Board to consider our input and commit to taking an independent assessment of our proposed structure
– We have, however, discovered that the Company suffers from a broken governance culture which we believe
values self‐preservation over honest inquiry
Lack of Accountability
— MGM has a history of disastrous capital allocation decisions (e.g., CityCenter, Atlantic City), has been a consistent
underperformer, and persistently trades at a depressed valuation – and yet we see no evidence that the Board
has held Management accountable
Dead Hand Proxy Put
— MGM has failed to eliminate its dead hand proxy put provision in one of the Company’s credit agreements and is
facing a lawsuit from one of its shareholders to have the provision removed
Poor Compensation Practices
— The Company has a history of poor compensation practices and its current bonus structure for executives is not
optimally aligned with the interests of shareholders
Response to Shareholder Engagement
— MGM’s response to our proposal has been alarming and is perhaps best illustrated by “Hernandez‐gate”
• Demonstrating their complete resistance to fresh perspectives and accountability, just days after we sent Mr.
Hernandez a letter, Mr. Kincaid was given an ultimatum by Vail Resorts Inc. (“Vail”) – pull out of the Land and
Buildings slate for MGM or resign from the board of Vail
MGM’s response to our engagement speaks volumes about the Company’s
current boardroom culture
LANDandBUILDINGS 8
SUMMARY OF OUR VALUE CREATION SUGGESTIONS
After years of poor performance, we believe MGM needs an invigorated board to explore the numerous available
paths to create sustainable shareholder value
While we continue to believe that pursuing a REIT structure would be an excellent path for creating value for MGM
shareholders, we believe there are numerous additional steps that the Company should candidly explore that could
also create sustained shareholder value
– If elected to the Board, our nominees would work to stem what we view as the culture of complacency on the
current board and undertake an independent review of numerous options, including:
Unlocking Value of Real Estate
Selling Non‐Core Assets
Accomplished with
LANDandBUILDINGS PROPOSAL
Deleveraging the Balance Sheet
Reducing Expenses for Margin Improvement
Improving Capital Allocation
Improving Compensation Structure
The Board would benefit from a credible “everything is on the table” culture
LANDandBUILDINGS 9WHY WE ARE HERE
We first met with Management on January 16, 2015, to discuss why we believe MGM is undervalued and share our
ideas to improve shareholder returns, including exploring a REIT structure
– On March 17, 2015, we issued an investor presentation highlighting our belief that the Company is undervalued
and how significant value could be unlocked if the Company pursued a REIT structure
In April, MGM retained Evercore Group (“Evercore”) to explore a REIT structure, at which point we were contacted
and asked to “stand‐down,” since the Company was now “exploring” our previously described “seriously flawed”
proposal
Given the back‐and‐forth rhetoric thus far, we believe it is helpful to summarize what this election is and is not about,
in our view:
This election is not a vote on our proposed REIT structure – It’s about whether the Board has the
appropriate expertise to effectively evaluate such a structure
This election is not about a special dividend or monetizing MGM China – It’s about the Board’s
historical stewardship and whether they will objectively evaluate opportunities that create value
for shareholders, even if they shrink the size of their influence
This election is not about the historical compensation of executives – It’s about changing the
culture in MGM’s boardroom to ensure that Management’s interests are properly aligned with
shareholders
This election is not about replacing the Company’s CEO – It’s about whether the Board has shown
a willingness to hold Management accountable for MGM’s long‐term underperformance
LANDandBUILDINGS 10LAND AND BUILDINGS’ DIRECTOR NOMINEES
Matthew Hart
– Former President, CFO, and COO of Hilton Hotels Corporation, and former CFO of Host Marriott
Corporation
– Current Director of Air Lease Corporation, American Airlines Group Inc., and American Homes 4 Rent
Richard Kincaid
– Former President and CEO of Equity Office Properties Trust
– Current Chairman of Rayonier Inc. and Director of Dividend Capital Diversified Property Fund Inc.,
and Strategic Hotels & Resorts, Inc.
Jonathan Litt
– Founder and CIO of Land and Buildings
– Current Director at Mack‐Cali Realty Corporation
Marc Weisman
– Former Partner of Weil Gotshal & Manges LLP, and former CFO of Oppenheimer & Co., Inc.
– Former Director of Artesyn Technologies Inc. and SourceHOV, Inc.
Our nominees will seek to refresh the boardroom culture and create an
environment where the best ideas for shareholders prevail
LANDandBUILDINGS 11II. MGM HAS UNDERPERFORMED
12MGM’S SUBSTANTIAL UNDERPERFORMANCE
Table reflects MGM's performance relative to that of its TSR peers over the last 1‐, 3‐ and 5‐year
periods and since Mr. Murren became CEO
Since Mr. Murren
1‐Year 3‐Year 5‐Year became CEO
29.4% 39.2% 5.8% 195.6%
Gaming Peers
8.6% 29.9% 141.8% 1,327.0%
53.6% 30.2% 132.0% 197.3%
65.4% 182.3% 239.2% 563.5%
18.1% 19.3% 72.1% 348.6%
56.7% N/A N/A N/A
Lodging Peers
35.8% 5.8% 2.7% N/A
81.9% 91.6% 166.7% 452.5%
34.0% 23.7% 54.6% 469.9%
TSR Peer Median 35.8% 27.0% 102.1% 452.6%
Source: Bloomberg
Note: As of March 16, 2015 unaffected closing price
LANDandBUILDINGS 131-YEAR UNDERPERFORMANCE
20%
MGM
TSR Peers
10% 10.6%
0%
‐10%
‐20%
25.2%
‐30%
‐40%
Mar‐14 Jun‐14 Sep‐14 Dec‐14
Source: Bloomberg
Note: As of March 16, 2015 unaffected closing price
LANDandBUILDINGS 143-YEAR UNDERPERFORMANCE
100%
MGM
TSR Peers
80%
63.3%
60%
40%
36.3%
20%
0%
‐20%
‐40%
Mar‐12 Jun‐12 Sep‐12 Dec‐12 Mar‐13 Jun‐13 Sep‐13 Dec‐13 Mar‐14 Jun‐14 Sep‐14 Dec‐14 Mar‐15
Source: Bloomberg
Note: As of March 16, 2015 unaffected closing price
LANDandBUILDINGS 155-YEAR UNDERPERFORMANCE
200%
MGM
TSR Peers
175%
161.9%
150%
125%
100%
75%
59.8%
50%
25%
0%
‐25%
Mar‐10 Mar‐11 Mar‐12 Mar‐13 Mar‐14 Mar‐15
Source: Bloomberg
Note: As of March 16, 2015 unaffected closing price
LANDandBUILDINGS 16UNDERPERFORMANCE SINCE MR. MURREN BECAME CEO
600%
“MGM’S BOARD HAS A STRONG TRACK RECORD OF DELIVERING
SUPERIOR VALUE” 538.2%
Letter to Shareholders from the Board, April 13, 2015
500%
MGM
TSR Peers
400%
300%
200%
100% 85.6%
0%
‐100%
Dec‐08 Dec‐09 Dec‐10 Dec‐11 Dec‐12 Dec‐13 Dec‐14
Source: Bloomberg
Note: As of March 16, 2015 unaffected closing price
LANDandBUILDINGS 17MGM IS SIGNIFICANTLY UNDERVALUED
20.0x EV/2015E EBITDA 20.0x EV/2016E EBITDA
18.4x
17.8x
18.0x 18.0x
16.0x 16.0x
14.9x
14.2x
14.0x 14.0x
11.9x
12.0x 12.0x 11.2x
10.0x 10.0x
8.0x 8.0x
Are investors skeptical of MGM’s ability to create value compared
to their operational peers?
Source: JP Morgan, April 2015
Note: For MGM, adjusted enterprise value and EBITDA calculations back out 49.0% stake of MGM Macau and add back MGM’s share of CityCenter and Borgata debt and EBITDA
Note: For Wynn, adjusted enterprise value and EBITDA calculations back out 27.7% stake of Wynn Macau debt and EBITDA
Note: For Sands, adjusted enterprise value and EBITDA calculations back out 29.7% stake of Sands China
LANDandBUILDINGS 18MGM PERSISTENTLY DEPRESSED VALUATION
Annual EV/EBITDA
28.0x
26.0x
Since 2008, MGM’s average EV/EBITDA was 12.4x, compared
24.0x
to 16.4x and 15.0x for Sands and Wynn, respectively
22.0x
20.0x
18.0x
16.0x
14.0x
12.0x
10.0x
8.0x
6.0x
2008 2009 2010 2011 2012 2013 2014 2015E
Source: Deutsche Bank, April 2015
LANDandBUILDINGS 19MGM IS OVERLEVERED RELATIVE TO ITS
OPERATIONAL PEERS
6.0x 2014 Net Debt/EBITDA
5.4x
5.0x
4.0x
3.0x
3.0x
2.0x
1.2x
1.0x
0.0x
The window is open now for MGM to repay a substantial amount of its debt
Source: JP Morgan, April 2015
Note: For MGM, adjusted net debt and EBITDA calculations back out 49.0% stake of MGM Macau and add back MGM’s share of CityCenter and Borgata debt and EBITDA
Note: For Wynn, adjusted net debt and EBITDA calculations back out 27.7% stake of Wynn Macau debt and EBITDA
Note: For Sands, adjusted net debt and EBITDA calculations back out 29.7% stake of Sands China
LANDandBUILDINGS 20THE COMPANY REMAINS OVERLEVERED
$12,800
Consolidated Net Debt “And now we have two major
$12,600
holding companies, holding
$12,515.9
operating companies – Caesars
$12,400
and MGM, both of which have
$12,200
$12,089.3
significant debt and they don't
have a big way to pay them
$12,000
$11,875.5 off…the sucking sound that we
$11,800
$11,643.3
hear is their room pricing and
$11,600 $11,548.7
$11,604.3
trying to reduce the – trying to
$11,465.0
fill up their properties so they
$11,400
could do something to help pay
$11,200 off their excessive debt.”
$11,000 ‐ Sheldon Gary Adelson, Chairman, CEO of Sands
2010 2011 2012 2013 2014 2015E 2016E LVS Q2 2013 Earnings Call , July 24, 2013 (emphasis added)
We believe MGM’s debt load relative to its operational peers is one of the key
reasons that the Company’s stock has remained depressed
Source: JP Morgan, February 2015
LANDandBUILDINGS 21IS MGM OVEREXTENDING ITSELF AGAIN?
$3,000
CapEx “And while we now
stand on far more solid
Cash from Operations
$2,500
Free Cash
$2,000 ground, 2009 still
$1,500 served as a wake-up
$1,000
call…. As a Company,
$500
we begin every day
with a new lease on
$0
Why is cash flow going life and a keen sense of
optimism, armed with
‐$500 negative again?
‐$1,000 We believe that negative free cash
flow demonstrated MGM’s lack of the lessons of the
past.”
capital allocation discipline which
‐$1,500
largely contributed to the Company’s
downturn in late 2007
‐$2,000 ‐ Jim Murren, Chairman & CEO of MGM
2003 2004 2005 2006 2007 2008 2009 2010 2011 2012 2013 2014 2015E MGM 2009 Annual Report (emphasis added)
Did MGM really learn from its past?
Source: Capital IQ
Note: Consolidated historical and estimated financials
LANDandBUILDINGS 22MGM’S LAS VEGAS PROPERTIES HAVE LAGGED IN
MOST YEARS SINCE MR. MURREN BECAME CEO
Despite holding several of the top properties on the Las Vegas strip, MGM has been unable to surpass the operating
efficiency of Wynn and Sands during most years
– Since 2008, MGM’s average EBITDA margin of their Las Vegas Strip properties was 23.5% compared with 24.6% and
26.2% for Sands and Wynn, respectively
EBITDA Margin of Las Vegas Strip Properties
33%
31.5%
30.8%
31%
29.4% 29.7%
29% 28.2%
27.5%
27%
25.8%
25.2%
25% 24.1% 24.3%
23.9%
23.6%
23.0% 23.2% 23.2%
23% 22.0% 22.1%
21.2%
20.9%
21% 20.4%
19.8%
19%
17%
15%
2008 2009 2010 2011 2012 2013 2014
MGM Sands Wynn
Source: JP Morgan, February 2015
Note: Las Vegas consolidated assets for each company
LANDandBUILDINGS 23CONSOLIDATED LTM EBITDA MARGIN
LTM EBITDA Margin
40
35
30
25
20
Employees LTM Revenue Revenue/Employee
15 Sands 48,500 $14,584,000,000 $300,701
Wynn 16,500 5,434,000,000 329,333
MGM 68,100 9,699,000,000 142,422
10
Dec‐08 Dec‐09 Dec‐10 Dec‐11 Dec‐12 Dec‐13 Dec‐14
We believe MGM has excess costs which could be taken out to improve margins
Source: FactSet
Note: Consolidated historical financials
LANDandBUILDINGS 24INCONSISTENT FLOW-THROUGH
90% Percentage of Revenue Flow‐Through to EBITDA
80%
“50% [flow-through] is still a pretty
good benchmark.”
70%
‐ Jim Murren, Chairman & CEO of MGM
Q4 2014 Earnings Call, February 17, 2015
60%
50%
40%
30%
20%
10%
0%
2011 2012 2013 2014
MGM has been inconsistent in converting revenues into EBITDA
Source: JP Morgan, February 2015
Note: Only inclusive of MGM’s Las Vegas consolidated properties
Note: Flow‐through defined as incremental EBITDA divided by incremental revenue
LANDandBUILDINGS 25RETURN ON INVESTED CAPITAL
22%
2014 Return on Invested Capital
20.0%
20%
18%
15.8%
16%
14%
12%
10%
8%
6%
4%
1.9%
2%
0%
Las Vegas Sands Wynn MGM
Source: Bloomberg
Note: Calculated using consolidated financials
Note: Return on invested capital defined as net operating profit after tax divided by average invested capital
LANDandBUILDINGS 26III. MGM’S HISTORY OF POOR STEWARDSHIP
27LACK OF ACCOUNTABILITY
Since Jim Murren became CEO in 2008, MGM has become one of the worst
performing companies in the U.S. Consumer Discretionary Index
U.S. Consumer
Discretionary
Index
1,412% 281% 283% 434% 649% 248% 88%
Is the Board fully aware of this track record
of underperformance?
If so, how does the Board explain its
continued support of Management?
We question whether the Board has provided sufficient oversight of its CEO and
has failed to appreciate the Company’s underperformance
Source: Bloomberg
Note: As of March 16, 2015 unaffected closing price
LANDandBUILDINGS 28LACK OF ACCOUNTABILITY (CONT.)
Since Jim Murren became CEO in 2008, MGM has recorded more
than $4.5 billion in impairment charges, more than a third of the Company’s current market cap
“In 2009, we recorded non-cash impairment charges of $176 million related to our M Resort note, $956 million related
to our investment in CityCenter, $203 million related to our share of the CityCenter residential impairment, and $548
million related to our land holdings on Renaissance Pointe in Atlantic City and capitalized development costs related to
our MGM Grand Atlantic City Project”
“2010, we recorded non-cash impairment charges of $1.3 billion related to our investment in CityCenter, $166 million
related to our share of the CityCenter residential real estate impairment, and $128 million related to our Borgata
investment”
“In 2011, we recorded non-cash impairment charges of $26 million related to our share of the CityCenter residential real
estate impairment, $80 million related to Circus Circus Reno, $23 million related to our investment in Silver Legacy
and $62 million related to our investment in Borgata”
“In 2012, we recorded non-cash impairment charges of $85 million related to our investment in Grand Victoria, $65
million related to our investment in Borgata, $366 million related to our land on the north end of the Las Vegas Strip,
$167 million related to our Atlantic City land and $47 million for the South Jersey Transportation Authority special
revenue bonds we hold”
“In 2012, we recorded $18 million related to our share of the CityCenter residential real estate impairment charge and
$16 million related to our share of CityCenter’s Harmon demolition costs”
“In 2013, we recorded non-cash impairment charges of $37 million related to our investment in Grand Victoria, $20
million related to our land in Jean and Sloan, Nevada, and $45 million related to corporate buildings expected to be
removed from service”
“In 2014, we recorded a non-cash impairment charge of $29 million related to our investment in Grand Victoria”
Source: Company filings (emphasis added)
LANDandBUILDINGS 29LACK OF ACCOUNTABILITY (CONT.)
MGM has a dreadful track record of capital allocation decisions, in our view
Buying back shares near their highs
– In 2006, the Company repurchased 6.5 million shares for a total of $247 million at an average cost
of $37.98 per share
– In 2007, the Company repurchased 9.9 million shares for a total of $827 million at an average cost
of $83.92 per share
– In 2008, the Company repurchased 18.2 million shares for a total of $1.2 billion at an average cost
of $68.36 per share
Shareholder dilution near their lows
– The Company expanded share count by 76% at an average price of $8.26
– On May 13, 2009, the Company issued 164.4 million shares at $7.00 per share raising $1.2 billion
– On October 13, 2015, the Company issued 47.0 million shares at $12.65 per share raising $595
million
Ill‐fated development projects
– CityCenter debacle ($2.5 billion in impairments – or 50% of their investment)
– Atlantic City development plans abandoned ($715 million in impairments)
– MGM Springfield ($800 million of expected investment – will there be impairments here too?)
The $4.5 billion in impairments since 2009 represents over one third of MGM’s
current equity market cap
Source: Company filings
LANDandBUILDINGS 30LACK OF ACCOUNTABILITY (CONT.)
In a recent investor presentation, MGM took no ownership for its • MGM uses a March
2009 date – when the
historical underperformance and, in fact, asserts that the Company Company was nearly
has an excellent track record compared to its gaming peers bankrupt – to boast
about its
performance
• Why did MGM “stop
the clock” on
performance as of
2014?
• What about
hospitality peers?
• 70% of MGM’s Las
Vegas revenue is non‐
gaming
• CZR has declared
bankruptcy, but MGM
includes it as a
performance peer
Source: Company presentation released April 27, 2015
Does anyone really think MGM has a “superior” track record?
LANDandBUILDINGS 31THE “CITYCENTER DISASTER”
June 30, 2010
November 9, 2004 November 15, 2007 MGM reviews the
MGM announces MGM announces November 5, 2009 carrying value of
Project CityCenter 50/50 joint venture January 7, 2009 MGM announces its CityCenter
at an estimated with Dubai World, a Construction errors $1.3 billion of investment and
cost of $4 billion, government are discovered at impairment realizes an
setting grand investment fund of February 2008 the Harmon Tower charges related to additional
opening for late Dubai, to develop Budget increases which eventually CityCenter impairment loss of
2009 CityCenter to 8.7 billion must be dismantled investment $1.1 billion
2004 2005 2006 2007 2008 2009 2010
August 2005 October 2007 March 23, 2009 December 16, 2009 July 14, 2010
As preliminary Budget revised to Dubai World sues MGM CityCenter, including The Veer Towers, the final
construction gets $7.8 billion because for project cost overruns, the Vdara, Aria, component of CityCenter,
underway, MGM some of the designs citing that it had to make Mandarin Oriental opens. The project’s final
announces a $5 are more complex “capital contributions far and the Crystals construction cost totals
billion budget than expected in excess” of original sections, officially $9.2 billion, about 2.3x
estimates opens the original budget
Has anyone been held accountable for the CityCenter debacle?
Source: Company filings
LANDandBUILDINGS 32THE “CITYCENTER DISASTER” (CONT.)
$10
Projected Cost of CityCenter When CityCenter was initially announced, the
Company estimated the project would cost $4 billion
$9
– MGM went “all‐in” and expanded the scale and
$8
scope of the project, in our view, like a compulsive
$7 gambler who never thought its luck would run out
$6 – When completed, CityCenter wound up costing
$ in billions
more than $9 billion, or more than 2.3x the original
$5
estimated cost
$4
MGM has written off more than 50% of its original
$3 investment
$2
$1
$0
2004 2005 2006 2007 2008 2009
“Musing on the CityCenter debacle, [Jim Murren] refuses to call it a failure. ‘A, it was
finished; B, it employs 10,000 people; and C, we didn’t file Chapter 11,’ he says….”
‐ Daniel Fisher, Forbes
Forbes, November 16, 2011
Source: Company filings
LANDandBUILDINGS 33THE “CITYCENTER DISASTER” (CONT.)
$30,000
Market Capitalization
$28,492
$25,000
$20,000
$ in millions
$15,000
$10,000 From 2007 through 2008
MGM lost more than
$5,000 $24 billion in market value $3,805
$0
Dec‐06 Jun‐07 Dec‐07 Jun‐08 Dec‐08
The deconstruction of the Harmon Hotel(1)
“And really despite the economic turmoil that we've seen, we remain ever more confident that…
CityCenter will be not only an extraordinarily profitable enterprise for our company and our partner,
but it has obviously forever changed the dynamic here in Las Vegas and the competitiveness of our
company.”
‐ Jim Murren, Chairman & CEO of MGM
Q4 2009 Earnings Call, February 18, 2010 (emphasis added)
Source: FactSet
(1) myarchpassion.wordpress.com
LANDandBUILDINGS 345-YEARS OF PROMISING “RECOVERY”
“We are very encouraged that the meeting planners, who seemed invisible for the first part of the year, are now being much more active and
we're seeing signs of a recovery in their business, which therefore translates into business into Las Vegas.”
Q2 2009 Earnings Call, August 3, 2009 (emphasis added)
“And so as our revenues are recovering here, you're seeing an impact on our margins and that is why we believe that this company's margins
when the recovery in the economy is complete, will be higher than they were even during the hay days of the early part of this decade.”
Q3 2009 Earnings Call, November 5, 2009 (emphasis added)
“And we've become a more efficient company through this great recession, and we believe we're better positioned than most to benefit from
the market recovery.”
Q1 2010 Earnings Call, May 6, 2010 (emphasis added)
“The Las Vegas recovery seems to be well underway here.”
Q2 2010 Earnings Call, August 3, 2010 (emphasis added)
“As the recovery is underway, we're seeing organic growth in FIT and in Leisure business allowing us to drive rates.”
Q1 2011 Earnings Call, May 4, 2011 (emphasis added)
“This combined with very positive forward trends that we're currently seeing leads us to believe that the signs of the recovery here in Las
Vegas is consistent….”
Q2 2011 Earnings Call, August 8, 2011 (emphasis added)
“I think we've positioned ourselves to fully take advantage of the Las Vegas recovery that is clearly underway.”
Q3 2011 Earnings Call, November 3, 2011 (emphasis added)
“I think that all points to the fact that Las Vegas will have in general, not just ourselves, but the market will have a much better year in 2012
because the recovery of revenue is more broad based than it was last year and everyone including ourselves are managing our costs.”
Q4 2011 Earnings Call, February 22, 2012 (emphasis added)
“Again this reports our thesis of a broadening recovery in Las Vegas.”
Q1 2012 Earnings Call, May 3, 2012 (emphasis added)
“Now, the third quarter did present tough comparisons in Las Vegas, however, we do continue to see indications of a recovery here.”
Q3 2012 Earnings Call, October 31, 2012 (emphasis added)
“Visitation to Las Vegas remained strong and macro trends are improving here helping to drive the recovery.”
Q1 2013 Earnings Call, May 2, 2013 (emphasis added)
LANDandBUILDINGS 355-YEARS OF PROMISING “RECOVERY” (CONT.)
“Clearly, we see here in Las Vegas a continuation of the recovery.”
Q2 2013 Earnings Call, August 6, 2013 (emphasis added)
“And that is why we believe we're separating from the pack as the best positioned company to benefit on the recovering corporate and
convention business in Las Vegas.”
Q1 2014 Earnings Call, April 29, 2014 (emphasis added)
“We are seeing a more unified recovery as luxury Strip properties grew EBITDA 13% and our combined mid‐tier and value resorts increased by
some 8%.”
Q2 2014 Earnings Call, August 5, 2014 (emphasis added)
“So we think that if the Las Vegas visitation continues to grow, even in the low single‐digit rate and that the city‐wide convention business
steadily recovers to its post‐recession level.”
Q3 2014 Earnings Call, October 30, 2014 (emphasis added)
2009‐2015 Las Vegas Recovery
1500%
When will MGM “recover” like their closest peers?
1300%
Total Shareholder Return
1100%
900%
920.3%
700%
500%
300% 328.1%
100%
‐100% 42.9%
Jan‐09 Jul‐09 Jan‐10 Jul‐10 Jan‐11 Jul‐11 Jan‐12 Jul‐12 Jan‐13 Jul‐13 Jan‐14 Jul‐14 Jan‐15
Source: Bloomberg
Note: As of March 16, 2015 unaffected closing price
LANDandBUILDINGS 36“I’m sending a message. You ought to get my
message. I haven’t sold any stock. I’ve got
432mm shares and I haven’t sold one share of
stock since 2006 when I did the secondary to
create some diversification. I haven’t sold any,
I have no intention of selling any, and I
believe in the long-term improvement of this
company.”
– Sheldon Gary Adelson, Chairman, CEO of Sands
Sands Q4 2014 Earnings Call , January 28, 2015 (emphasis added)
Is Mr. Murren sending the same message to shareholders?
37CHAIRMAN AND CEO SOLD $12 MILLION OF STOCK
DURING THE LAST 24 MONTHS OF “RECOVERY”
$30.00
March 3, 2014
Sold 10,675 shares October 7, 2014
$28.00
for $295,343 Sold 4,459 shares
September 10, 2013 for $97,206
$26.00
Sold 150,000 shares
for $2,859,090
$24.00
$22.00 May 13, 2013 May 1, 2014
Price Per Share
Sold 250,000 shares Sold 187,500 shares
$20.00 for $3,937,221 for $4,725,535
$18.00
October 3, 2014
November 5, 2013 November 5, 2014
Sold 7,342 shares
$16.00 Sold 8,765 shares for $162,478 Sold 8,765 shares
for $167,850 for $190,376
$14.00
October 3, 2013
$12.00 Sold 7,342 shares
for $151,090
$10.00
Mar‐13 Jun‐13 Sep‐13 Dec‐13 Mar‐14 Jun‐14 Sep‐14 Dec‐14 Mar‐15
Mr. Murren has never acquired MGM shares on the open market
Source: Capital IQ (line graph); FactSet (text boxes)
LANDandBUILDINGS 38MGM’S COMPENSATION METRICS
MGM uses EBITDA as the primary component to evaluate Chairman and CEO Jim Murren’s annual incentive payment
– The pursuit of EBITDA could cloud certain decision making on behalf of Management to the detriment of
shareholders
$2,350 From 2010‐2011, the Board 2012‐2013 Board reduces
EBITDA Target incentive metric $2,230 $2,246
increased the EBITDA target by ~1%;
EBITDA Actual
$2,150 however, in 2011 the Company $2,094
began consolidating MGM China’s $1,977 $1,968
$1,950 EBITDA, which accounted for $360
million of EBITDA
$1,752
EBITDA ($ in millions)
$1,750
$1,575
$1,550 $1,487 $1,512
$1,400
$1,350
$1,232
$1,150 $1,083
2011‐2014: Average EBITDA increase: 16%
$950 Average EBITDA Goal Increase: 8%
IS THE BOARD SETTING “CHALLENGING GOALS”?
$750
2009 2010 2011 2012 2013 2014
CEO
Compensation:
Despite inconsistent results, Mr. Murren’s pay has been remarkably consistent
Source: Company filings
LANDandBUILDINGS 39MGM’S “D” GRADE COMPENSATION
$14,000,000 $13,752,443 140%
$12,000,000 $10,991,426 120%
$9,775,903 $9,933,557 $9,641,477 $10,183,159
CEO Compensation
Total Shareholder Return
$10,000,000 100%
$8,000,000 80%
$6,000,000 60%
$4,000,000 40%
$2,000,000 20%
$0 0%
‐$2,000,000 ‐20%
‐$4,000,000 ‐40%
2009 2010 2011 2012 2013 2014
Pay $13,752,443 $9,775,903 $9,933,557 $9,641,477 $10,991,426 $10,183,159
TSR ‐33.70% 62.80% ‐29.80% 9.60% 102.50% ‐8.80%
“The Company has been deficient in linking executive pay to corporate performance, as indicated by
the ‘D’ grade received by the Company in Glass Lewis' pay-for-performance model. A properly
structured pay program should motivate executives to drive corporate performance, thus aligning
executive and long-term shareholder interests. In this case, the Company has not implemented such
a program. Furthermore, we note that the Company received pay-for-performance grades of ‘D’ in
both our 2013 and 2012 Proxy Papers. In our view, shareholders should be deeply concerned with
the compensation committee's sustained failure in this area.”
Glass Lewis, MGM 2014 Proxy Paper report (emphasis added)
Source: Company filings (CEO compensation); FactSet (TSR)
LANDandBUILDINGS 40CORPORATE JET USAGE
MGM has a fleet of luxury jets on standby to fly high‐rollers and MGM directors and
management around the world on demand
C o n f id e n t ial D r a ft – D o N o t D u p lic at e o r D i s t r ibu t e – v2 3
2014 Personal Usage of MGM Aircraft
Alexis Herman Rose McKinney‐James Jim Murren
$18,462 $4,477 $212,417
• N720MM Boeing 737‐7ET
• N721MM Gulfstream G‐550
• N722MM Gulfstream G‐350
• N723MM Gulfstream G‐350
• N725MM Gulfstream G‐550
• N728MM Gulfstream G‐450
“Pursuant to his employment agreement, Mr. Murren is entitled to request the personal use of
aircraft, but he must generally reimburse us for costs associated with such use to the extent the
value of such use (as computed under SEC rules) exceeds $250,000.”
2014 MGM Proxy Statement
Source: Company filings (table); flightaware.com (list of aircraft)
LANDandBUILDINGS 41RECENT DEAD HAND PROXY PUT PROVISION IS AN
EGREGIOUS ENTRENCHMENT TECHNIQUE, IN OUR VIEW
MGM implemented a dead hand proxy put provision in the Company’s credit
agreement on December 20, 2012 (the "Debt Agreement")(1)
– The proxy put is a provision in the Debt Agreement that states, if a majority of
the Board is replaced from an actual or threatened proxy contest or consent
solicitation within a 24‐month period, it would be considered an “event of
default,” and the debt could be immediately required to be pre‐paid in full
– As the Company has noted, in the event it defaults under the Debt Agreement,
it "could trigger cross defaults under other agreements governing our long‐
term indebtedness”
– Potentially coercing shareholders into voting for their incumbent nominees in
this fashion, in our view, represents a complete and utter lack of respect for the
shareholder franchise and a blatant example of entrenchment
MGM is currently facing a lawsuit from one of its shareholders, the Pontiac
General Employees Retirement System (“Pontiac”), who is demanding that MGM
remove this provision(2)
– In spite of repeated empty promises, MGM has failed to remove this provision
– Pontiac asserts in its suit that "[t]he Board breached their fiduciary duties by “Why should credit providers be
approving and maintaining the dead hand proxy put, which serves no protected from a mere turnover of
identifiable purpose other than to entrench the incumbent Board" independent directors? Can’t
creditors adequately protect
The Delaware Chancery Court has repeatedly criticized proxy puts, noting that
they “highlight the troubling reality that corporations and their counsel
themselves with other debt
routinely negotiate contract terms that may, in some circumstances, impinge on covenants (e.g., minimum ratings,
the free exercise of the stockholder franchise”(3) coverage ratios, etc.)?”
(1) Source: Company filings ISS M&A Edge Report “AMLN ‐ The Poison Put Defense”, March 31, 2009
(2) Source: Pontiac General Employees Retirement System v. Baldwin, Bible, et al (Del. Ch. 2014) (emphasis added)
(3) Source: San Antonio Fire & Police Pension Fund v. Amylin Pharmaceuticals, Inc., 983 A.2d 304, 319 (Del. Ch. 2009) (emphasis added)
LANDandBUILDINGS 42MGM’S IMPULSIVE REACTIONS TO OUR ENGAGEMENT
ONLY FURTHER OUR CONCERNS
Since the start of our engagement with MGM, a number of things have happened
that only increased our conviction that the current Board is entrenched and would
benefit from a rejuvenated culture
Moving the Annual Meeting date up from its historical
dates to limit the impact of our engagement
“Hernandez‐gate”
Announcing the retention of an investment bank to
evaluate a REIT structure, but simultaneously pre‐judging
our proposed REIT structure as “seriously flawed”
LANDandBUILDINGS 43LAND AND BUILDINGS – MGM TIMELINE
$24.00 March 20
April 9
February 20 MGM files preliminary proxy, which
MGM discloses
Representatives of excluded Land and Buildings’ four
$400 million
Land and Buildings independent director nominees
CityCenter
$23.00 again meet with special dividend
Management
$22.00 February 17
Mr. Murren appears on CNBC, where
he states that MGM is willing to
consider a REIT
Price Per Share
$21.00
March 2
Land and Buildings
provides notice of April 8
intention to nominate Land and Buildings director
$20.00 four independent nominee resigns from the
directors to the Board board of Vail, for which MGM
Lead Independent Director
Roland Hernandez also serves
as Lead Independent Director
$19.00
January 16 February 9 March 17
Representatives of Land and Buildings Land and Buildings releases
Land and Buildings investor presentation April 20
requested the form of
meet with highlighting what they believed MGM announces the retention
$18.00 nomination
Management, to be the opportunity in the of Evercore to review strategic
including Mr. Murren Company – MGM’s share price options, including Land and
closes 10.6% higher Buildings’ so‐called “flawed
proposal”
$17.00
2‐Jan 12‐Jan 22‐Jan 1‐Feb 11‐Feb 21‐Feb 3‐Mar 13‐Mar 23‐Mar 2‐Apr 12‐Apr 22‐Apr
Source: Capital IQ (line graph); Company filings (April 8 and 20 text boxes)
LANDandBUILDINGS 44THE BOARD ACCELERATED THE RECORD DATE AND
MEETING DATE
Moving the record date up by 10 days limits the likelihood that new shareholders who believe
change is necessary will be able to vote their shares at the annual meeting
Record Date
April 17 April 21
March 30 April 10 2013 2011
2015 2014
2012 2010
“We intend to hold our 2015 annual meeting of stockholders in June 2015.”
MGM 2014 Proxy Statement (emphasis added)
Annual Meeting Date
June 12 June 14
May 28 June 5 2013 2011
2015 2014
2012 2010
June 15
This year, the Board accelerated both the record date and the meeting date
materially from their historical dates in what we believe was an effort to limit
the full impact of shareholder democracy following our nominations
Source: Company filings
LANDandBUILDINGS 45“HERNANDEZ-GATE”
■ MGM’s Lead Independent Director, Roland Hernandez, is also the Lead Independent Director of Vail, where he and
one of our nominees, Richard Kincaid, had jointly sat on the board for eight years
— Just days after we sent Mr. Hernandez a letter, Mr. Kincaid was given an ultimatum by Vail – pull out of the Land
and Buildings slate for MGM or resign from the board of Vail
“Shortly after Mr. Litt’s Land & Buildings
Richard Kincaid had been on the Vail Investment Management LLC nominated Mr.
board since 2006, and his average Kincaid and three others to the casino company’s
support at Vail shareholder meetings board, Mr. Kincaid found himself in the cross hairs
was 94%(1) of Vail directors, including Mr. Hernandez and Chief
Executive Officer Robert Katz, according to the
people. He was uninvited from a scheduled three‐
Roland Hernandez has been on the day retreat for Vail directors and soon advised that
Vail board since 2002, and his he should either give up his MGM campaign or
average support at Vail shareholder resign from Vail, the people said.”
meetings was 86% (1)
46
April 17, 2015
(1) Source: Institutional Shareholder Services; Note: Average support of shares outstanding at all shareholder meetings for which Mr. Kincaid and Mr. Hernandez were on the Vail board
LANDandBUILDINGS 46HIRING A NEW ADVISOR AS WINDOW DRESSING, IN
OUR VIEW
On April 20, 2015, MGM announced that they had retained Evercore to evaluate a potential REIT structure;
however, we greatly discount the veracity of this action, as this announcement was paired with the release of a
presentation containing anti‐REIT rhetoric suggesting that the Company was pre‐judging any analysis
– MGM characterized our proposed REIT structure as “seriously flawed”
– MGM also failed to establish a timeline for the evaluation or to form a special committee of independent
directors to receive and evaluate Evercore’s work
– Furthermore, in its most recent investor presentation, MGM clings to select sell‐side research reports which
question any REIT structure
IS THIS THE
LANGUAGE OF
A COMPANY
SERIOUSLY
CONSIDERING
A REIT
STRUCTURE?
Source: MGM presentation released April 20, 2015
LANDandBUILDINGS 47MGM IS MISSING THE POINT OF OUR CAMPAIGN
Rather than present its own ideas on how MGM can fulfill its potential, the Company is instead spending shareholder
money in an attempt to discredit our proposal
– We note that MGM’s stock went up nearly 11% on the day our proposal was made public – so it would seem that
many MGM shareholders found merit to our proposal
– As we are only seeking a minority position on the Board, any idea our nominees put forward for consideration
would have to be approved by remaining directors that it was an appropriate initiative
• Three of our four director nominees have no allegiance to our firm – nor our REIT proposal – and while our
nominees agree that our proposal merits serious consideration, none of these nominees have “signed off” on our
proposal
The vote at MGM is about stewardship – creating a board that
credibly evaluates ideas and holds management accountable
Source: MGM presentation released April 27, 2015
LANDandBUILDINGS 48IV. LAND AND BUILDINGS’ SUGGESTIONS TO CREATE VALUE
49SUMMARY OF OUR VALUE CREATION SUGGESTIONS
After years of poor performance, we believe MGM needs an invigorated board to explore the numerous available
paths to create sustainable shareholder value
While we continue to believe that pursuing a REIT structure would be an excellent path for creating value for MGM
shareholders, we believe there are numerous additional steps that the Company should candidly explore that could
also create sustained shareholder value
– If elected to the Board, our nominees would work to stem what we view as the culture of complacency on the
current board and undertake an independent review of numerous options, including:
Unlocking Value of Real Estate
Selling Non‐Core Assets
Accomplished with
LANDandBUILDINGS PROPOSAL
Deleveraging the Balance Sheet
Reducing Expenses for Margin Improvement
Improving Capital Allocation
Improving Compensation Structure
The Board would benefit from a credible “everything is on the table” culture
LANDandBUILDINGS 50IDEAL TIME TO TAKE ACTION
After meeting with us, but prior to any announcement of our public involvement, Jim Murren suggested on national
television that the Company might explore a REIT structure(1)
– We believe that Mr. Murren’s assertion that the Company could explore a REIT structure lacks credibility, and his
statements were nothing more than an attempt to pacify shareholders who believe that the REIT structure should
be independently evaluated during this window of opportunity to potentially permanently revalue MGM’s assets
at higher levels
There are numerous factors that make now an ideal time for MGM to explore our proposed structure:
Poor Performance
— MGM and its board should no longer get the benefit of the doubt that they will create sustainable shareholder
value, and given its track record, the Company owes it to shareholders to explore a full range of possible
structures
Las Vegas Fundamentals
— Limited new construction benefits MGM’s premier position, and all relevant metrics indicate cycle “sweet‐spot”
REITs
— REITs have a demonstrated track record of outperformance versus the S&P 500 Index
— A REIT structure would create capital spending discipline
— Two other gaming companies have either implemented a REIT structure or have publicly committed to the
structure, and in each of these situations, tremendous value was created for shareholders
Debt Repayment
— A significant portion of MGM’s debt matures over the next few years and can be retired with limited costs
Taxes
— MGM will become a tax‐payer in 2015 which a REIT structure can help minimize
(1) Source: http://video.cnbc.com/gallery/?video=3000354393
LANDandBUILDINGS 51IDEAL TIME: POOR PERFORMANCE
1‐Year TSR vs. TSR Peers 100% 3‐Year TSR vs. TSR Peers
20%
80%
10%
60%
0%
40%
‐10%
20%
‐20%
0%
‐30% ‐20%
‐40% ‐40%
Mar‐14 Jun‐14 Sep‐14 Dec‐14 Mar‐12 Sep‐12 Mar‐13 Sep‐13 Mar‐14 Sep‐14 Mar‐15
5‐Year TSR vs. TSR Peers 600% TSR since Jim Murren became CEO vs. TSR Peers
200%
175% 500%
150%
400%
125%
300%
100%
75% 200%
50%
100%
25%
0%
0%
‐25% ‐100%
Mar‐10 Mar‐11 Mar‐12 Mar‐13 Mar‐14 Mar‐15 Dec‐08 Dec‐09 Dec‐10 Dec‐11 Dec‐12 Dec‐13 Dec‐14
MGM’s historical underperformance should motivate the Board to take action
Source: Bloomberg; Note: As of March 16, 2015 unaffected closing price
LANDandBUILDINGS 52IDEAL TIME: LAS VEGAS FUNDEMENTALS
$120
Las Vegas ADR 88%
Las Vegas Occupancy Rates
87%
$115
86%
$110
85%
$105 84%
83%
$100
82%
$95
81%
$90 80%
2009 2010 2011 2012 2013 2014 2009 2010 2011 2012 2013 2014
$105
Las Vegas RevPAR “The ‘Las Vegas recovery’ thesis is clearly
$100
building momentum; 2014 saw the highest
visitation growth in Vegas (+4%) since the
$95
recovery started in 2011 and airline seat capacity
$90 into the market in 1H15 will be the highest since
$85 2011. MGM's 2014 LV revenue was still ~20%
$80 below peak (EBITDA 40% below peak).”
$75
2009 2010 2011 2012 2013 2014 Morgan Stanley, March 18, 2015
We believe now is an ideal time to capitalize on Las Vegas’ momentum
Source: Las Vegas Convention and Visitors Authority; Note: ADR refers to average daily rate and RevPAR refers to revenue per available room
LANDandBUILDINGS 53IDEAL TIME: REIT FUNDEMENTALS
We believe REIT investors would welcome a high‐quality, Las Vegas‐focused lodging REIT
Las Vegas is the largest hotel market in the U.S. by a significant margin, and public REIT investors currently have no
way to obtain exposure to this market
An MGM REIT would be a meaningful weight in the REIT Index and would be a must‐own company, in our view, given
its size and strong fundamentals
Public Lodging REIT Room Count Exposure to 10 Largest U.S. Hotel Markets
Room
Count BEE DRH HST SHO LHO PEB FCH RLJ Average
Las Vegas 169,100 0% 0% 0% 0% 0% 0% 0% 0% 0%
Orlando 119,800 0% 4% 3% 6% 0% 0% 5% 0% 2%
Chicago 108,700 21% 14% 5% 10% 10% 0% 2% 12% 9%
Washington D.C. 106,200 3% 6% 10% 10% 16% 7% 0% 5% 7%
New York 106,000 4% 15% 12% 8% 11% 13% 2% 7% 9%
Los Angeles 97,200 5% 9% 3% 11% 7% 12% 7% 2% 7%
Atlanta 93,900 0% 3% 4% 0% 0% 6% 5% 2% 3%
Dallas 78,200 0% 5% 0% 0% 0% 0% 4% 2% 1%
Houston 74,700 0% 0% 3% 7% 0% 0% 2% 5% 2%
Phoenix 62,100 9% 0% 2% 0% 0% 0% 2% 0% 2%
Source: Green Street Advisors
LANDandBUILDINGS 54IDEAL TIME: REITS ARE PROVEN OUTPERFORMERS
900 S&P 500 REITs vs. S&P 500 Index 884.6
40%
Annual Returns
REITs
800 30%
Since 1994, REITs have outperformed
700
the S&P 500 Index by 230% 654.8 20%
600
10%
500
0%
400
‐10%
300
‐20%
200
100 ‐30%
MSCI US REIT Index
S&P 500 Index
0 ‐40%
1995
1996
1997
1998
1999
2000
2001
2002
2003
2004
2005
2006
2007
2008
2009
2010
2011
2012
2013
2014
1994
1995
1996
1997
1998
1999
2000
2001
2002
2003
2004
2005
2006
2007
2008
2009
2010
2011
2012
2013
2014
The REIT universe is large – over $800 billion equity market cap – and spreading to more sectors
There are 22 REITs in the S&P 500 Index
REITs have far outpaced the S&P 500 Index over the last 20 years and, on an
annual basis, outperformed the S&P 500 Index in 13 of the last 20 years
Source: Bloomberg (graphs); NAREIT (market cap of REITs)
LANDandBUILDINGS 55IDEAL TIME: REITS’ SUSTAINABLE PERFORMANCE
REITs have historically performed well in a variety of
environments, including rising interest rates and after Fed
tightening begins
REIT Average Returns Strong at Start of Fed Tightening
40%
S&P 500 Index
35%
35% REITs
30%
Average Returns
25%
20%
16%
15% 13%
10%
6%
5%
0%
1 Year After Fed Tightening Begins 2 Years After Fed Tightening Begins
Source: Bloomberg
Note: Data analyzed is after the first interest rate increase in the 1994, 1999, and 2004 Fed tightening cycles
LANDandBUILDINGS 56CASE STUDY: REIT CONVERSION AT PENN NATIONAL
Penn National Gaming Inc. (“Penn”) shareholders $70.00 $68.09
have enjoyed an 81% return since REIT announcement
Appreciation in Penn continued after significant $65.00
first‐day rally $60.55
$60.00 $58.97
– 28% stock rally on November 16, 2012, for Penn
Adjusted Price Per Share
after announcing a spin‐off of its real estate into a $55.00
+81%
REIT
$50.00 $48.23 +61%
– 81% total return for Penn shareholders prior to the +57%
announcement to current market price has $45.00
significantly outperformed the S&P 500 Index +28%
$40.00 $37.61
MGM REIT’s superior asset quality and growth
prospects could warrant a premium to the 15.0x $35.00
EBITDA multiple of Gaming and Leisure Properties
Inc. (“GLPI”) $30.00
Day before Closing price Day before Closing price Today
REIT day of REIT REIT spin day of REIT
conversion conversion spin
announementannounement
Undervalued gaming and lodging real estate in the public markets is already
being monetized
Source: Bloomberg
Note: As of April 24, 2015
LANDandBUILDINGS 57CASE STUDY: POTENTIAL REIT CONVERSION AT
PINNACLE ENTERTAINMENT
Value creation for Pinnacle Entertainment Inc. $38.00
$36.74
(“Pinnacle”) shareholders could be either through
REIT spin‐off or real estate sale to a third party $36.00
43% stock rally for Pinnacle since announcement $34.00
that it planned to pursue a REIT conversion on $31.61
Adjusted Price Per Share
$32.00 +43%
November 6, 2014, significantly outperforming the
S&P 500 Index and REITs $30.00
GLPI offered to buy real estate of Pinnacle at about a $28.00 $27.42 +23%
50% premium to Pinnacle's volume‐weighted
$25.64 +7%
average price over the last 30 days on March 9, 2015 $26.00
$24.00
$22.00
$20.00
Day before REIT Closing price day Closing price day Today
potential before GLPI offer of GLPI offer
conversion
announement
Pinnacle’s shares have returned 43% since the announcement of potential real
estate monetization
Source: Bloomberg
Note: As of April 24, 2015
LANDandBUILDINGS 58IDEAL TIME: DEBT REPAYMENT OPPORTUNITY
MGM Capital Structure as of December 31, 2014
$ in millions
Principal Coupon Maturity
MGM Grand Paradise Term Loan Credit Facility $ 553.2 HIBOR +2.5% ‐ There is a
Term Loan A 1,030.0 LIBOR +2.5% ‐ window open
Term Loan B 1,720.0 LIBOR +2.5% ‐
4.25% Convertible Senior Notes, Due 2015 1,451.4 4.250% 2015
for MGM to
6.625% Senior Notes, Due 2015 875.4 6.625% 2015 retire half of its
10% Senior Notes, Due 2016 498.0 10.000% 2016 debt in the near
6.875% Senior Notes, Due 2016 242.9 6.875% 2016 term with no
7.5% Senior Notes, Due 2016 732.7 7.500% 2016 penalty
7.625% Senior Notes, Due 2017 743.0 7.625% 2017
11.375% Senior Notes, Due 2018 468.9 11.375% 2018
8.625% Senior Notes, Due 2019 850.0 8.625% 2019
5.25% Senior Notes, Due 2020 500.0 5.250% 2020
6.75% Senior Notes, Due 2020 1,000.0 6.750% 2020
6.625% Senior Notes, Due 2021 1,250.0 6.625% 2021
7.75% Senior Notes, Due 2022 1,000.0 7.750% 2022
6% Senior Notes, Due 2023 1,250.7 6.000% 2023
7% Debentures, Due 2036 0.6 7.000% 2036
6.7% Debentures, Due 2096 4.3 6.700% 2096
Source: Capital IQ
LANDandBUILDINGS 59IDEAL TIME: TAXPAYER IN 2015
MGM is expected to become a U.S. income tax payer in 2015,
creating urgency for a REIT conversion
For example, due to the tax efficiencies of the REIT structure,
we estimate $3 billion of value could be created from a
conversion to a REIT structure if MGM’s annual income taxes
grew to $200 million (applying a 15.0x multiple), because
profits will pass through the REIT to shareholders
An Astonishing Amount of Value Creation Potential
Source: mgmmirage.com
LANDandBUILDINGS 60HOULIHAN LOKEY’S INDEPENDENT REVIEW OF OUR
ANALYSIS
We retained an independent investment bank, Houlihan Lokey, to
provide an independent review of our proposed REIT structure
After that review, we have made minor adjustments to our analysis
contained in this presentation
The key adjustments are:
Reduced size of MGM China special dividend of $1 billion
Assumed tax leakage on MGM China special dividend and
asset sales at 10‐15% of proceeds to MGM
Used slightly more conservative EBITDA multiple valuations
Provided for higher rent coverage on the REIT
Our estimated MGM net asset value is $30‐$33 following an
independent review by Houlihan Lokey, highlighting significant upside
from current stock price
LANDandBUILDINGS 61You can also read