In the end-game DO sweat the small stuff - Toby Orpin Graham Moles - Institute and ...

Page created by Daniel Molina
 
CONTINUE READING
In the end-game DO sweat the small stuff - Toby Orpin Graham Moles - Institute and ...
In the end-game
DO sweat the small stuff
Toby Orpin
Graham Moles

4 December 2019
In the end-game DO sweat the small stuff - Toby Orpin Graham Moles - Institute and ...
Recent client trends
De-risking towards credit, real assets and LDI
                                     Average asset allocation has become more risk-averse in recent years
                                                                                                 Equities
  Proportion of assets

                                                                                                    Alternatives now
                                                                                                    a larger allocation                  Bonds
                                                                                                    than equities                                    Buy-out potential

                                                                                                                            Other alternative assets

“”                       Investment strategies that take account of anticipated future cash flow needs are becoming more commonplace,
                         with a growing number of schemes opting to invest in risk-reducing and cash flow-matching assets such as
                         gilts, corporate bonds and illiquids.
                         Pension Policy Institute
Source: Pensions Policy Institute: Approaching the endgame: The future of Defined Benefit pension schemes in the UK (October 2019), Mercer (2019).
Overlaid with illustrative trend lines (LGIM).

4 December 2019                                                                                                                                                          2
In the end-game DO sweat the small stuff - Toby Orpin Graham Moles - Institute and ...
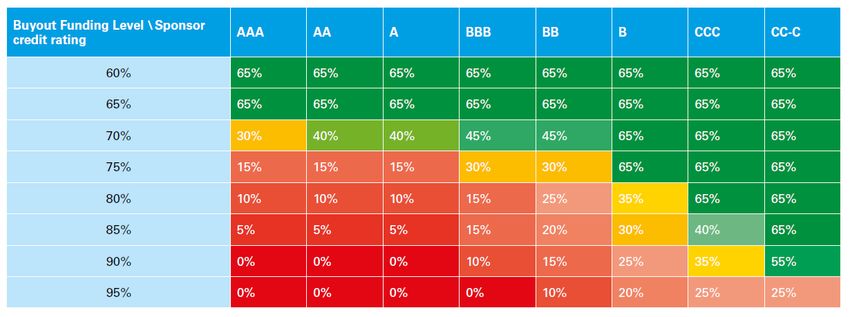
Getting the SAA right
Achieving your long-term target

4 December 2019
To achieve a long-term target you need a
long-term framework
                                Success = assets outlasting the liability cashflows

                                                                       Covenant

  Long-term ALM
  framework                                                             Overall
                                                                         risk in
                                                                        scheme

                                        Investment                                            Funding

                                Reduces focus on short-term MtM moves
Source: the Pensions Regulator. ALM – asset and liability management. MtM – mark to market.

4 December 2019                                                                                         4
Success is paying pensioners
                                                         Sum of pensions paid
PBM = Proportion of Benefit Met =
                                                      Sum of pensions promised

                                  Sponsor default and buyout FL = 50%
 Metric                        Definition
  EPBM                         Average proportion of benefits met over all simulations
  1 in 20 PBM                  Proportion of benefits met in a 1 in 20 event
  1 in 50 PBM                  Proportion of benefits met in a 1 in 50 event

Source: LGIM, November 2019.

4 December 2019                                                                          5
Traditional ALM tools often ignore some risks
7%

6%
                    6.1%
5%

4%

3%

2%                                                             2.5%        2.5%
                                                                                                          2.0%
                                                                                                                                                        1.8%
1%
                                1.1%                                                                                  1.0%                                       0.4%
0%
                         Credit                                  Covenant                                    Longevity                                     LPI
                              Short-term valuation risk (annualised)                               Long-term valuation risk (annualised)
Source: LGIM calculations, November 2019.
• Figures are purely for illustration only and are scheme dependent e.g. we have assumed a 20 year duration scheme.
• Both short and long-term risks are expressed as annualised volatilities.
• Each bar is a standalone risk that has not been scaled down e.g. 100% of assets are credit or all liabilities are LPI with a delta hedging approach
  is adopted.
• Covenant risk calculation assumes a BB-rated sponsor. No future contributions and an initial buyout funding level of 73%.

4 December 2019                                                                                                                                                         6
Avoid reckless prudence
 Buyout funding level \
                               AAA   AA   A   BBB   BB   B   CCC   CC-C
 Sponsor credit rating

Source: LGIM, November 2019.

4 December 2019                                                           7
Agony of choice
How to decide between the multiple paths to achieve a scheme’s goal
                                                              Assessing the benefits of a consolidator

                                                          250,000

                                                          200,000

    Consolidator?              Tranche Buy–in?
                                                          150,000

                                    Insurance solution?   100,000
  Cashflow
 matching?
                                                           50,000

                                                               0
                                                                    AAA    AA       A     BBB    BB        B     CCC
          Self                                                       Value sponsor support      Buyout deficit
                                             Buyout
       sufficiency                                                   value consolidator

Source: LGIM, November 2019.

4 December 2019                                                                                                        8
Looking further afield
Broadening the opportunity set

4 December 2019
As you close in on buyout, consider how an insurer invests
Snapshot of annuity investments across the market
 100%

   80%

   60%

   40%

   20%

    0%
               Prudential             L&G                 Aviva             Rothesay                PIC     Canada Life    ReAssure   Just

     Equity                                  Property                                 Equity Release Mortgages     Other Bonds
     BBB                                     A                                        AA                           AAA
     Loans                                   Commercial Mortgages                     Government Bonds             Other

Source: LGIM, NatWest Markets annual life review 2018, allocations derived from regulatory disclosures.

4 December 2019                                                                                                                              10
If buyout is not immediately on the horizon,
broaden the opportunity set

      Gov bonds           Public IG Credit   Private IG Credit   Private Credit (Sub   Long Lease   Residential Property   Infra Equity
                                                                         IG)            Property

                                      Decreasing cashflow certainty
Source: LGIM estimates.

4 December 2019                                                                                                                           11
Preconceptions can lead to missed opportunities…
                                       Improves diversification and
                                                                                                                     Low default and downgrade risk
                                         higher spread v DM IG

                                                                                                            3%                                                    0.6%

                                                                                                                                                                         Difference in average default rates
                     250
 Swap Spread (bps)

                                                                                    Average default rates
                     200
                                                                                                            2%                                                    0.4%
                     150

                     100
                                                                                                            1%                                                    0.2%
                      50

                       0
                           0                  5                  10            15                           0%                                                    0.0%
                                                                                                                 1   2    3     4    5     6    7    8   9   10
                                                      Duration
                                                                                                                              Holding period (years)
                               US IG        EUR IG*        EM Sov IG   EM Corp IG
                                                                                                                     EM IG                DM IG
*EUR IG spread hedged back into USD terms using cross currency basis.                                                Diff (RHS)
Source: JP Morgan, Bank of America Merrill Lynch, April 2019.
Source: Moody’s Investors Services, 1995-2018.

4 December 2019                                                                                                                                                                        12
… but be careful of drifting down the rating spectrum
$460bn of potential BBB downgrades in the next downturn
          500
                                                                                                                                                                      LBO risk

          400                                                                                                                                                         M&A risk
                                                                                                   Economic downturn
          300                                                                                                                                                         Leverage
 US$ bn

                                                                                                                                                                      already
                                                                                                                                                                      elevated
          200

          100                                                                                                                                                         Downgraded
                                                                                                                                                                      "no matter
                                                                                                                                                                      what"
           0

                                                                                                                          Base case
                         2007

                                                                                                            2018
                 2006

                                2008

                                        2009

                                                2010

                                                       2011

                                                               2012

                                                                       2013

                                                                              2014

                                                                                     2015

                                                                                            2016

                                                                                                     2017

                                                                                                                   2019

                                                                                                                                      Downturn Risk

                                                                                                                                                      Leverage Risk
Source: Bonds entering the BAML HY index, LGIM forecasts as of 5 November 2019.

4 December 2019                                                                                                                                                                  13
Implementation
Mind the gap

4 December 2019
Creating a model portfolio
Translating SAA into cashflow matching profile
         Growth
                                              Meeting cash flows as they fall due

               SAA
                                  Cashflow
                                  matching
                                              1 2 3 4 5 6 7 8 9 10               10-15        15-20        20-25    25-30        30-35        35-40   40-45        45+
                                  portfolio
    Holistic portfolio management             Success is improving cashflow coverage                                  Building blocks to achieve success
                  LDI                                     1,000                                                               Efficient use
                                                                                                                                                      Diversification
                                               Millions

                                                                                                                              of collateral
             Buy & Maintain
                                                           500                                                                                         Minimising
               EMD (HC)                                                                                                     Avoiding defaults
                                                                                                                                                        ‘leakage’
             Private Credit
                                                                                                                            Achieving better           Improving
                                                             -
                Property                                                                                                      net spreads              WARF/DTS
                                                                  0    10       20       30           40       50
                Growth
                                                                      Cummulative Liabilities
         Employer Contributions                                       Cummulative Assets (Default Adjusted)
                                                                      Cummulative Assets (No defaults)
Source: LGIM, November 2019.

4 December 2019                                                                                                                                                          15
Remain nimble and flexible
Example framework for assessing a new private credit investment
Issuer example            Private issuer            Unlisted deal                 Key deal positives                         Rebalancing approach
                                                                                                                             Reduce transport exposure in listed credit and rebalance
Heathrow                  Yes                       Yes                           RPI to CPI linkage
                                                                                                                             derivatives from RPI to fixed
Mars                      Yes                       Yes                           New name                                   Sell out of listed credit consumer cyclicals
                                                                                  Tailored RPI exposure and                  Sell out of listed credit utilities and reduce RPI exposure in
Utility                   No                        Yes
                                                                                  increased seniority                        derivative portfolio

          How does the opportunity impact my
              strategic asset allocation?                                            How would it affect my return if I was forced to sell the asset?
                                  Sector moving                                      Haircuts to spread
                                  closer to SAA
                                                                                      Sponsor strength \ initial buyout FL    70%         75%         80%         85%         90%         95%
                    Portfolio
                    pre deal                                                          AAA                                     0.1%        0.1%        0.1%        0.2%        0.3%        0.8%
             Portfolio
             post deal
                                                                                      AA                                      0.1%        0.1%        0.1%        0.2%        0.3%        0.8%

                                                                                      A                                       0.1%        0.1%        0.1%        0.2%        0.3%        0.8%
    Tenor moving                                           Credit rating moving
    closer to SAA                                             closer to SAA           BBB                                     0.1%        0.1%        0.1%        0.2%        0.3%        0.8%

                                                                                      BB                                      0.1%        0.1%        0.2%        0.2%        0.4%        0.9%

                                                                                      B                                       0.3%        0.3%        0.3%        0.4%        0.5%        1.0%

                                 Illiquids allocation
                                moving closer to SAA

Source: LGIM, November 2019.

4 December 2019                                                                                                                                                                                  16
Benefits of holistic cashflow matching management
Avoid being penny wise but pound foolish
                                              Achieving better                                          Diversification:
                                               net spreads:                                               Broadening the
                                                 Local authority                                         opportunity set to
                                              housing associations                                     include new sectors

Sector                 Housing associations                          Sector                   Renewables/ solar
Type                   Senior Secured Private placement              Location                 UK
Income Stream          Fixed coupon
                                                                     Deal size                £48m
Internal LGIM Rating   A
                       •   Asset cover (EUV-SH 105%; MVT 115%)       Income Stream            Fixed
Financial Covenants
                       •   EBITDA to net interest payable >1.1x      Internal LGIM Rating     BBB+
Illiquidity premia     40 – 50 bps spread to comparable              Maturity                 2035

                                                                         Improving overall portfolio
    Reallocating capital from low yielding public to                 diversification and ESG credentials
         more attractive private opportunities                         of cashflow matching portfolio

4 December 2019                                                                                                               17
Is this available for my scheme
In short… yes

4 December 2019
Evolution of tailored strategies – LDI
                                                                    Bullet funds                                                                                                                                                                  Profile funds
                                                                                         Liability cashflows
                                                                                                                                                                                                                                                                         Liability cashflows

                                     2014

                                             2019

                                                    2024

                                                           2029

                                                                  2034

                                                                         2039

                                                                                2044

                                                                                       2049

                                                                                              2054

                                                                                                     2059

                                                                                                            2064

                                                                                                                   2069

                                                                                                                          2074

                                                                                                                                 2079

                                                                                                                                        2084

                                                                                                                                               2089

                                                                                                                                                      2094

                                                                                                                                                              2099

                                                                                                                                                                     2104

                                                                                                                                                                                                                     2014

                                                                                                                                                                                                                             2019

                                                                                                                                                                                                                                    2024

                                                                                                                                                                                                                                           2029

                                                                                                                                                                                                                                                  2034

                                                                                                                                                                                                                                                         2039

                                                                                                                                                                                                                                                                2044

                                                                                                                                                                                                                                                                       2049

                                                                                                                                                                                                                                                                              2054

                                                                                                                                                                                                                                                                                     2059

                                                                                                                                                                                                                                                                                            2064

                                                                                                                                                                                                                                                                                                   2069

                                                                                                                                                                                                                                                                                                          2074

                                                                                                                                                                                                                                                                                                                 2079

                                                                                                                                                                                                                                                                                                                        2084

                                                                                                                                                                                                                                                                                                                               2089

                                                                                                                                                                                                                                                                                                                                      2094

                                                                                                                                                                                                                                                                                                                                             2099

                                                                                                                                                                                                                                                                                                                                                    2104
                                            Fixed liabilities      Inflation-linked Liabilities
                                                                                                                                                                                                                            Fixed liabilities      Inflation-linked Liabilities
 2016-2020 2021-2025 2026-2030 2031-2035 2036-2040 2041-2045 2046-2050 2051-2055 2056-2060 2061-2065 2066-2070

   2020        2025        2030              2035                         2040                        2045                        2050                        2055            2060
  Fixed       Fixed       Fixed             Fixed                        Fixed                       Fixed                       Fixed                       Fixed           Fixed                                                                                                                               Inflation-linkage
  (6.4x)      (5.4x)      (4.4x)            (3.7x)                       (3.2x)                      (2.7x)                      (2.3x)                      (1.9x)          (1.7x)                                Real                                         Real
    2020        2025        2030           2035                         2040                                                   2050                                            2060                                short                                        long
 Inflation   Inflation   Inflation      Inflation                    Inflation                                              Inflation                                       Inflation
   (6.4x)      (5.4x)      (4.4x)         (3.7x)                       (3.2x)                                                 (2.3x)                                          (1.7x)                               fund                                         fund
 2020 Real 2025 Real 2030 Real        2035 Real                    2040 Real 2045 Real 2050 Real                                                      2055 Real 2060 Real
   (6.4x)    (5.4x)    (4.4x)           (3.7x)                       (3.2x)    (2.7x)    (2.3x)                                                         (1.9x)    (1.7x)
                                                                                                                                                                                                                   Fixed                                        Fixed
             2024 ILG    2030 ILG      2034 ILG                     2037 ILG                   2042 ILG                    2047 ILG                    2055 ILG                         2062 ILG   2068 ILG        short                                        long
              (4.7x)      (4.4x)        (3.9x)                       (3.6x)                     (3.1x)                      (2.7x)                      (2.1x)                           (1.5x)     (1.5x)
                                                                                                                                                                                                                   fund                                         fund
                                                                    2040 ILG                                               2050 ILG                                                                                                                                                                              No inflation-linkage
                                                                     (3.3x)                                                 (2.4x)

                                                                    2038 Gilt                  2042 Gilt                   2045 Gilt                   2055 Gilt            2060 Gilt              2068 Gilt
                                                                     (4.0x)                     (3.8x)                      (3.6x)                      (3.2x)               (3.0x)                 (2.6x)     Older                                             Younger
                                                                                                                                                                                                               membership                                        membership
                                                                                                                           2049 Gilt
                                                                                                                            (3.4x)                                                                             profile                                           profile

Source: LGIM, November 2019.

4 December 2019                                                                                                                                                                                                                                                                                                                                            19
Cashflow matching pooled funds
                                                  Buy & maintain credit maturing funds

                   Combined pooled funds                                                  Real assets pooled funds
                  Funds combining credit & LDI
                                                                                  GBP IG           GBP IG Private        GBP Senior
     Real short          Real long        Fixed short       Fixed long      Infrastructure Debt    Corporate Debt      Real Estate Debt

                                                                                GBP Sub IG        GBP Sub IG Private
                                                                                                                         Opportunistic
                                                                            Infrastructure Debt    Corporate Debt
    ~13 yrs             ~24 yrs         ~13 yrs             ~24 yrs

 The credit range of funds will allocate to gilts, LDI and buy & maintain
     credit. This is a diversified and liability-aware credit portfolio.

Source: LGIM, November 2019.

4 December 2019                                                                                                                           20
How pooled size schemes can access tailored approaches
Range of options depending on preference and governance budget
                                  GOVERNANCE INCREASING

                                     DELEGATION INCREASING

     Fiduciary/ fully       Pooled fund             Combined strategy        Single strategy
   delegated mandate      solutions service           pooled funds            pooled funds

                          Partial delegation
   A full governance      of section of the         Pooled funds which        Clients able to
    solution covering    portfolio. Objective-        look to combine         utilise specific
  investment strategy     driven, i.e. target        strategies to meet      pooled funds at
  and implementation    80% cashflow match          multiple objectives,    their discretion to
   across all assets.     using a range of          i.e. credit with LDI.    meet objectives.
                            pooled funds.

4 December 2019                                                                                   21
Legal & General Investment Management
LGIM Disclaimer and important legal notice
The information contained in this document (the ‘Information’) has been prepared by Legal & General Investment Management Limited, or by Legal and General Assurance (Pensions Management) Limited and/or their affiliates (‘Legal &
General’, ‘we’ or ‘us’). Such Information is the property and/or confidential information of Legal & General and may not be disclosed by you to any other person without the prior written consent of
Legal & General.
No party shall have any right of action against Legal & General in relation to the accuracy or completeness of the Information, or any other written or oral information made available in connection with this publication. Any investment advice that
we provide to you is based solely on the limited initial information which you have provided to us. No part of this or any other document or presentation provided by us shall be deemed to constitute ‘proper advice’ for the purposes of the
Pensions Act 1995 (as amended). Any limited initial advice given relating to professional services will be further discussed and negotiated in order to agree formal investment guidelines which will form part of written contractual terms between
the parties.
Past performance is no guarantee of future results. The value of an investment and any income taken from it is not guaranteed and can go down as well as up, you may not get back the amount you originally invested.
The Information has been produced for use by a professional investor and their advisors only. It should not be distributed without our permission.
The risks associated with each fund or investment strategy are set out in this publication, the relevant prospectus or investment management agreement (as applicable) and these should be read and understood before making any investment
decisions. A copy of the relevant documentation can be obtained from your Client Relationship Manager.
Confidentiality and Limitations:
Unless otherwise agreed by Legal & General in writing, the Information in this document (a) is for information purposes only and we are not soliciting any action based on it, and (b) is not a recommendation to buy or sell securities or pursue a
particular investment strategy; and (c) is not investment, legal, regulatory or tax advice. Any trading or investment decisions taken by you should be based on your own analysis and judgment (and/or that of your professional advisors) and not
in reliance on us or the Information. To the fullest extent permitted by law, we exclude all representations, warranties, conditions, undertakings and all other terms of any kind, implied by statute or common law, with respect to the Information
including (without limitation) any representations as to the quality, suitability, accuracy or completeness of the Information.
Any projections, estimates or forecasts included in the Information (a) shall not constitute a guarantee of future events, (b) may not consider or reflect all possible future events or conditions relevant to you (for example, market disruption
events); and (c) may be based on assumptions or simplifications that may not be relevant to you.
The Information is provided ‘as is' and 'as available’. To the fullest extent permitted by law, Legal & General accepts no liability to you or any other recipient of the Information for any loss, damage or cost arising from, or in connection with, any
use or reliance on the Information. Without limiting the generality of the foregoing, Legal & General does not accept any liability for any indirect, special or consequential loss howsoever caused and on any theory or liability, whether in contract
or tort (including negligence) or otherwise, even if Legal & General has been advised of the possibility of such loss.
Third Party Data:
Where this document contains third party data ('Third Party Data’), we cannot guarantee the accuracy, completeness or reliabi lity of such Third Party Data and accept no responsibility or liability whatsoever in respect of such Third Party Data.
Publication, Amendments and Updates:
We are under no obligation to update or amend the Information or correct any errors in the Information following the date it was delivered to you. Legal & General reserves the right to update this document and/or the Information at any time
and without notice.
Although the Information contained in this document is believed to be correct as at the time of printing or publication, no assurance can be given to you that this document is complete or accurate in the light of information that may become
available after its publication. The Information may not take into account any relevant events, facts or conditions that have occurred after the publication or printing of this document.
Telephone Recording
As required under applicable laws Legal & General will record all telephone and electronic communications and conversations with you that result or may result in the undertaking of transactions in financial instruments on your behalf. Such
records will be kept for a period of five years (or up to seven years upon request from the Financial Conduct Authority (or such successor from time to time)) and will be provided to you upon request.
Legal & General Investment Management Limited. Registered in England and Wales No. 02091894. Registered Office: One Coleman Street, London, EC2R 5AA. Authorised and regulated by the Financial Conduct Authority, No. 119272.
Legal and General Assurance (Pensions Management) Limited. Registered in England and Wales No. 01006112. Registered Office: One Coleman Street, London, EC2R 5AA. Authorised
by the Prudential Regulation Authority and regulated by the Financial Conduct Authority and the Prudential Regulation Authori ty, No. 202202.
The LGIM Workplace Savings division on behalf of both Legal and General Assurance Limited. Registered in England and Wales No. 00166055. Authorised by the Prudential Regulation
Authority and regulated by the Financial Conduct Authority and the Prudential Regulation Authority. As well as Legal & General (Portfolio Management Services) Limited. Registered in
England and Wales No. 02457525. Authorised and regulated by the Financial Conduct Authority, No. 146786. Registered Offices: One Coleman Street, London, EC2R 5AA.

                                                                                                                                                                                                                                                       22
You can also read