Income Investing in a Low-Yield World - Money Show Virtual Expo, August 2021 Marvin Appel, Ph.D., M.D - Signalert Asset Management
←
→
Page content transcription
If your browser does not render page correctly, please read the page content below

Income Investing in a Low-Yield World
      Money Show Virtual Expo, August 2021

                Marvin Appel, Ph.D., M.D.
    525 Northern Blvd, Suite 210, Great Neck, NY 11021
                       516-829-6444
Outline
• Investment landscape: low interest rates, high volatility, inflation risk.

• Introduction to high yield bonds

• Bond fund portfolio for long-term holding

• Fixed income investing to take advantage of higher yields
    • High yield bond fund trading
    • Floating rate funds

• High yield municipal bond fund trading

• Covered call writing—When is it worth doing?

• Tax-advantaged risk management with options and high yield municipal bond fund trading
Treasury Yields Are At Historic Lows
High yield corporate bond mutual funds
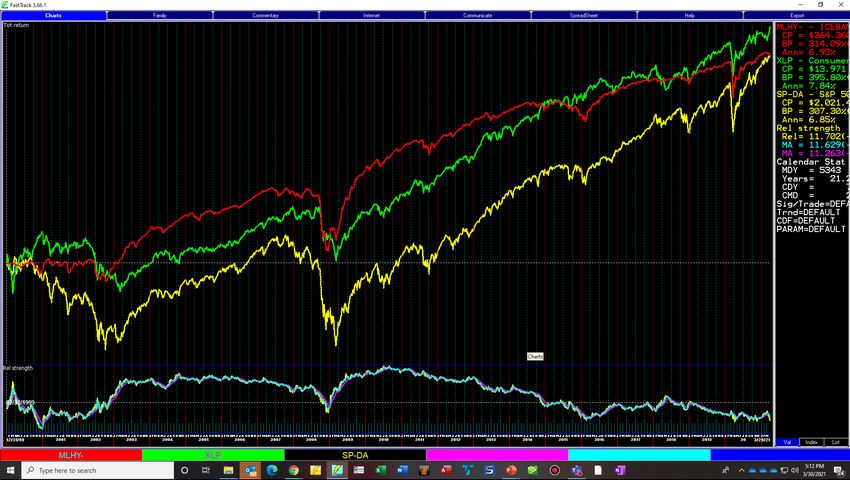
High yield bonds have been competitive
        with equities 2000-2021
                                 Consumer Staples
                                 Sector SPDR (XLP)
                                 7.8%/year, 36% max
                                 drawdown

                                 Merrill Lynch U.S.
                                 High Yield Master II
                                 6.9%/year, 35% max
                                 drawdown

                                 S&P 500 SPDR (SPY)
                                 6.9%/year, 55% max
                                 drawdown
Risk measure: worst drawdown
120                                                                         120

                        11722 on Jan. 14, 2000
115                                                                         115

110                                                                         110
                                                        2000-2002
105
                                                        37.8%               105
                                                        drawdown
100                                                                         100

95                                                                           95

90                                                                           90

        Dow Jones
85                                                                           85
        Industrial Average
80                                                                           80

75                                                                           75
                          7286 on Oct. 9, 2002
70                                                                           70
x100                                                                        x100

       1999      2000            2001            2002        2003   2004   2005
Bond fund portfolio for above-average yields • Put half of capital into the Vanguard Total Bond Market Index Fund (VBMFX) • Put the other half into the Wells Fargo Short-Term High Yield Bond Fund (SSTHX) • Historical return: 4.1%/year from 2001-2021 • Worst drawdown 8.7%. • For the funds separately: • VBMFX: 3.9%/year, 6.5% worst drawdown • SSTHX: 4.2%/year, 14.2% worst drawdown
Corp. High Yield Bonds Have Done Well When
         Interest Rates Were Rising
Losses in Monthly Growth
high yield bondsofhave
$10,000
been infrequent
Corporate Bond
but - High Yield
sometimes Obj. Avg
severe.
$
100,000
A
m 50,000
o
u
n 20,000
t
10,000
12/87 12/91 12/95 12/99 12/03 12/07 12/11 12/15 12/19
Final Amount
Corp. high yield bond average, growth of $10,000 1988-2021. Source: Steele Mutual Fund Expert, 6/30/20213% Buy and sell stops
Mutual fund value (including interest) 110
Sell
Buy
105
Buy
100
95
Sell
90
Share price
Your inves tm ent
85
1 2 3 4 5 6 7 8 9 10 11 12
Months
8/9/2021 Signalert Asset ManagementTime of sell (move to cash) Time of buy (move from cash to shares)
Floating rate bond funds
• Hold adjustable-rate bank loans made to below-investment grade
  borrowers
• Better collateralized than high yield bonds, so better recovery (>65%)
  in cases of default
• Interest income tracks the prime rate, which rises and falls parallel to
  the Fed Funds Rate. But these loans usually have a minimum interest
  rate of 4% even when prime is below that.
• No interest rate risk, but potentially significant credit-spread risk
• Beware of potential liquidity problems (as in 2008). Read your fund’s
  prospectus regarding trading restrictions.
Floating rate funds are less volatile than
       corporate high yield bond funds (2013-2020)

Total returns:                                     2018
                                                   HFLAX -4.6%
PGIM High Yield                                    PBHAX -5.6%
(PBHAX)—
                                    2015-2016                    2020
3.5%/year
                                    HFLAX -7.8%                  HFLAX -22.4%
                      2014
                                    PBHAX -11.2%                 PBHAX -21.1%
Hartford Floating     HFLAX -3.9%
Rate (HFLAX)—         PBHAX -5.7%
1.6%/year

        2013
        HFLAX -1.4%
        PBHAX -5.2%
Summary
Taxable high yield bond funds.
• Low interest rates present a challenge to risk-sensitive investors.
• One solution is to use corporate high yield bond funds to take
advantage of their higher yields compared to the broad bond market.
• The simplest approach is to diversify risks with a portfolio of equal
allocations to Vanguard Total Bond Market Index Fund (VBMFX) and
Wells Fargo Short-Term High Yield Bond Fund (SSTHX).
• A historically more powerful approach has been to utilize 3% buy and
sell stops to trade corporate high yield or floating rate bond funds
with the goal of reducing risks during the roughly 20% of the time
that market conditions are unfavorable, while benefitting from higher
interest income the rest of the time.High yield municipal bond funds • Federally tax-exempt (but not in most states) • May have AMT exposure • Less credit risk than taxable high yield bonds • Liquidity risk • Extremely long maturities—Much more interest rate risk than taxable high yield bonds
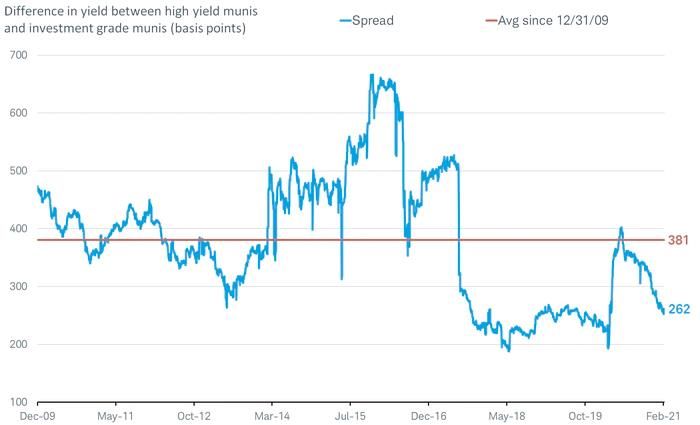
Taxable and muni high yield bond
funds can usually diversify each other.
High yield muni spreads to
               investment-grade are similar to
                   corporate bond spreads.

https://www.schwab.com/resource-center/insights/content/are-high-yield-muni-bonds-answer-to-low-yields, accessed 8/4/21
Nuveen High Yield Muni Fund (NHMAX)
• Largest high yield municipal bond fund ($23 billion)
• SEC yield 2.73%
• 22 year average maturity, 9 year average duration
• 63% unrated, 10% BB
• 13% subject to AMT
• 3,416 positions
• 45% drawdown during financial crisis, 22% drawdown in 2020
• Underlying illiquid market ($144 billion total in Bloomberg Barclays index)
• Trade with the same system as corporate high yield bond funds but use
wider stops (6% to buy and sell)—five trades in 20 years.
https://www.schwab.com/resource-center/insights/content/are-high-yield-muni-bonds-answer-to-low-yields,
https://documents.nuveen.com/Documents/Nuveen/Default.aspx?uniqueId=9a5609f4-0d87-4967-a59b-28e99ca8ab70Trading rules originally published in “Higher Returns from Safe Investments” by Marvin Appel, FT Press, 2010.
An Option Strategy When Investors are Fearful
Introduction to options
• Call option
   • Gives the owner the right but not the obligation to buy 100 shares at a pre-agreed price
      (strike price) on or before an expiration date.
   • Value of a call option rises when the underlying stock or ETF rises.

• Put option
   • Gives the owner the right but not the obligation to sell 100 shares at a pre-agreed price
      (strike price) on or before an expiration date.
   • Value of a put option rises when the underlying stock or ETF falls.

• For every option bought there must be someone writing options on the other side of the trade
  who must pay up if the buyer exercises the option.

• All else being equal, options are more expensive the longer until the expiration date and the
  more volatile traders expect the underlying stock or ETF to be.
How much does an option cost?
110
105
Time value
100
Stock price
95 Capital at risk
Intrinsic value
90 Strike price
85
80 Risk avoided
Capital at risk
75
70
65
60
Buy Stock Buy Call Option
Notional Value Intrinsic Value Time ValueCovered call position
• Buy 100 shares of stock 10
Profit / Loss on position at expiration
and sell one option on 8
the stock. Buy stock at $90
6 Sell covered call at $2
4
• Gain is likely to occur, 2
but is limited. 0
-2
• Losses are relatively -4
unlimited, but in a losing -6
Profit / loss on covered call position
month writing a covered
call always reduces -8 Profit / loss on ETF alone
losses compared to -10
owning the shares
81
82
83
84
85
86
87
88
90
91
92
94
95
96
97
99
80
89
93
98
100
alone.
Share Price at ExpirationPut-Call parity
Stock + dividends = call – put + cash
(cash earns risk-free interest)
As a result,
Stock – call = cash – put
In theory, covered call writing should return
the same as cash-secured put writing.Total Returns 1990-2020 Index Annual return Worst Drawdown Covered call (BXM) 7.5% -40% S&P 500 total return 9.3% -55% Put writing (PUT) 8.6% -37%
Implied volatility and VIX

• “Implied volatility” is the level of volatility that a stock must demonstrate
  between now and expiration to make its stock options fairly priced.

• VIX is an index that measures the average level of implied volatility
  (annualized) over the next 30 days built into S&P 500 Index options
  (puts and calls) expiring between 23 and 37 days from now. Its
  average value has been 19.5%.

• The higher the level of implied volatility, the more expensive the
  same level of option protection.
• Just because options are cheap (low VIX) doesn’t mean that they
  are a bargain.
Market returns under
                  high versus low volatility
16.00%
                  Annualized Returns 1990-2020
14.00%
                  13.70%
         12.20%            11.60%   BXM
12.00%

10.00%                              PUT
                                                             7.80%
 8.00%                              S&P 500
 6.00%                                             5.20%
                                          4.30%
 4.00%

 2.00%

 0.00%

              VIX >= 19                           VIX < 19
Take advantage of VIX to guide your strategy:
write options when VIX > 19
Total Returns 1990-2020
12.00%
10.20%
10.00% 9.30% 9.60%
8.60%
8.00% 7.50%
6.00%
4.00%
2.00%
0.00%
S&P 500 Covered call Put writing BXM and SPX PUT and SPXThese are not conservative strategies
Worst Drawdowns 1990-2020
S&P 500 Covered calls Put writing BXM and SPX PUT and SPX
0%
-10%
-20%
-30%
-40%
-37%
-40% -40%
-50%
-44%
-60% -55%This is the best environment for
covered calls in years.
4100 4100
S&P 500 Index
4000 4000
3900 3900
3800 3800
3700 3700
3600 3600
3500 3500
3400 3400
3300 3300
3200 3200
3100 3100
3000 3000
2900 2900
2800 2800
2700 2700
2600 2600
2500 2500
2400 2400
2300 2300
2200 2200
2100 2100
2000 2000
1900 1900
90 90
80 80
70 70
60 VIX 60
50 50
40 40
30 30
20 21 20
10 12 10
2016 2017 2018 2019 2020 2021Poor risk management during market crashes
Poor Risk Management in 2020
There are other covered call indexes
       available from CBOE

   • Dow Jones Industrial Average (BXD, 1997-2017)
   • Russell 2000 Index (BXR, 2001-2017)
   • Nasdaq 100 Index (BXN, 1995-2017)

   Beware:
   Not all ETF covered call strategies are created
   equal.
Conclusions on using
covered calls for income
• This strategy works best with SPY rather than other index ETFs.
• Covered call writing has been more successful when option implied
volatility (the cost of option hedging) has been at or above average
(ie: VIX at or above 19).
• My experience in general is that covered call writing works best with
low-moderate volatility stocks and indexes but not with more volatile
underlying securities.
• Not a conservative strategy.Tax-advantaged strategy • Trade high yield municipal bond mutual funds. • Gain stock market exposure by holding in-the-money S&P 500 Index options that are 1256 contracts. • Result: Close to S&P 500 performance to the upside with downside risk reduced to the cost of the option plus the risk of high yield municipal bond funds. • The lower VIX, the better this strategy is.
Why use in-the money S&P 500 Index options?

         Solid areas   = capital at risk

                                           Striped areas:
                                           Risk avoided
Sample tax-advantage trade for
S&P exposure
(8/5/21, S&P 500 at 4416) for every $441,600 in your account:
• Buy SPX 06/17/2022 4100 call at 493.80 ask (notional value $441,600). This position
will underperform the S&P 500 total return by 5.2% if the S&P 500 is flat or higher
between now and 6/17/2022 (4% time value plus 1.2% dividends missed). Maximum
stock market risk is 11.2% of the notional value (the cost of the option as a fraction
of $441,600).
• Trade the remaining $392,200 in high yield municipal bond funds. Need to make
5.9% on the funds for this portfolio to match the S&P 500. I project making half that.
• Can implement with mini-S&P index options ($XSP), each option representing
$44,160.Conclusions: • If option prices are too cheap for covered call writing, consider buying long calls and using bond fund trading to compensate for the cost of the option’s time value. • This type of strategy can garner you stock market exposure to the upside with potentially below-market risk during major declines.
Books by
Marvin Appel

(published by
Prentice-Hall)
Disclaimers
• Past results do not guarantee any future performance.
• Results are based on data and calculations believed reliable,
  but are not audited or guaranteed.
• Results are hypothetical. They are not the experience of any
  actual client.
• Expenses such as taxes or transaction costs are not accounted
  for in the historical illustrations.
• The strategies presented here may not be suitable for every
  investor.
• Historical mutual fund total return data are from Investors
  FastTrack.
For more information

• Money management by Signalert Asset Management:
  www.signalert.com, mappel@signalert.com

• Investment newsletter: Systems and Forecasts
    • High yield bond timing signals
    • US equity timing signal
    • Relative strength between US and foreign equity timing signals

• Free newsletter trial (Sign up at www.systemsandforecasts.com)

• For a copy of these slides, email me at mappel@signalert.com
You can also read


