Index 2023 Community Wellbeing - GREATER NEW HAVEN

Page created by Ken Griffin
 
CONTINUE READING
Index 2023 Community Wellbeing - GREATER NEW HAVEN
GREATER NEW HAVEN

Community
Wellbeing
Index 2023

Indicators of well-being, equity, and quality
of life in Greater New Haven neighborhoods

A CORE PROGRAM OF

                         In collaboration with The Community Foundation for Greater New Haven, and a
                         Community Health Needs Assessment for the towns served by Yale New Haven Hospital
                         and other regional healthcare providers
Index 2023 Community Wellbeing - GREATER NEW HAVEN
Thank you to our Major Funders

DataHaven Community Wellbeing Survey Funders
Among other data sources, this document makes extensive use of the DataHaven Community Wellbeing Survey, which
completed live, in-depth interviews with over 40,000 randomly-selected adults in every Connecticut town in 2015,
2018, 2020, 2021, and 2022. In addition to the major funders shown above, sponsors of interviews in Greater New
Haven included local public health departments, Carolyn Foundation, Tufts Health Plan Foundation, Universal Health
Care Foundation of Connecticut, Planned Parenthood of Southern New England, Yale Cancer Center, Yale Medicine,
Yale University, Southern Connecticut State University, Workforce Alliance, and other partners.

Lead Authors
Mark Abraham, MPH, Executive Director, DataHaven
Camille Seaberry, BS, Senior Research Associate, DataHaven
Kelly Davila, MS, Senior Research Associate, DataHaven
Andrew Carr, PhD, Data Analyst, DataHaven

Co-Authors
Aparna Nathan, Emilia Oliva, Brian Slattery, Sarah Ullom-Minnich, Liyang Yang, DataHaven

Other Contributors
Matt Higbee, The Community Foundation for Greater New Haven
Connecticut Hospital Association ChimeData
Don Levy and Meghann Crawford, Siena College Research Institute
Linda F Cantley and Deron Galusha, Yale Occupational and Environmental Medicine Program
John Kudos, Ashley Wu, Jamus Marquette, Amanda Knott, KUDOS Design Collaboratory™

Please contact DataHaven for permission to reproduce any of the text, images, or graphics in this report. We strongly encourage requests from organizations that wish
to use this information or conduct further analysis to benefit community action. Contact information is listed on the back of the report. Nothing in this report should
be interpreted to represent the official views of any of the participating organizations.

Suggested citation: Abraham, M., Seaberry, C., Davila, K., Carr, A. (2023). Greater New Haven Community Wellbeing Index 2023. New Haven, CT: DataHaven. Available at
ctdatahaven.org.

© 2023 DataHaven
ISBN: 978-1-7340851-5-0 (paperback)
Index 2023 Community Wellbeing - GREATER NEW HAVEN
Contents
1    Introduction and Community         4    5   Youth and Education                       38
		   Index                                       Early Childhood                           39
                                                 Public Education                          39
     Foreword                           4
                                                 Higher Education                          42
     About This Document                5
                                                 Youth Opportunity                         43
     Measuring How Communities          5
                                                 Focus: School Segregation and Diversity   44
        Shape Well-Being
     Connecticut Rankings               6
     DataHaven Community Index          6
        Scores for Local Areas               6   Economy                                   46
     Personal Wellbeing Index           10
     Life Satisfaction                  11       Jobs                                      47
                                                 Wages                                     49
                                                 Educational Attainment                    51

2    Population                         12

     Population Change                  13   7   Health                                    54
     Households                         16
     Immigration                        16       Barriers to Healthcare                    55
     Focus: Segregation                 19       Weather, Climate, and Public Safety       57
                                                 Health Risks                              58
                                                 Maternal and Infant Health                60
                                                 Child Health                              61
3    Economic Security                  20       Chronic Conditions                        61
                                                 Mortality                                 62
     Economic Security and Well-Being   21
                                                 Mental Health and Suicide                 66
     Income                             22
                                                 Focus: Road Safety                        67
     Poverty                            23
     Food Security                      24
     Transportation                     25
     Internet Access                    25   8   Civic Life                                68
     Wealth                             27
                                                 Civic Engagement                          69
                                                 Institutional Trust                       70
                                                 Community Satisfaction                    72
4    Housing                            28       Municipal Spending and                    73
                                                    Community Assets
     Housing and Well-Being             29
                                                 Policing and Criminal Justice             76
     Homeownership                      30
                                                 Incarceration                             76
     Housing Affordability              32
                                                 Focus: Police Stops                       79
     Evictions                          35
     Housing Supply                     37

                                             9   Conclusion and Endnotes                   80
Index 2023 Community Wellbeing - GREATER NEW HAVEN
DataHaven Greater New Haven Community Wellbeing Index                                                                                                 2

                                                                                            CHAPTER 3                     FIGURE 3D HIGHER SHARES

                                                                                            Economic                      OF BLACK AND LATINO

Visual Appendix
                                                                                                                          HOUSEHOLDS DO NOT HAVE

                                                                                            Security                      ACCESS TO A VEHICLE PG 25

                                                                                            FIGURE 3A MEDIAN INCOMES
                                                                                            HAVE RISEN STEEPLY IN
                                                                                            HIGHER-INCOME TOWNS PG 22
43 figures, 33 tables, 1 report —
here’s a preview of what we learned about                                                                                 FIGURE 3E RESIDENTS
Greater New Haven                                                                                                         OF MAJORITY NON-WHITE
                                                                                                                          NEIGHBORHOODS ARE MORE
                                                                                                                          LIKELY TO HAVE DEBT IN
                                                                                                                          COLLECTIONS PG 27

CHAPTER 1                      FIGURE 1D MANY POSITIVE          FIGURE 2D THE MAJORITY
                               EXPERIENCES AND RESOURCES,       OF NEW HAVEN'S
Introduction                   INCLUDING HAVING A HIGH
                               INCOME, CORRESPOND TO
                                                                HOUSEHOLDS ARE NONFAMILY
                                                                HOUSEHOLDS PG 16
and                            HIGHER LIFE SATISFACTION PG 11

Community                                                                                                                 CHAPTER 4
Index
                                                                                            FIGURE 3B FEMALE              Housing
FIGURE 1A COMMUNITY INDEX                                                                   HOUSEHOLDERS UNDER AGE 25
SCORES VARY BY TOWN WITHIN                                                                  HAVE THE HIGHEST POVERTY      FIGURE 4A HOUSING
GREATER NEW HAVEN PG 8                                                                      RATE PG 23                    VALUES VARY SUBSTANTIALLY
                               CHAP TER 2                                                                                 BY RACE PG 30
                                                                FIGURE 2E GREATER NEW
                               Population                       HAVEN’S FOREIGN-BORN
                                                                POPULATION HAS BEEN
                                                                CHANGING OVER TIME PG 17
                               FIGURE 2A SINCE 1980, THE
                               REGION HAS DIVERSIFIED
                               GREATLY PG 14

FIGURE 1B PERSONAL                                                                                                        FIGURE 4B BLACK AND
WELL-BEING TENDS TO IMPROVE                                                                                               LATINO MORTGAGE APPLICANTS
                                                                                            FIGURE 3C AS PANDEMIC         HAVE HIGHER REJECTION
WITH OVERALL COMMUNITY                                                                      RELIEF PROGRAMS FADE, BLACK
WELL-BEING PG 10                                                                                                          RATES PG 31
                                                                                            AND LATINO ADULTS AND
                                                                                            ADULTS WHO LIVE WITH
                                                                FIGURE 2F VERY FEW
                                                                                            CHILDREN ARE HIT HARD BY
                                                                NEIGHBORHOODS HAVE BOTH
                                                                                            FOOD INSECURITY PG 24
                                                                HIGH INCOMES AND HIGH
                                                                LEVELS OF DIVERSITY PG 18
                               FIGURE 2B YOUNGER
                               GENERATIONS ARE MUCH MORE
                               RACIALLY DIVERSE THAN OLDER
                               ONES PG 15

FIGURE 1C WITHIN                                                                                                          FIGURE 4C HIGHER-INCOME
DEMOGRAPHIC GROUPS, LIFE                                                                                                  HOUSEHOLDS ARE MORE LIKELY
SATISFACTION OFTEN VARIES BY                                                                                              TO OWN THEIR HOMES PG 33
INCOME PG 11

                                                                FIGURE 2G UNLIKE OTHER
                                                                GROUPS, WHITE RESIDENTS
                                                                MOSTLY LIVE NEAR OTHER
                                                                WHITE PEOPLE PG 19
                               FIGURE 2C WHITE RESIDENTS
                               ARE OVER 5 TIMES MORE LIKELY                                                               FIGURE 4D HOUSING PRICES
                               TO LIVE IN HIGH-INCOME OR                                                                  HAVE SURGED SINCE THE START
                               AFFLUENT NEIGHBORHOODS                                                                     OF THE PANDEMIC PG 33
                               THAN BLACK AND LATINO
                               RESIDENTS PG 15
Index 2023 Community Wellbeing - GREATER NEW HAVEN
3

FIGURE 4E HIGH SHARES OF       FIGURE 5B STANDARDIZED        FIGURE 6C ACROSS SEVERAL      FIGURE 7B ALL-CAUSE          FIGURE 8B LOCAL HEALTH
BLACK AND LATINO RENTERS       TEST SCORES HAVE              OCCUPATION GROUPS, WAGE       MORTALITY SPIKED IN 2020     OFFICIALS AND HEALTHCARE
ARE BURDENED BY HOUSING        DROPPED FROM PRE-COVID        GAPS BETWEEN MEN AND          DUE TO THE CORONAVIRUS       WORKERS ARE GENERALLY
COSTS PG 33                    AVERAGES PG 41                WOMEN ARE HIGHER WITH         PANDEMIC PG 63               WELL-TRUSTED PG 70
                                                             ADVANCED DEGREES PG 50

FIGURE 4F TOWNS IN THE
OUTER RING SUBURBS HAVE                                                                    FIGURE 7C SEVERAL GREATER
THE HIGHEST AVERAGE                                                                        NEW HAVEN TOWNS HAVE HIGH
HOUSING VALUES PG 34           FIGURE 5C SIX YEARS AFTER                                   BURDENS OF PREMATURE
                               GRADUATING HIGH SCHOOL,                                     DEATH PG 63
                               ONLY HALF OF GREATER NEW      FIGURE 6D ABOUT A QUARTER
                               HAVEN PUBLIC SCHOOL           OF LATINO ADULTS IN THE
                                                             AREA LACK A HIGH SCHOOL                                    FIGURE 8C WEALTHIER TOWNS
                               STUDENTS HAVE A COLLEGE                                                                  NET MORE INCOME FROM
                               DEGREE PG 42                  DIPLOMA PG 51
                                                                                                                        PROPERTY VALUES AND OFTEN
                                                                                                                        SPEND MORE ON LIBRARIES AND
                                                                                                                        EDUCATION PG 74

                                                                                           FIGURE 7D MORTALITY DUE
                                                                                           TO COVID-19 WAS HIGHER FOR
FIGURE 4G SINCE THE EVICTION                                                               RESIDENTS OF COLOR THAN
MORATORIUM WAS LIFTED,                                                                     WHITE RESIDENTS PG 64
MONTHLY FILINGS HAVE
SURPASSED PREPANDEMIC
LEVELS PG 36                    FIGURE 5D EVEN THOUGH
                                EDUCATORS HAVE DIVERSIFIED   FIGURE 6E WHILE THE GENDER-
                                IN RECENT YEARS, TEACHERS    EDUCATION GAP AMONG YOUNG
                                OF COLOR ARE STILL VASTLY    ADULTS HAS CLOSED, RACIAL
                                UNDERREPRESENTED             AND ETHNIC DISPARITIES
                                                             PERSIST PG 53                 FIGURE 7E DRUG
                                COMPARED TO THEIR                                          OVERDOSE DEATHS HAVE         FIGURE 8D IN SOME
                                STUDENTS PG 44                                             RISEN STEEPLY PG 65          NEIGHBORHOODS, MORE THAN
                                                                                                                        1 IN 100 RESIDENTS ARE
                                                                                                                        INCARCERATED AND COUNTED
                                                                                                                        AS LIVING ELSEWHERE PG 77

FIGURE 4H MULTI-FAMILY
HOUSING MAKES UP A RISING
SHARE OF CONSTRUCTION
PERMITS PG 37
                               CHAP TER 6                    CHAPTER 7

                               Economy                       Health
                                                                                           CHAPTER 8

                               FIGURE 6A WIDE WAGE GAPS
                               EXIST BY SEX AND RACE/
                                                             FIGURE 7A HOSPITAL
                                                             ENCOUNTER RATES VARY
                                                                                           Civic Life                   FIGURE 8E BLACK RESIDENTS
                                                                                                                        MAKE UP A FAR LARGER SHARE
                               ETHNICITY, EVEN WITHIN        ACROSS THE REGION PG 61                                    OF DRIVERS SEARCHED BY
                               OCCUPATIONAL GROUPS PG 48                                   FIGURE 8A VOTER TURNOUT      POLICE THAN THEIR SHARE
                                                                                           INCREASED FROM 2016          OF THE POPULATION PG 79
                                                                                           TO 2020 AMONG ALL
                                                                                           DEMOGRAPHIC GROUPS IN
                                                                                           CONNECTICUT, ESPECIALLY
CHAP TER 5                                                                                 AMONG YOUNG PEOPLE AND
                                                                                           PEOPLE OF COLOR PG 69

Youth and
Education
                               FIGURE 6B WAGE GAPS ARE
FIGURE 5A SINCE THE START      LARGER BY RACE/ETHNICITY
OF THE COVID-19 PANDEMIC,      THAN BY SEX PG 49
CHRONIC ABSENTEEISM HAS
SKYROCKETED PG 41
Index 2023 Community Wellbeing - GREATER NEW HAVEN
DataHaven Greater New Haven Community Wellbeing Index                                                          4

CHAPTER 1

Introduction
and Community
Index
AT A GLANCE                                                and send their kids to well-funded schools.
                                                           These communities are immediately adjacent to
→ This chapter discusses the purpose of this report
                                                           others where very few people own their homes,
  and findings from the DataHaven Community Index
                                                           residents struggle with access to health care,
  and Personal Wellbeing Index, two methods we use
                                                           earn low wages, and send their kids to schools
  to measure well-being, equity, and quality of life in
                                                           with persistent funding issues.
  the region.
                                                                As has been the case across the country, the
→ Connecticut tends to rank highly on measures of         stresses of the COVID-19 pandemic exposed and
  well-being among states, reflecting a relatively high    amplified the disparities that have long existed.
  quality of life compared to the rest of the country.     Many people with high-paying jobs and
  However, these rankings often do not account for         ample resources saw shifts in the ways they
  disparity within a state.                                worked and lived, but the pandemic did not
                                                           fundamentally alter their general well-being.
→ Greater New Haven is home to some of the highest
                                                           By contrast, those who struggled before the
  and lowest scoring towns on the DataHaven
                                                           pandemic faced greater unemployment and loss
  Community Index, revealing stark inequality in the
                                                           of health insurance. Their schools were thrown
  region. It would score 41st out of 100 metropolitan
                                                           into disarray, with potentially dramatic and
  areas in the U.S. overall.
                                                           long-term effects on their children’s education.
→ High levels of personal well-being often correspond     People facing financial insecurity, and Black and
  with high levels of community well-being. As a result,   Latino1 people were more likely than wealthier
  those with fewer community resources often report        white people to get sick from COVID-19, and
  lower quality of life than those with better access to   more likely to die. Other persons living with
  resources.                                               chronic conditions and disabilities, and those in
                                                           older age groups, are also at much higher risk.
                                                                The past few years have also been a time
                                                           of national reckoning with the country’s history
Foreword                                                   of racism, with reverberations at state and local
Greater New Haven historically has been                    levels. In Connecticut, that reckoning sharpened
marked by some of the sharpest disparities in              the discussion about the generations of
the country in terms of the well-being of its              inequities in well-being, from the availability
population. Its wealthiest neighborhoods rank              of affordable housing, to support for schools,
among the most prosperous in the nation, where             to questions about health care and employment,
residents enjoy a very high quality of life. Most          to quality of life concerns about access to
of them own the home where they live, have                 safe and reliable transportation and
access to good health care, earn high salaries,            outdoor spaces.
Index 2023 Community Wellbeing - GREATER NEW HAVEN
Chapter 1 Introduction and Community Index                                                                                    5

                        The pandemic also affected data collection        and beyond, including 300 individuals who
                   for the 2020 Census, as people moved to                participated in the DataHaven Community
                   places they would ride out the initial lockdowns.      Wellbeing Survey’s Advisory Council in 2021
                   As a result, the credibility of that data was put to   and 2022. DataHaven is profoundly grateful for
                   question. However, the 2020 counts remain              their support.
                   useful for helping describe and hopefully disman-           DataHaven publishes Community Wellbeing
                   tle some of the disparities the pandemic revealed      Index reports and similar publications that cover
                   in stark clarity.                                      other regions of Connecticut. These reports as
                        Greater New Haven, like the state and             well as previous editions of the Community
                   country overall, is still in the long tail of          Wellbeing Index may be found at www.ctda-
                   recovery from the pandemic’s most acute                tahaven.org/reports.
                   effects. Locally, policymakers, state and local
                   agencies, nonprofits, and residents are more
                   aware of, more willing to talk about, and more
                                                                          Additional Connecticut Town Data
                   interested in doing something to address the
                                                                          Through its Town Equity Reports, DataHaven
                   disparities in well-being that have existed for
                                                                          publishes detailed information about individual
                   a long time. Good information is crucial to that
                                                                          towns and cities throughout Connecticut. Data
                   work. It allows us to compare our towns and
                                                                          for all towns in Connecticut are available at
                   regions to one another to see which legacies of
                                                                          ctdatahaven.org/reports/connecticut-town-
                   racially-biased systems echo those in other parts
                                                                          equity-reports. DataHaven also publishes these
                   of the country, and to determine those which are
                                                                          equity reports for other groupings of towns, such
                   regionally unique. The more we understand,
                                                                          as hospital service areas or Council of
                   the better we are at addressing inequities,
                                                                          Governments (COG) regions.
                   making sure that the benefits of recovery are
                                                                               Other user-friendly data resources at
                   felt by all, and by those who need it the most.
                                                                          DataHaven include its community and neighbor-
                                                                          hood profiles, which cover all towns, as well as
                                                                          neighborhoods within the largest cities. These
                   About This Document                                    are available at ctdatahaven.org/communities.
                                                                               The information in this report, and additional
                   The Greater New Haven Community Wellbeing
                                                                          data published by DataHaven about specific
                   Index is produced through DataHaven’s compre-
                                                                          communities within the region, also may be found
                   hensive community indicators program, which
                                                                          in community health needs assessments (CHNAs)
                   collects and shares data on well-being, equity,
                                                                          that are published on the websites of each
                   and quality of life. For the past 30 years,
                                                                          hospital in the region.
                   DataHaven has published information on an
                   ongoing basis at the statewide, regional, town,
                   and neighborhood levels. As a formal partner of
                   the National Neighborhood Indicators                   Measuring How Communities
                   Partnership, DataHaven is committed to making          Shape Well-Being
                   information more accessible to communities.
                         This report defines the region as 13 towns in    Quality of life in Greater New Haven can be
                   New Haven County: the city of New Haven, three         measured in several ways. First, we summarize
                   inner ring towns (East Haven, Hamden, and West         how Connecticut ranks among nearby states in
                   Haven), and 9 outer ring towns (Bethany,               various measures. We then use our Community
                   Branford, Guilford, Madison, North Branford,           Index to compare area towns and neighborhoods
                   North Haven, Orange, and Woodbridge). Data are         to the 100 largest metropolitan areas in the
                   also presented for specific neighborhoods within       United States across eight community-based
                   larger towns.                                          indicators. Finally, we use our DataHaven
                         This report is made possible through funding     Community Wellbeing Survey to generate our
                   from more than 100 public and private partners.        Personal Wellbeing Index, which allows us to
                   It also relies on advice from community members        compare four measures of personal well-being
                   and subject matter experts throughout the state        across specific demographic groups.
Index 2023 Community Wellbeing - GREATER NEW HAVEN
DataHaven Greater New Haven Community Wellbeing Index                                                                                                      6

Connecticut Rankings                                                       DataHaven Community Index
Connecticut, along with the rest of New                                    Scores for Local Areas
England, tends to rank highly on measures of
                                                                           The DataHaven Community Index combines
well-being, reflecting a relatively high quality
                                                                           several indicators into an average score, ranging
of life compared to the rest of the country.
                                                                           from 0 to 1,000, that allows readers to compare
However, because these rankings do not
                                                                           parts of Connecticut to one another and to other
account for disparities within a state, they
                                                                           parts of the United States. Included in the
do not accurately reflect quality of life for all
                                                                           Community Index are measures of economic,
residents. We explore these disparities by
                                                                           health-related, and educational well-being
comparing towns, neighborhoods, and specific
                                                                           (SEE TABLE 1B).
demographic groups.
                                                                                 Greater New Haven would rank 41st out
                                                                           of 100 metropolitan areas in the United States.
                                                                           This regional figure hides local disparities. When
                                                                           assessed town by town, or neighborhood by
                                                                           neighborhood, the region includes some of the
                                                                           highest and lowest scoring areas in the analysis.
                                                                           In other words, well-being disparities in Greater
                                                                           New Haven remain among the greatest in
                                                                           the country.
                                                                                 That said, between 2015 and 2020 (the
                                                                           latest year for which these data are available),
                                                                           Community Index scores have improved for most
                                                                           metropolitan areas, although for some individual
                                                                           towns and neighborhoods in the region, scores
                                                                           have declined. DH

TABLE 1A

Quality of life rankings for New England and New York
SELECTED STATE RANKINGS AND AVERAGE PLACEMENT FOR QUALITY OF LIFE INDICES

 REPORT [YEAR] - PUBLISHER          DESCRIPTION                                                                         CT   ME   MA   NH   NY   RI   VT

 Measure of America [2018] -        The distribution of well-being and opportunity in three basic dimensions: health,   3    29   2    10   6    13   17
 Social Science Research Council    access to knowledge, and living standards.

 Opportunity Index [2019] -         A composite measure that draws upon important economic, educational,                10   11   4    8    14   20   2
 Opportunity Nation                 health, and community-related indicators of opportunity.

 Quality Counts [2021] -            Measures the education of states on Chance for Success, School Finance and          3    16   2    9    8    13   6
 Education week                     K-12 Achievement.

 State Innovation Index [2020] -    Rank based on research and development intensity, productivity, clusters of         4    37   2    9    14   19   24
 Bloomberg                          companies in technology, STEM jobs, residents with degrees in science and
                                    engineering disciplines and patent activity.

 America's Health Rankings [2021]   Measures social and economic factors, physical environment, clinical care,          6    8    2    1    22   12   3
 - United Health Foundation         behaviors and health outcomes.

 Prosperity Now Outcome Ranks       Assesses states on the financial security and economic opportunity of               13   20   4    6    27   24   2
 [2020] - Prosperity Now            households; final score incorporates the state's racial disparity.

 Number of times state is ranked                                                                                        5    1    6    6    2    0    4
 among the top 10 states

 Average placement                                                                                                      7    20   3    7    15   17   9
Index 2023 Community Wellbeing - GREATER NEW HAVEN
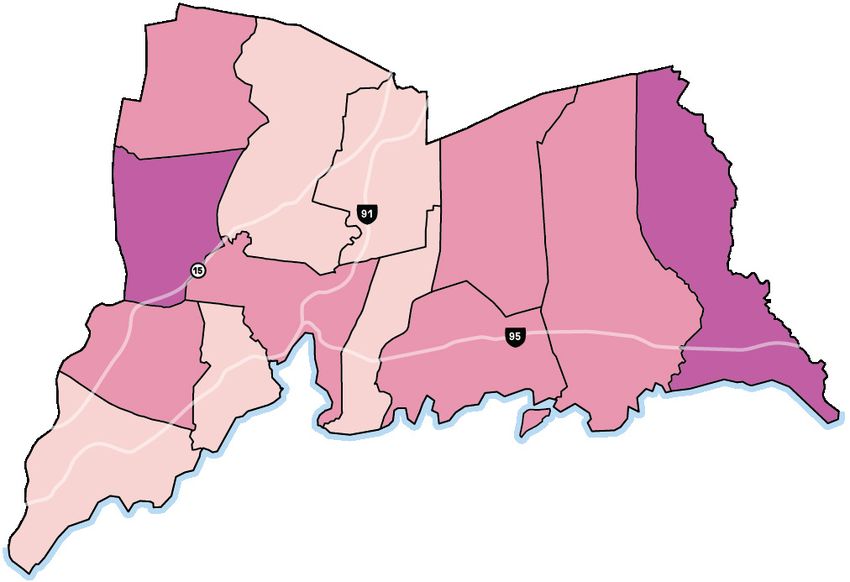
Chapter 1 Introduction and Community Index                                                                                                              7

TABLE 1B

DataHaven Community Index
SCORES FOR LARGE U.S. METROPOLITAN AREAS AND LOCAL CITIES, TOWNS, AND NEIGHBORHOODS, 2015
AND 2020

                                             2020         2015     PERCENT                                                  2020         2015     PERCENT
 RANK LOCATION                           COMM. INX.   COMM. INX.    CHANGE   RANK LOCATION                              COMM. INX.   COMM. INX.    CHANGE

      New Haven Outer Ring                     950          919       3%          New Haven high-income                      770          835       8%
                                                                                   neighborhoods

      Milford                                  925          875       6%    29    San Francisco-Oakland-Berkeley, CA         764          721       6%

 1    Ogden-Clearfield, UT                     856          789       8%    30    Palm Bay-Melbourne-                        763          698       9%
                                                                                   Titusville, Fl

 2    Minneapolis-St. Paul-                    829          787       5%          New Haven Inner Ring                       758          747       1%
      Bloomington, MN-WI

      Hamden                                   817          819       1%    35    Philadelphia-Camden-                       745          723       3%
                                                                                   Wilmington, PA-NJ-DE-MD

 3    Madison, WI                              815          767       6%    36    Nashville-Davidson-                        740          684       8%
                                                                                   Murfreesboro-Franklin, TN

 4    Washington-Arlington-Alexandria,         804          792       2%    37    Spokane-Spokane Valley, WA                 738          679       9%
      DC-VA-MD-WV

 5    Des Moines-West Des Moines, IA           802          768       4%          Greater New Haven                          729          725       1%
 6    Provo-Orem, UT                           802          739       9%    41    New Haven County, CT                       729          717       2%

 7    Salt Lake City, UT                       797          726      10%    45    Charlotte-Concord-Gastonia,                724          668       8%
                                                                                   NC-SC

      East Haven                               792          778       2%    46    Providence-Warwick, RI-MA                  719          681       6%

 8    Boston-Cambridge-Newton,                 792          765       4%    48    Atlanta-Sandy Springs-                     716          655       9%
      MA-NH                                                                        Alpharetta, GA

 9    Seattle-Tacoma-Bellevue, WA              792          748       6%    49    Deltona-Daytona Beach-Ormond               716          630      14%
                                                                                   Beach, FL

 10   Denver-Aurora-Lakewood, CO               792          733       8%    50    Columbus, OH                               715          689       4%
 11   Grand Rapids-Kentwood, MI                790          716      10%    51    Charleston-North Charleston, SC            714          670       7%

 12   Fairfield County, CT                     786          796       1%    58    Detroit-Warren-Dearborn, MI                707          665       6%
 13   San Jose-Sunnyvale-Santa                 784          753       4%    63    Tampa-St. Petersburg-                      699          650       8%
      Clara, CA                                                                    Clearwater, FL
 14   Pittsburgh, PA                           783          740       6%          United States (national avg.)              695          656       6%

 15   Omaha-Council Bluffs, NE-IA              783          736       6%    69    Dayton-Kettering, OH                       691          647       7%

 16   Baltimore-Columbia-Towson, MD            781          757       3%    72    Little Rock-North Little Rock-             685          668       3%
                                                                                   Conway, AR

 17   Boise City, ID                           779          685      14%    74    Dallas-Fort Worth-Arlington, TX            681          645       6%

 18   Hartford-East Hartford-                  779          772       1%          West Haven                                 678          654       4%
      Middletown, CT
 19   Colorado Springs, CO                     778          746       4%    80    New York-Newark-Jersey City,               666          648       3%
                                                                                   NY-NJ-PA

 20   Raleigh-Cary, NC                         778          729       7%    82    Winston-Salem, NC                          644          605       6%

 21   Worcester, MA-CT                         777          744       4%    84    Tucson, AZ                                 642          595       8%

 22   Urban Honolulu, HI                       776          750       3%    99    Fresno, CA                                 474          419      13%

      Connecticut (state avg.)                 774          770       1%          New Haven                                  389          416       6%
 23   Albany-Schenectady-Troy, NY              772          762       1%    100   McAllen-Edinburg-Mission, TX               349          322       8%

 24   St. Louis, MO-IL                         772          724       7%          New Haven low-income                       192          215      11%
                                                                                   neighborhoods
Index 2023 Community Wellbeing - GREATER NEW HAVEN
DataHaven Greater New Haven Community Wellbeing Index                                                                                       8

 FIGURE 1A

 Community Index scores vary by town within Greater New Haven
 INDEX SCORE BY TOWN, 2020

                                                                                                                            0 TO 199
                                                         HAMDEN
           BETHANY                                                                                                          200 TO 399
                                                         817          NORTH HAVEN                                           400 TO 599
                    936                                               947                                                   600 TO 799
                                                                                                                            800 TO 1,000
                                                                               NORTH BRANFORD
                                                                               900
      NEW HAVEN
                   389

                                                                                                                        MADISON
                                                                                                                        925

     WOODBRIDGE
                   991

     ORANGE
             950

MILFORD
     925

                                                                                                    GUILFORD
                                         WEST HAVEN             EAST HAVEN                          975
                                         678                    792
                                                                                     BRANFORD
                                                                                     874

                                                                                           Note: Index ranges from 0 (worse) to 1,000 (better).

                                                                                                                              INNER RING
                                                                                                                              758
      United States                 Connecticut                Greater New Haven

             695                        774                           729

                                                                                                                 OUTER RING
                                                                                                                              950
Chapter 1 Introduction and Community Index                                                                                              9

TABLE 1C

DataHaven Community Index and its components by area
LOCAL DATA VALUES AND SCORES, 2020

                           HOME-                     YOUTHFUL      WORKERS    HOUSING                CHILDHOOD
                        OWNERSHIP         H.S.    LABOR FORCE    WITH SHORT      COST   LOW INCOME     POVERTY      INSURED   2020 COMM.
 LOCATION                    RATE   GRADUATES    PARTICIPATION    COMMUTE      BURDEN   POPULATION        RATE   POPULATION          IDX.

United States                64%          89%             83%          62%       31%          30%         18%          91%           695

Connecticut                  66%          91%             86%          64%       35%          22%         13%          95%           774

Greater New Haven            60%          92%             86%          71%       39%          25%         16%          95%           729

New Haven                    28%          86%             81%          76%       51%          49%         34%          92%           389

New Haven Inner Ring         61%          91%             87%          72%       39%          24%         12%          94%           758

   East Haven                74%          91%             86%          76%       40%          24%         14%          94%           792

   Hamden                    64%          94%             88%          70%       35%          19%         10%          97%           817

   West Haven                51%          87%             86%          72%       43%          29%         14%          92%           678

New Haven Outer Ring         79%          96%             89%          66%       31%          11%          3%          98%           950

   Milford                   75%          95%             90%          68%       33%          11%          4%          97%           925

 INDIVIDUAL NEIGHBORHOODS

New Haven high-income        52%          93%             89%          76%       36%          23%          8%          94%           770
neighborhoods

New Haven low-income         21%          78%             77%          66%       58%          63%         47%          91%           192
neighborhoods
DataHaven Greater New Haven Community Wellbeing Index                                                                                                               10

  Personal Wellbeing Index                                                                 TABLE 1D

                                                                                           DataHaven Index scores
  It is important for policymakers and programs to
                                                                                           PERSONAL WELLBEING INDEX (2021) AND COMMUNITY INDEX
  measure well-being directly, because traditional                                         SCORES (2020), GREATER NEW HAVEN
  measures such as income and gross domestic
  product are unable to capture the importance of
  so many life experiences.2                                                                LOCATION             PERSONAL WELLBEING INDEX    COMMUNITY INDEX
         To fill this gap, the DataHaven Community                                          CT                   696                         774
  Wellbeing Survey conducts live, in-depth inter-
                                                                                            GNH                  704                         729
  views with thousands of randomly-selected
  adults in every Connecticut town. We find that                                            BY DEMOGRAPHIC WITHIN GREATER NEW HAVEN

  personal well-being measures—including life                                               White                744                         873
  satisfaction, self-rated health, anxiety, and                                             Black                419                         509
  happiness—correlate strongly with Community
                                                                                            Latino               562                         505
  Index scores (SEE FIGURE 1B). In other words, higher
  levels of personal well-being are associated with                                         BY TOWN

  greater levels of community well-being, while                                             New Haven            469                         389
  communities and populations with fewer                                                    West Haven           693                         678
  community resources often report lower levels
                                                                                            Hamden               456                         817
  of personal well-being. DataHaven’s Personal
  Wellbeing Index, which factors across the above
  four indicators of overall well-being, reveals
  stark inequalities by race/ethnicity and town
  (SEE TABLE 1D). DH

   FIGURE 1B

  Personal well-being tends to improve with overall community well-being
   PERSONAL WELLBEING INDEX (2021) VERSUS COMMUNITY INDEX SCORES (2020)

                                        900

                                        800
                                                                                                                                                   MILFORD
PERSONAL WELLBEING INDEX SCORE (2021)

                                        700                                                         WEST HAVEN

                                        600

                                        500
                                                      NEW HAVEN
                                                                                                                                 HAMDEN

                                        400

                                                                  400                             600                                  800   COMMUNITY INDEX SCORE (2020)

                                        CONNECTICUT       GREATER NEW HAVEN   SELECT GNH TOWNS          OTHER CT AREAS
Chapter 1 Introduction and Community Index                                                                                                         11

 FIGURE 1C
                                                                                           Life Satisfaction
 Within demographic groups, life satisfaction
                                                                                           Looking further into measures of life satisfaction,
 often varies by income                                                                    patterns begin to emerge that reinforce the
 SHARE OF ADULTS REPORTING BEING SATISFIED WITH LIFE BY                                    correlation of well-being measures with
 INCOME AND DEMOGRAPHIC GROUP, CONNECTICUT, 2015–2021
                                                                                           Community Index scores. Higher income is
                                       < $100K       ALL ADULTS       > $100K              strongly associated with higher levels of
       LIVE IN WEALTHY TOWN                                                                reported life satisfaction (SEE FIGURE 1C). Other
  COLLEGE DEGREE OR ABOVE                                                                  divisions are also clear: life satisfaction is lower
                     AGE 65+                                                               among adults ages 18 to 34 compared to those
     LIVE IN SUBURBAN TOWN                                                                 who are 65 and up; lower among adults of
                       WHITE                                                               color, especially Black adults, than white adults;
         LIVE IN RURAL TOWN                                                                lower among adults without a four-year college
                  AGE 50–64                                                                degree than those with one; and lower among
                       MALE                                                                those residing in urban core towns compared to
           BORN OUTSIDE US                                                                 wealthy towns.
                  BORN IN US                                                                    Access to food, employment, health care,
                     FEMALE                                                                and community support affect greater life
                       ASIAN                                                               satisfaction: adults with more personal
                  AGE 35–49                                                                and community resources report being more
 LIVE IN URBAN PERIPHERY TOWN                                                              satisfied (SEE FIGURE 1D). These data suggest that
  HAWAIIAN/PACIFIC ISLANDER                                                                ensuring adequate food and housing for all
                  AGE 18-34                                                                people, fostering asset building and interper-
                      L ATINO                                                              sonal connections, and reducing inequities
         NO COLLEGE DEGREE                                                                 in access to services would have a larger impact
AMERICAN INDIAN/ALASKA NATIVE                                                              on well-being than policies focused mostly on
                      BL ACK                                                               traditional economic outputs. DH
   LIVE IN URBAN CORE TOWN
                                        60%             70%             80%

 FIGURE 1D

 Many positive experiences and resources, including having a high income,
 correspond to higher life satisfaction
 SHARE OF ADULTS REPORTING BEING SATISFIED WITH LIFE BY SELECT EXPERIENCES, CONNECTICUT, 2015–2021

                          INCOME                                            LESS THAN $100K   60%                    GREATER THAN $100K       82%

              FINANCIAL STABILIT Y                   42%      JUST GET TING BY                                  FINANCIALLY SECURE      79%

              SELF-RATED HEALTH      LESS THAN VERY GOOD HEALTH       49%                                         VERY GOOD HEALTH      79%

 SUPPORT FROM FRIENDS & FAMILY            38%       DO NOT FEEL SUPPORTED                                OF TEN FEEL SUPPORTED    77%

                 FOOD INSECURIT Y      36%    FOOD INSECURE                                                            72%     CAN AFFORD FOOD

                TRUST NEIGHBORS                            45%      DO NOT TRUST NEIGHBORS                          71%      TRUST NEIGHBORS

                     EMPLOYMENT               39%     UNEMPLOYED                                                 70%      EMPLOYED

       OF TEN HAVE ACCESS TO CAR                           44%     UNRELIABLE CAR ACCESS                       69%     RELIABLE CAR ACCESS

             TIMELY MEDICAL CARE                       43%       MISSED MEDICAL CARE                           69%     RECEIVED CARE WHEN NEEDED
CHAPTER 2

Population
Chapter 2 Population                                                                                                                    13

                                                                             TABLE 2A
                   AT A GLANCE
                                                                             Population and growth
                   → This chapter provides a brief overview of the
                                                                             POPULATION IN GREATER NEW HAVEN AND
                       population of Greater New Haven, including            TOWNS, 2010–2020
                       demographic trends in recent decades.

                   → Greater New Haven has large immigrant                                POPULATION,   POPULATION,     CHANGE,   PERCENT
                                                                             LOCATION            2010          2020    2010–2020    CHANGE
                       communities from the Americas, Asia, Europe,
                       and Africa. Between 2000 and 2020, the share          Connecticut    3,574,097     3,605,944     31,847     0.9%

                       of foreign-born residents in Greater New Haven        GNH             463,998       465,241       1,243     0.3%
                       increased from 9 percent to 14 percent of the         Bethany            5,563         5,297       266      4.8%
                       total population.
                                                                             Branford          28,026        28,273       247      0.9%
                   → The region is highly segregated, with only 4 percent   East Haven        29,257        27,923      1,334     4.6%
                       of the population living in a neighborhood that is
                                                                             Guilford          22,375        22,073       302      1.3%
                       both high income and high diversity.
                                                                             Hamden            60,960        61,169       209      0.3%

                                                                             Madison           18,269        17,691       578      3.2%

                   Population Change                                                                                      715      1.4%
                                                                             Milford           52,759        52,044

                                                                             New Haven       129,779       134,023       4,244     3.3%

                                                                             N. Branford       14,407        13,544       863      6.0%
                   Greater New Haven has an overall population
                                                                             North Haven       24,093        24,253       160      0.7%
                   of 465,241.3 While the state population grew
                   0.9 percent over the past decade, Greater New             Orange            13,956        14,280       324      2.3%

                   Haven’s population increased 0.3 percent. With            West Haven        55,564        55,584        20     
DataHaven Greater New Haven Community Wellbeing Index                                                                                        14

TABLE 2B

Characteristics by race and origin
POPULATION BY RACE/ETHNICITY AND PLACE OF BIRTH, GREATER NEW HAVEN, 2020

                             TOTAL   PERCENT          PERCENT       PERCENT        PERCENT          PERCENT        FOREIGN-BORN   PERCENT
 LOCATION 0.008 IN      POPULATION   WHITE            BLACK         LATINO         ASIAN            OTHER RACE       POPULATION   FOREIGN BORN

 Connecticut             3,605,944   63%               10%               17%        5%               5%                 521,384     15%

 Greater New Haven         465,241   58%                   16%           17%        6%              4%                   63,573     14%

 New Haven                 134,023   28%              30%           31%             7%               5%                  22,702      17%

 New Haven Inner Ring      144,676   54%                    19%          18%        5%              4%                   22,175     15%

   East Haven               27,923   70%               5%                18%       4%               3%                    3,675     13%

   Hamden                   61,169   53%                    24%          13%        6%              4%                    7,773     13%

   West Haven               55,584   47%                    21%              24%    5%              4%                   10,727      20%

 New Haven Outer Ring      186,542   83%              2%                6%          5%              4%                   18,696    10%

   Milford                  52,044   80%              3%                8%          5%              4%                    6,406     12%

FIGURE 2A

Since 1980, the region has diversified greatly
SHARE OF POPULATION BY RACE/ETHNICITY, 1980–2020
Chapter 2 Population                                                                                                        15

FIGURE 2B

Younger generations are much more racially diverse than older ones
POPULATION BY RACE/ETHNICITY AND AGE, GREATER NEW HAVEN, 2020

                                                                                         2K        1K               OTHER RACE
             5K                  11K                       11K
 2K                                                                                                2K               LATINO
                                                                                         3K                         BLACK
                                                                                                                    WHITE
                                                           25K                                     3K
                                                                                         5K
                                 22K
            18K
 7K

                                                           29K

                                 21K

            14K
 5K

                                                                                                   28K
                                                                                         35K

                                                           110K
                                 63K
            31K
 10K

  AGE         AGE                AGE                       AGE                           AGE        AGE
  0–4         5–17               18–34                     35–64                         65–74      75+

FIGURE 2C

White residents are over 5 times more likely to live in high-income or affluent
neighborhoods than Black and Latino residents
SHARE OF POPULATION BY NEIGHBORHOOD INCOME LEVEL, GREATER NEW HAVEN, 2020
DataHaven Greater New Haven Community Wellbeing Index                                                                             16

Households                                              Immigration
In 2020, Greater New Haven had a total of 176,463       Between 2000 and 2020, the share of foreign-
households, a 2 percent increase from 2000.             born residents in Greater New Haven increased
Households of single individuals increased              from 9 percent to 14 percent of the total
the most, growing 6 percent from about 50,600           population.5 Communities from Mexico, the
in 2000 to 53,700 in 2020.4 The rise of nonfamily       Dominican Republic, Ecuador, India, and China
households occurred in tandem with a decline            saw the largest population increases. There
in homeownership. These trends may have a               was also a notable increase in the number of
causal relationship as those who live alone are         residents born in African nations (SEE FIGURE 2E).
less likely to be able to afford to own a home.              Greater New Haven’s increasing diversity
In 2020, about 57 percent of nonfamily house-           is due in part to this shift in immigration.
holds in the region were renters, while only 30         Thirty-six percent of New Haven County’s
percent of family households were renters.              immigrants who came to the U.S. before 1990
     Greater New Haven has a lower share                were born in Europe, while among immigrants
of family households than the state overall: 62         who entered in 2010 or later, only 12 percent
percent of households in Greater New Haven are          were born in Europe. Instead, recent immigration
families, compared to 65 percent in the state.          has shifted to people born in Asia, making up
Greater New Haven has a higher share of single          46 percent of immigrants entering in 2010 or
person households. Compared to Connecticut,             later. Large communities of recent immigrants
where 28 percent of households have one person,         currently live in New Haven, as well as in West
30 percent of households in Greater New Haven           Haven and Hamden. DH
have one person (SEE FIGURE 2D). DH

FIGURE 2D

The majority of New Haven's households are nonfamily households
SHARE OF HOUSEHOLDS BY HOUSEHOLD TYPE, 2020

            15%                                                                                              O THER HOUSEHOLDS
                                          17%                                                                 LIVING ALONE
                                                                         23%
                                                                                                             S INGLE, W/ CHILDREN
                                                                                                              M ARRIED, NO CHILDREN
                                                                                                             M ARRIED, W/ CHILDREN

            28%
                                          30%

                                                                         37%
            8%
                                          10%

            29%                                                          15%
                                          27%

                                                                         14%

            18%                           16%
                                                                          11%

       CONNECTICUT                  GREATER NEW HAVEN                  NEW HAVEN
Chapter 2 Population                                                                                                                                                                17

FIGURE 2E

New Haven County's foreign-born population has been changing over time
NUMBER OF NEW HAVEN COUNTY RESIDENTS BY PLACE OF BIRTH, 2000 AND 2020

                                                                                                                                                 6

               7
                                                                                3
                                                                                            7    2
                                                                                    9
                                                                                            1
                                                                            4                    5
                                                                                                     8                                                         3
                                                                                                                           7                         1
                                                                            2
                                                                                                                               6
                                  14                                                                                               2
                    1
                                       3 9       2
                           8 12                                                                                                                           4
                           11                        16                                                                                              5
                                                                                1       3
                                                      10
                                            5
                                       4
                                       13
                                                             6

                                            15                                                                                                                       1

  AMERICAS                                                        AFRICA
                         2000              2020 CHANGE                                           2000      2020 CHANGE
     Americas           24,174     49,980              +107%         Africa                      2,401     8,522   +255%               EUROPE
  w Mexico              4,371             8,940       +105%      w Ghana                           362   1,853   +412%                                       2000      2020 CHANGE
  e Dominican           2,428             6,187       +155%      e Morocco                         163   1,236   +658%                  Europe              31,021 23,891      -23%
    Republic
                                                                  r Nigeria                         473    784     +66%               w Italy                 6,691 4,092       -39%
  r Jamaica             3,137             6,080           +94%
                                                                     Remainder                   1,403     4,649   +231%               e Poland                4,266 2,685       -37%
    Ecuador
  t                     2,075             5,827       +181%
                                                                                                                                       r United Kingdom        2,899 2,502       -14%
    Colombia
  y                     1,687             3,424       +103%
                                                                                                                                       t Portugal              3,539 2,201       -38%
    Brazil
  u                     1,434             3,295       +130%
                                                                                                                                       y Albania               1,473 2,165       +47%
    Canada
  i                     2,944             2,846            -3%
  o Guatemala            553              2,007       +263%
                                                                  ASIA                                                                 u Russia                1,185     1,629   +37%
                                                                                                                                       i Germany               2,518     1,541   -39%
  p Haiti                374              1,664       +345%                                     2000      2020 CHANGE
                                                                     Asia                       17,325 27,238       +57%               o Greece                    758    885    +17%
  a Guyana              1,076             1,312           +22%
                                                                  w China                        3,489     6,685    +92%               p France                    545    745    +37%
    El Salvador
  s                      188              1,013       +439%
                                                                  e India                        3,388     6,602    +95%                  Remainder            7,147     5,446   -24%
    Honduras
  d                      150               989        +559%
                                                                  r Korea                        1,620     1,939    +20%
       Peru               495               956            +93%
                                                                  t Philippines                  1,715     1,725     +1%
       Cuba               707               944            +34%
                                                                  y Vietnam                          919   1,230    +34%
       Chile              301               805        +167%
      Trinidad           355               743        +109%
                                                                  u Pakistan                     1,377     1,146    -17%               OTHER
       and Tobago                                                 i Afghanistan                      66     794 +1,103%                                        2000      2020 CHANGE
     Remainder           1,899             2,948           +55%      Remainder                   4,751     7,117   +50%                w Oceania                  126    185    +47%
DataHaven Greater New Haven Community Wellbeing Index                                                                                          18

FIGURE 2F

Very few neighborhoods have both high incomes and high levels of
diversity
HIGH/LOW CLASSIFICATION OF MEAN HOUSEHOLD INCOME AND RACIAL/ETHNIC DIVERSITY BY CENSUS
TRACT, GREATER NEW HAVEN, 2020

                                                                                                                                       LOW    HIGH
                                                                                                                                     INCOME INCOME

                                                                                                                             HIGH
                                                                                                                         DIVERSITY

                                                                                                                              LOW
                                                                                                                         DIVERSITY

                                                                                                                          SIMILAR
                                                                                                                     TO REGIONAL
                                                                                                                         AVERAGE

OVERALL CHARACTERISTICS OF NEIGHBORHOODS BY INCOME-DIVERSITY CLASSIFICATION, GREATER NEW HAVEN, 2020

                                          TOTAL   AVG HOUSEHOLD                                                                       PERCENT
 CLASSIFICATION                      POPULATION          INCOME   PERCENT WHITE   PERCENT BLACK   PERCENT LATINO   PERCENT ASIAN      OTHER RACE

   Lower income, lower diversity         24,855         $79,628   80%              5%              10%             3%                  2%

   Lower income, higher diversity       156,824         $62,334         26%       34%             33%              3%                  3%

   Higher income, lower diversity       158,193        $137,141   86%             3%               5%               5%                 2%

   Higher income, higher diversity       20,042        $129,208   59%               13%             12%              12%               3%

   Similar to regional avg              103,178        $113,259   66%               11%             12%             8%                 3%
Chapter 2 Population                                                                                                                       19

                   FOCUS: SEGREGATION
                                                                                 In contrast, the average Latino person lives in a
                   Segregation is a major force in determining where people      neighborhood that is 32 percent Latino, and the
                   live, who they come in contact with, where they go to         average Black resident lives in a neighborhood that is
                   school, and what resources are available to them, but         36 percent Black, giving them exposure to much more
                   can be hard to define and measure.6,7,8 Measurements          racial diversity.21 Similarly, higher-income people
                   of segregation can describe regional patterns or local        more often live near people of similar incomes, while
                   ones;9 they can focus on how much one group fits in           people with lower incomes have neighbors of a wider
                   with others, or how multiple groups integrate together;10     variety of income levels.
                   they can mean different things in different contexts.11
                                                                                 One way to visualize segregation is to identify “hotspots”
                   The dynamics of segregation are complex,12 but the            or “cold spots” by certain factors. An income hotspot
                   processes and policies that create it are often               occurs where neighborhoods adjacent to each other all
                   detrimental. 13,14
                                        The long and wide-reaching history       have much higher median household incomes than the
                   of segregation has left us with disparities in access to      rest of the area. Likewise, a cold spot is a cluster of
                   health care and jobs, quality of schools,15 ease of           neighborhoods all with much lower incomes.22
                   transportation, and exposure to environmental hazards
                                                                                 We calculated a diversity index to quantify the extent
                   and violence.16 There can also be benefits, such as
                                                                                 to which people living in an area are from different
                   strong social cohesion and community supports for
                                                                                 racial and ethnic groups. Large swaths of New Haven's
                   members of minority or immigrant enclaves.17
                                                                                 Outer Ring suburbs are clusters of very high incomes
                   Connecticut is highly segregated, particularly by race        and very low racial diversity. Only 4 percent of Greater
                   and income. Previous research by DataHaven found              New Haven’s population lives in a neighborhood that is
                   that Connecticut’s concentrations of wealth and               both high income and high diversity. Thirty-four percent
                   poverty rival some of the most segregated metro areas         live in neighborhoods that are low income and high
                   in the U.S.18 Even as the state diversifies, inequality has   diversity, including most of New Haven and bordering
                   become more pronounced.19                                     neighborhoods in Hamden and West Haven, while 34
                                                                                 percent live in high income, low diversity areas.
                   Segregation can lead to a lack of resources in
                   some neighborhoods. It can also mean advantaged               No one number can fully capture the dynamics of our
                   groups miss out on the benefits of a more diverse             neighborhoods, but simplified views like this can help
                   community. The degree to which white residents                set up a framework for understanding the histories
                   are isolated from people of other backgrounds sets            and patterns of many of the other issues we focus on
                   them apart from other racial groups: within Greater           in this document.
                   New Haven, the average white person lives in a
                   neighborhood20 where 73 percent of their neighbors
                   are also white.

FIGURE 2G

Unlike other groups, white residents mostly live near other white people
AVERAGE RACIAL/ETHNIC MAKEUP OF A RESIDENT’S NEIGHBORS, GREATER NEW HAVEN, 2020

Neighborhood where the average ... lives                                                                                    RACE/ETHNICIT Y
                                                                                                                            OF NEIGHBORS
                                                                                                                                OTHER RACE
                                                                                                                                ASIAN
                                                                                                                                LATINO
                                                                                                                                BLACK
                                                                                                                                WHITE

   WHITE RESIDENT                  BLACK RESIDENT                  LATINO RESIDENT              ASIAN RESIDENT
CHAPTER 3

Economic Security
Chapter 3 Economic Security                                                                                               21

                  AT A GLANCE                                               Economic Security
                  → Income inequality has increased in Greater New
                     Haven since 1980, as median incomes of higher-
                                                                            and Well-Being
                     income towns increased more than median incomes
                                                                            Being economically secure involves more than
                     of lower-income towns.
                                                                            just having money; it requires having a stable
                  → Poverty rates are higher for households with           income and the means to secure and maintain a
                     children, single-parent households, and female-led     job. Recent events—like the Great Recession and
                     households. Single-parent households led by women      the COVID-19 pandemic—have exposed how
                     under 25 have the highest poverty rates.               fragile economic security has been for many
                                                                            families. At the same time, economic security is
                  → Connecticut saw an uptick in food insecurity over
                                                                            threatened by gradual social changes like rising
                     the past year, as pandemic relief programs ended
                                                                            prices and the replacement of full-time jobs by
                     and food prices surged. Food prices in Greater New
                                                                            temporary ones.23
                     Haven exceed those in the nation.
                                                                                 We begin in this chapter by tracing income
                  → Greater New Haven has large income and race            inequality and segregation in Greater New
                     disparities in vehicle and internet access. Higher     Haven. Then, we examine variations in poverty
                     shares of Black and Latino households do not have      rates by family type, identifying segments of
                     access to a vehicle. While most households have        the population that are under greater economic
                     broadband internet access, about 25 percent of         duress. Next, we look at resources that pertain
                     households making less than $50,000 per year still     to economic security, including access to food,
                     lack a broadband connection.                           transportation, and broadband internet. As an
                                                                            increasing number of jobs require that employees
                  → Levels of debt in New Haven County vary widely by
                                                                            work remotely, broadband internet and computer
                     race and ethnicity. While about 16 percent of adults
                                                                            access have become more important for partici-
                     in majority-white ZIP codes have some form of debt
                                                                            pation in the workforce. Finally, we compare
                     in collections, roughly 38 percent of adults in
                                                                            levels of wealth and debt by race and ethnicity,
                     majority-Black and Latino ZIP codes do.
                                                                            focusing on the implications of student debt for
                                                                            upward mobility.
                                                                                 The subject of economic security is particu-
                                                                            larly relevant to Greater New Haven, where
                                                                            income inequality and energy, food, and housing
                                                                            costs have risen. DH
DataHaven Greater New Haven Community Wellbeing Index                                                              22

Income                                                  FIGURE 3A

                                                        Median incomes have risen steeply
Greater New Haven had a median household                in higher-income towns
income of $78,000 in 2020, about $2,000 lower           MEDIAN HOUSEHOLD INCOME IN 2020 DOLLARS, GREATER NEW
than Connecticut but $13,000 higher than the            HAVEN, 1980–2020
U.S. overall. Since 1980, inflation-adjusted
median household income grew 33 percent                                                         $104K OUTER RING
in Greater New Haven and 26 percent in
Connecticut. However, income segregation                                                        $96K MILFORD
is growing: while median incomes in Outer Ring
towns grew by 36 percent, median incomes in
other areas only increased by 22 percent. In
                                                                                                $80K CONNECTICUT
2020, Greater New Haven was ranked 94th in                                                      $79K HAMDEN
income inequality among 384 metropolitan                 $77K                                   $78K GREATER NEW HAVEN

areas in the country (SEE FIGURE 3A).24                                                         $71K INNER RING
                                                         $70K
     Another way to look at income is in the                                                    $68K EAST HAVEN
aggregate, as the sum of household incomes.              $63K                                   $64K WEST HAVEN
                                                         $63K
Income concentrations differ by race, ethnicity,         $58K
                                                         $58K
and geography in ways that are important to              $58K
                                                         $54K
economic development. For example, New Haven
has the highest share of Black and Latino income
                                                                                                $45K NEW HAVEN
of any town in the region: 48 percent of aggregate
income among Black households and 42 percent
                                                         $37K
of income among Latino households is earned by
New Haven residents. DH
                                                                    1980                 2020
Chapter 3 Economic Security                                                                                                                     23

FIGURE 3B

Female householders under age 25 have the
                                                                                               Poverty
highest poverty rate                                                                           Greater New Haven has a poverty rate of
POVERTY RATE BY FAMILY TYPE AND AGE OF HOUSEHOLDER,                                            11 percent, lower than the U.S. poverty rate of
GREATER NEW HAVEN, 2020                                                                        13 percent.25 The prevalence of poverty, however,
                                                                                               varies widely among towns. Milford’s poverty
                                                                       AGE OF
                               39%                                     HOUSEHOLDER             rate is 4 percent. New Haven’s poverty rate is
                                                                           UNDER 25
                                                                                               over six times higher at 25 percent.
                                                                          25–44
                                                                          45–64                      Poverty rates also vary considerably by
                                                                          65+                  family composition and demographic character-
                                                                                               istics. In the region, both married couples with
                                     28%                                                       children and single parents are more likely to
                                                                                               live in poverty. Children are also more likely to
                                                                                               live in poverty than adults are. In the region
                                                         21%                                   overall, 20 percent of children under 6 years
                                                                                               old lived in poverty in 2020. In New Haven, 40
                                           17%                                                 percent of children in the same age group did.
    15%                                                                                        Among single-parent households, the poverty
                                                                 12%                           rate for female-led families is 27 percent while
                                                                       9%                      the poverty rate for male-led families is 15
                                                 8%                                            percent. Finally, poverty rates are higher for
                                                                                               younger house­holders. In Greater New Haven,
              5%                                                              4%
                   2% 3%                                                                       the poverty rate for householders under 25 is 42
                                                                                               percent, higher than the rate for householders
               MARRIED                  FEMALE            MALE HOUSEHOLDER,                    ages 25–44 (13 percent) and householders over
                                     HOUSEHOLDER,             NO SPOUSE
                                      NO SPOUSE                                                44 (10 percent) (SEE TABLE 3A, FIGURE 3B). DH

TABLE 3A

Poverty and low-income rates
POVERTY AND LOW-INCOME (
DataHaven Greater New Haven Community Wellbeing Index                                                            24

Food Security                                           FIGURE 3C

                                                        As pandemic relief programs fade, Black
In 2022, a higher share of Connecticut residents        and Latino adults and adults who live with
reported experiencing food insecurity—not               children are hit hard by food insecurity
having enough money to buy food for themselves          SHARE OF ADULTS REPORTING FOOD INSECURITY BY RACE/
or their families—compared to 2021.26 This              ETHNICITY AND PRESENCE OF CHILDREN, CONNECTICUT,
uptick, reflecting the diminishing of pandemic          2015–2022
relief programs, was higher for Black and Latino
adults and for adults who have children at home                 RACE/
                                                                ETHNICITY
(SEE FIGURE 3C). Additional data on food insecurity                                               34%    LATINO
are available for the region and each town in our
town equity reports, available at ctdatahaven.
org/reports/connecticut-town-equity-reports.
                                                                            28%
      Food insecurity may continue to increase if                                    27%
                                                         26%                                             BLACK
inflation drives up living costs. Between August                                                  25%
2021 and August 2022, the rate of food-cost              24%                23%
inflation outpaced overall inflation. While the                                      22%
                                                                                           21%
consumer price index increased 8.3 percent
over that period, overall food costs increased                                                           TOTAL
                                                                                                  17%
11.4 percent and the cost of groceries increased                                           16%
13.5 percent.27 Even before these recent rises,
                                                                            13%      13%
prices in Connecticut were higher than the               12%
national average. While the average cost of a                                                     11%    WHITE
                                                         10%                10%            10%
meal in the U.S. was $3.25 in 2020, the average                                      9%
cost of a meal was higher in New Haven County                                              6%
at $3.77.28
      Persons who experience food insecurity
are two to three times more likely to have
                                                         2015               2018    2020   2021   2022
diabetes. As a result of food policies and other
structural factors, healthy food options that
are lower in saturated fats, sugar, and sodium
often cost more and are more difficult for                      CHILDREN
families to access.29 DH                                        IN HOME

                                                                                                         KIDS
                                                                                                  23%    IN HOME

                                                                            17%      17%          17%    TOTAL
                                                        15%
                                                                                                  14%    NO KIDS
                                                        12%                 13%      13%
                                                                                           12%
                                                         11%                11%      11%   10%
                                                                                            9%

                                                         2015               2018    2020   2021   2022
Chapter 3 Economic Security                                                                                                        25

                    Transportation                                         Internet Access
                    Many Greater New Haven residents lack adequate         Broadband internet access enhances families’
                    access to transportation. According to the 2021        employment and educational opportunities
                    DataHaven Community Wellbeing Survey, 14               and connects them to their communities.
                    percent of residents in the region stayed home         Although broadband access has increased over
                    in the last year because they did not have reliable    the past several years, it still varies by income.
                    transportation. The rate of transportation             Among households in Greater New Haven that
                    insecurity was 23 percent for those who did not        earn less than $50,000 per year, 25 percent—or
                    attend college and 34 percent for adults making        15,000 households—still do not have access
                    less than $30,000 per year.30 According to Census      to broadband internet. Meanwhile, only 5 percent
                    data, vehicle availability varies by race and          of households making more than $50,000 do
                    ethnicity and by the number of workers in the          not have internet access. Given employers’
                    home. Among households with at least one               continuing expectations that workers can work
                    working-age member but without any employed            from home, internet access will only become
                    members, 69 percent of Black households and            more vital to workforce participation in the
                    47 percent of Latino households had no access          future (SEE TABLE 3C). DH
                    to a vehicle. Only 33 percent of white households
                    in this group lacked vehicle access. In many
                    parts of Greater New Haven, having access to a
                    vehicle is needed to find and keep a job. Racial
                    disparities in access to a vehicle may therefore
                    exacerbate racial disparities in employment rates
                    and income levels (SEE TABLE 3B, FIGURE 3D). DH

FIGURE 3D

Higher shares of Black and Latino Households do not have access to a vehicle
SHARE OF HOUSEHOLDS WITHOUT VEHICLE ACCESS BY NUMBER OF WORKERS AND RACE/ETHNICITY OF HEAD OF
HOUSEHOLD, GREATER NEW HAVEN, 2020
                                                                                                                          WHITE
                                           69%                                                                            BLACK
                                                                                                                          LATINO
                                                                                                                          ASIAN

                                                  47%

                                                        37%
                                     33%

             23%
                                                                          21%
                                                                                      18%
                    16%                                                         16%

                             11%
                                                                                                                          3%
      6%                                                           6%                            1%      8%     7%

            ALL HOUSEHOLDS                 NO WORKERS                     1 WORKER                    2 OR MORE WORKERS
DataHaven Greater New Haven Community Wellbeing Index                                                                                                   26

TABLE 3B

Financial security
SHARE OF ADULTS, GREATER NEW HAVEN, 2021

 LOCATION                       JUST GETTING BY           NEGATIVE NET WORTH        FOOD INSECURE        TRANSPORTATION INSECURE   LIMITED CAR ACCESS

 Connecticut                    26%                       14%                       11%                  13%                       10%

 GNH                            26%                       16%                       13%                  14%                       14%

 BY DEMOGRAPHIC WITHIN GREATER NEW HAVEN

 Male                           25%                       13%                       11%                  15%                       13%

 Female                         29%                       19%                       15%                  14%                       13%

 Ages 18-34                     29%                       20%                       20%                  22%                       14%

 Ages 35-49                     26%                       22%                       13%                  12%                       13%

 Ages 50-64                     28%                       16%                       12%                      9%                    10%

 Ages 65+                       23%                          7%                       5%                        10%                16%

 White                          21%                       13%                          8%                       10%                    9%

 Black                          38%                       27%                       20%                  23%                       23%

 Latino                         33%                       24%                       28%                  23%                       16%

 High school or less            43%                       20%                       26%                  23%                       26%

 Some college or Associate's    33%                       17%                       16%                  14%                       14%

 Bachelor's or higher           15%                       14%                         5%                 11%                          7%
Chapter 3 Economic Security                                                                                                   27

                    Wealth                                                   and Latino ZIP codes have debt held by a collec-
                                                                             tions agency.35 In majority-white ZIP codes, on the
                    Wealth allows families to live healthy and               other hand, only 16 percent of adults have debt in
                    prosperous lives and provides a safety                   collections. The racial debt gap in the U.S. is
                    net against unemployment and unforeseen                  smaller but still significant: 35 percent of adults
                    calamities. Home values, the largest source              living in majority-Black and Latino ZIP codes
                    of wealth in the U.S., give some insight into            and 22 percent of adults living in majority-white
                    wealth differences among families, as                    ZIP codes have debt. Student loan debt is more
                    home equity is a key driver of racial wealth             prevalent in majority-Black and Latino ZIP codes.
                    disparities.31 In 2019, the median wealth of white       In Greater New Haven, 11 percent of adults in
                    households was about eight times greater than            majority-Black and Latino ZIP codes have
                    that of Black households and almost five times           student loan debt, while 4 percent of adults in
                    greater than that of Latino households.32                majority-white ZIP codes do. These data support
                         The median home value among white                   the rationale behind debt-relief proposals at the
                    homeowners in Greater New Haven was $280,000,            federal level, as forgiving this debt may reduce
                    while median home value among Black and Latino           racial wealth gaps in the long term. In addition to
                    householders was $200,000. Moreover, studies             having greater prevalence of debt, Black and
                    have shown that white-owned homes appreciate             Latino regions also have higher rates of default
                    at a higher rate than Black and Latino-owned             on loans. Delinquent debt can negatively affect
                    homes, a phenomenon related to biases among              a person’s credit score, which further limits
                    appraisers and white homebuyers against Black            the ability to acquire mortgages, small business
                    and Latino neighborhoods.33,34                           loans, or other lines of credit. In Greater New
                         Debt restricts families’ ability to build wealth    Haven, 7 percent of adults in majority-Black
                    and is disproportionately concentrated in Black          and Latino ZIP codes and 2 percent of adults in
                    and Latino communities. In New Haven County,             majority-white ZIP codes have delinquent credit
                    38 percent of adults who live in majority-Black          card debt (SEE FIGURE 3E). DH

FIGURE 3E

Residents of majority non-white neighborhoods are more likely to have debt in
collections
SHARE OF RESIDENTS WITH DEBT IN COLLECTIONS BY MAJORITY RACE/ETHNICITY OF ZIP CODE, 2021
                                                                                                                         US
                                                                                           38%       38%                 CT
                                                                                                                        N EW HAVEN
                                                                                  35%                                    COUNTY

            26%
                                  24%
                      22%                      22%

                                                          16%          16%

                  ALL ZIP CODES                      MAJORIT Y WHITE                MAJORIT Y NON-WHITE
                                                       ZIP CODES                        ZIP CODES
CHAPTER 4

Housing
Chapter 4 Housing                                                                                                            29

                    AT A GLANCE                                               Housing and
                    → The homeownership rate in Greater New Haven
                      peaked in the mid-2000s and has declined since.
                                                                              Well-Being
                    → Gaps in homeownership rates by race and income         For centuries, privileged groups have discrimi-
                      remain large and may be expanding. In the region,       nated against low-income and minority residents
                      the homeownership rate among white households           in the arena of housing in the United States.
                      (72 percent) was almost double that of Black            White residents have used racial covenants,
                      (36 percent) and Latino (32 percent) households.        redlining, and zoning regulations to exclude
                                                                              Black and other people of color from high-quality
                    → In New Haven County in 2021, Black and Latino
                                                                              housing and the resources available in neighbor-
                      mortgage applicants were more than twice as
                                                                              hoods where desirable homes tend to be
                      likely as white applicants to have their applications
                                                                              located.36 These resources include access
                      rejected on the basis of either credit score or
                                                                              to better education, a safe neighborhood, and
                      debt-to-income ratio. These differences are not
                                                                              higher paying jobs.37
                      accounted for by household incomes.
                                                                                   Recognizing the profound relationship
                    → Home prices, rents, and evictions have spiked in       between housing and well-being, we focus in
                      recent months, following national trends. The cost      this chapter on several aspects of housing access
                      to rent an apartment or house in New Haven County       and affordability. First, we contextualize trends
                      increased 21 percent from June 2020 to June 2022.       in homeownership and outline the factors that
                                                                              contribute to racial and income disparities
                    → The supply of new housing is limited due to zoning
                                                                              in homeownership and home values. Turning to
                      laws and the low rate of housing construction.
                                                                              housing affordability, we discuss the recent spike
                                                                              in the cost of housing and some consequences
                                                                              of rising rents. Finally, we address the declining
                                                                              rate of housing construction and the housing
                                                                              supply shortage.
                                                                                   Many of the problems pertaining to housing
                                                                              in Connecticut are amplified in Greater New
                                                                              Haven, where there is a higher level of income
                                                                              and wealth inequality and a shortage of afford-
                                                                              able homes. Homeowners’ efforts to prevent
                                                                              the construction of affordable housing through
                                                                              zoning ordinances and historical preservation
                                                                              laws worsen these issues.38 DH
DataHaven Greater New Haven Community Wellbeing Index                                                                                     30

Homeownership                                                  The towns in Greater New Haven vary widely
                                                         by average home value, with towns in the outer
American families accumulate wealth primarily            suburbs boasting average property values above
through homeownership, and housing accounts              $500,000. Home values in the region also vary
for over 40 percent of all household wealth in the       by the race and ethnicity of homeowners:
United States.39 Homeownership can have                  white-owned homes are worth 40 percent more
economically harmful consequences—many                   than Black- and Latino-owned homes. These
families went into foreclosure after the housing         disparities are partly driven by biases among
market collapse of 2008—but it generally                 prospective homeowners and home appraisers
facilitates upward mobility.40 In addition to building   (SEE FIGURE 4A, FIGURE 4F).44,45
savings through mortgage payments, owning a                    Another reason for racial and income
home qualifies homeowners for tax benefits,              disparities in home values and homeownership
such as the ability to deduct mortgage insurance         is that mortgage applicants’ debt levels and
payments. In 2017, U.S. homeowners saved a               credit profiles vary along demographic lines.
total of $71 billion through such deductions.41          In New Haven County in 2021, Black and Latino
      The U.S. government has used a range               applicants were more than twice as likely as
of policy measures to expand homeownership               white applicants to have their applications
access to more American families. These have             rejected on the basis of either credit score or
included keeping mortgage interest rates                 debt-to-income ratio. These differences are not
low and backing third-party loans through                accounted for by household incomes: 7 percent
government-sponsored entities. As a result, the          of white applicants with annual household
homeownership rate in the United States steadily         incomes below $70,000 had their mortgage
increased from 1990 until the mid-2000s.42 Since         applications denied, compared to 12 percent
then, however, the homeownership rate has                of Black applicants and 11 percent of Latino
declined. Between 2010 and 2020, homeowner-              applicants in the same income group. Similar
ship in Greater New Haven fell from 64 to 60             disparities are seen across all income groups.
percent, due in part to stricter mortgage lending        Among those making more than $120,000 per
requirements, stagnant incomes, and increased            year, white applicants had a rejection rate of
debt, especially from student loans (SEE TABLE 4A).43    3 percent, while Black and Latino applicants
      This trend has widened already large               had rejection rates of 6 percent (SEE FIGURE 4B). DH
homeownership gaps in Greater New Haven.
While the homeownership rate in the city of
New Haven fell from 32 to 28 percent between             FIGURE 4A
2010 and 2020, the homeownership rate in the
outer suburbs went from 82 to 79 percent.
                                                         Housing values vary substantially by race
In Orange, one of the wealthiest towns in the            MEDIAN HOUSING VALUE BY RACE/ETHNICITY OF HEAD OF
                                                         HOUSEHOLD, GREATER NEW HAVEN, 2020
region, the homeownership rate stayed the
same at 90 percent (SEE TABLE 4A).
                                                                                                                                       $325K
      Homeownership rates in Greater New Haven                                               $310K
vary by race, ethnicity, and income. The rate            $275K   $280K                                           $280K
                                                                                                         $270K
among white households (72 percent) is
double that of Black households (36 percent)
                                                                                  $215K
and more than double that of Latino households                            $200K                                          $200K $200K
(32 percent), and the rate among households in
the bottom 20 percent of the region’s income
distribution (32 percent) is less than half that
of households in the top 20 percent (91 percent)
(TABLE 4A, FIGURE 4C).

                                                                     CONNECTICUT                                  GREATER NEW HAVEN

                                                            TOTAL        WHITE     B LACK           LATINO      ASIAN
You can also read