Individual distinctiveness across call types of the southern white rhinoceros (Ceratotherium simum simum)
←
→
Page content transcription
If your browser does not render page correctly, please read the page content below
Journal of Mammalogy, XX(X):1–17, 2021
DOI:10.1093/jmammal/gyab007

Individual distinctiveness across call types of the southern white
rhinoceros (Ceratotherium simum simum)
Sabrina Nicolleta Linn, Sabine Schmidt, and Marina Scheumann*,

                                                                                                                                               Downloaded from https://academic.oup.com/jmammal/advance-article/doi/10.1093/jmammal/gyab007/6178982 by guest on 26 March 2021
Frankfurt Zoo, Bernhard-Grzimek-Allee 1, D-60316 Frankfurt am Main, Germany (SNL)
Institute of Zoology, University of Veterinary Medicine Hannover, Bünteweg 17, D-30559 Hannover, Germany (SS, MS)
*Correspondent: marina.scheumann@tiho-hannover.de

         Individual distinctiveness in the acoustic structure of vocalizations provides a basis for individual recognition
         in mammals and plays an important role in social behavior. Within a species, call types can differ in individual
         distinctiveness, which can be explained by three factors, namely differences in the social function, the distance
         of the caller to the receiver, and the acoustic structure of the call. We explored the variation in individual
         distinctiveness across three call types (Grunt, Hiss, Snort) of the southern white rhinoceros (Ceratotherium
         simum simum) and investigated to what extent the abovementioned factors account for individual distinctiveness.
         Calls were recorded from 25 adult southern white rhinoceroses in six different zoos. We used three methods to
         compare the level of individual distinctiveness across call types, namely discriminant function analysis (DFA),
         potential for individual identity coding (PIC), and the information criterion (Hs). The three call types possessed
         an acoustic structure capable of showing individual variation to different extents. Individual distinctiveness
         was lowest for Snorts, intermediate for Hisses, and highest for Grunts. The level of individual distinctiveness
         of all three call types was lower than that previously reported for Pant calls of this species. Calls functioning
         to mediate intragroup social interactions had the highest individual distinctiveness. This highlights that a given
         communicative function and the need for individual discrimination during a social interaction have a major
         influence on the degree of individual distinctiveness.

         Key words: acoustic structure hypothesis, bioacoustics, distance communication hypothesis, information criterion, mammal, nasal
         call, oral call, potential for individual identity coding, sender identity, social function hypothesis

Vocal communication can be important for coordinating social              for regulating social relationships to govern cohesion, attrac-
interactions among animals. Acoustic signals can vary sub-                tion, and avoidance, among conspecifics (August and Anderson
stantially in frequency-time contours and amplitude, and can              1987; Ehret 2006) such as mother–infant reunions, support
thus reflect a wide variety of behavioral situations and envi-            of specific group members, or avoidance of inbreeding (e.g.,
ronmental conditions. Moreover, animals living in a complex               Phillips and Stirling 2000; Torriani et al. 2006; Wittig et al.
social environment have been suggested to use complex com-                2007; Müller and Manser 2008; Bouchet et al. 2012; Kessler
munication systems with signals carrying multiple information             et al. 2012; Rubow et al. 2018). It therefore can be assumed
(e.g., Bouchet et al. 2013; Knörnschild et al. 2019; Peckre et al.        that the more complex social organization will favor individual
2019). Acoustic signals may convey information about the ex-              distinctiveness in call types. We investigated the encoding of
ternal environment with which the sender is confronted (e.g.,             sender identity in the southern white rhinoceros (Ceratotherium
Seyfarth et al. 1980; Manser 2001), about the internal state              simum simum), which, in contrast to all the other solitarily
of the sender (e.g., Bastian and Schmidt 2008; Schehka and                living rhinoceros species, has been described as semisocial
Zimmermann 2009; Scheumann et al. 2012), and also about                   (e.g., Hutchins and Kreger 2006).
physical characteristics of the sender (e.g., Charlton et al. 2011;          It has been shown across a wide range of mammalian species
Stoeger and Baotic 2016). Thus, vocalization can encode the               (Appendix I) that even if the majority of adult call types show
identity of the individual, which provides the basis for vocal in-        individual distinctiveness, the degree of distinctiveness can vary
dividual discrimination. Individual discrimination is important           among different call types within a given species. This suggests

© The Author(s) 2021. Published by Oxford University Press on behalf of the American Society of Mammalogists.
This is an Open Access article distributed under the terms of the Creative Commons Attribution-NonCommercial License (http://
creativecommons.org/licenses/by-nc/4.0/), which permits non-commercial re-use, distribution, and reproduction in any medium, provided the
original work is properly cited. For commercial re-use, please contact journals.permissions@oup.com
                                                                      1
2 JOURNAL OF MAMMALOGY
that different selection pressures have affected the evolution calls), there is a dense energy distribution at the source level. In
of individual distinctiveness across different call types. To ex- these calls, the filter function of the vocal tract is the predomi-
plain differences in individual distinctiveness related to call nant factor determining individual distinctiveness (e.g., Rendall
type, three major hypotheses have been proposed, which are not et al. 1998; Taylor and Reby 2010). Even if both factors can en-
mutually exclusive (see Appendix I): the “social function hy- code individual identity, it has been hypothesized that narrow-
pothesis” (e.g., Snowdon et al. 1997; Charrier et al. 2001), the band harmonic calls are better suited to code for sender identity
“distance communication hypothesis” (Mitani et al. 1996), and than broadband noisy calls (Yin and McCowan 2004; Leliveld
Downloaded from https://academic.oup.com/jmammal/advance-article/doi/10.1093/jmammal/gyab007/6178982 by guest on 26 March 2021
the “acoustic structure hypothesis” (e.g., Leliveld et al. 2011). et al. 2011). Here, the question arises to what extent animal
The “social function hypothesis” assumes that calls func- species that predominantly use noisy calls encode sender iden-
tioning in individualized intragroup social interactions, such as tity in their vocalizations. Thus, we investigated the encoding
contact or aggression calls, should have a higher degree of in- of sender identity in the southern white rhinoceros, a species
dividual distinctiveness than calls directed to the whole group, in which noisy calls dominate the vocal repertoire and little is
such as food, alarm, or loud calls (e.g., Snowdon et al. 1997). known about information encoded in the vocalizations.
Lemasson and Hausberger (2011) expanded the social function In southern white rhinoceroses, adult bulls live solitarily, but
hypothesis and proposed that individual distinctiveness was cows occur in groups of different composition (Owen-Smith
highest in calls related to affiliative contexts, intermediate in 1973). Most southern white rhinoceros groups are based on
calls related to agonistic contexts, and lowest in calls related a mother–offspring bond and consist of an adult female and
to general activities or directed to the whole group. Evidence her offspring (Owen-Smith 1973). Adolescents often join with
for the social function hypothesis was found in several mam- similar-aged companions or mother–offspring dyads. These
malian orders such as Primates (Chacma baboon—Rendall groupings can persist for extended periods of more than a
et al. 2009; rhesus monkeys—Rendall et al. 1998; red-capped month or only a couple of days. Group sizes of over 10 individ-
mangabeys—Bouchet et al. 2012, 2013), Carnivora (dwarf uals can occur (Owen-Smith 1973; Shrader and Owen-Smith
mongoose—Rubow et al. 2018; domestic dog—Yin and 2002). The mating system of southern white rhinoceroses is
McCowan 2004; giant otter—Mumm et al. 2014), and Rodentia territorial-based, with males defending their own territories and
(African woodland dormouse—Ancillotto and Russo 2016). females ranging freely between male territories (Owen-Smith
The “distance communication hypothesis” suggests that in- 1973; Kretzschmar et al. 2020). Given the poor eyesight of
dividual distinctiveness is related to the transmission distance rhinoceroses, this more pronounced social organization may
(Mitani et al. 1996). Thus, long-distance calls emitted out of favor a more complex acoustic communication system. Indeed,
visual contact with the receiver should have a higher level of acoustic signals play an essential role in the coordination of
individual distinctiveness than calls uttered in close distance mother–infant interactions (Linn et al. 2018), during friendly
where visual or tactile information are additionally available encounters, during aggressive interactions (Owen-Smith 1973;
(Mitani et al. 1996). Evidence for the distance communica- Policht et al. 2008; Jenikejew et al. 2020), and during mating
tion hypothesis was found in primates (chimpanzees—Mitani behavior of southern white rhinoceroses (Owen-Smith 1973;
et al. 1996; rhesus monkeys—Rendall et al. 1998; gray mouse Cinková and Shrader 2020). For example, vocalizations play a
lemurs—Leliveld et al. 2011), carnivorans (giant otters— very important role in coordinating male and female behavior
Mumm et al. 2014), and rodents (Ancillotto and Russo 2016). during consortship (Owen-Smith 1973) where bulls follow a
The “acoustic structure hypothesis” is related to call-type- single cow for 2–3 weeks. Bulls emit Pant calls suggested to
specific vocal production mechanisms. In mammals, the vocal contain cues about the physical characteristics of the sender,
production apparatus is evolutionarily conserved and consists signaling male quality (Cinková and Policht 2014; Cinková and
of the lung, the larynx with the vocal folds, and the supra- Shrader 2020). If cows are not ready to accept precopulatory
laryngeal system with the throat, mouth, and nose (e.g., Fant contact, they do not tolerate such approaches and usually re-
1960; Lieberman and Blumstein 1988; Fitch 2010). Thus, spond with aggressive calls such as Hisses and Grunts (Owen-
source- and filter-related factors, namely the anatomical varia- Smith 1973).
tion of the vocal folds defining the fundamental frequency and The southern white rhinoceros has a distinct acoustic com-
the anatomical variations of the supra-laryngeal vocal tract cre- munication system in which 10–11 different call types have
ating formants (source–filter theory; see Fitch 2010; Taylor and been discriminated onomatopoetically (Owen-Smith 1973) or
Reby 2010), determine individual distinctiveness (e.g., Scherer based on the acoustic structure (Policht et al. 2008). The ma-
1989; Fitch 1997; Belin et al. 2004; Pfefferle and Fischer 2006; jority of calls were described as noisy calls (e.g., Owen-Smith
Plotsky et al. 2013). In narrow-band tonal calls of high to ultra- 1973; Policht et al. 2008; Linn et al. 2018). There is, moreover,
sonic fundamental frequencies, harmonics at the source level some evidence for a strong innate component to the develop-
are widely spaced, resulting in little interharmonic energy that ment of vocal usage and production in southern white rhinocer-
can be filtered by the vocal tract. Thus, individual distinctive- oses (Linn et al. 2018).
ness in these calls is critically coded by variation in the fun- Only one call type, the Pant (Fig. 1), has been studied in
damental frequency (Yin and McCowan 2004; Leliveld et al. detail. The Pant consists of bouts of repetitive noisy calls pro-
2011). In contrast, in broadband calls of low fundamental fre- duced during inhalation or exhalation and is emitted during
quency, or without detectable harmonic structure (termed noisy isolation from the group, when approaching other conspecifics,LINN ET AL.—SENDER IDENTITY IN WHITE RHINOCEROS CALLS 3
Downloaded from https://academic.oup.com/jmammal/advance-article/doi/10.1093/jmammal/gyab007/6178982 by guest on 26 March 2021
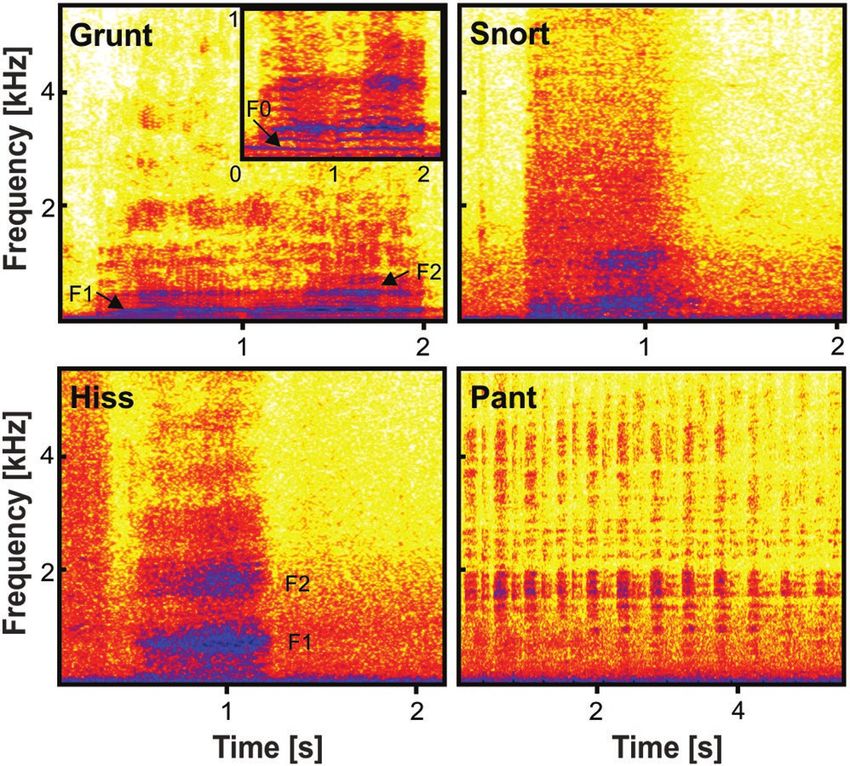
Fig. 1.—Sonograms of the common call types of the southern white rhinoceros: Grunt, Hiss, Snort, and Pant. The panel for Grunt includes a
zoomed-in sonogram to show the harmonic structure of the call. F0—fundamental frequency, F1—first formant, F2—second formant.
or in the mating context (e.g., Owen-Smith 1973; Policht Policht et al. 2008; Cinková and Policht 2014). The Hiss
et al. 2008; Cinková and Policht 2014, 2016; Linn et al. 2018; and the Grunt are uttered during agonistic interactions (e.g.,
Cinková and Shrader 2020). It has been found that the Pant Owen-Smith 1973; Policht et al. 2008; Cinková and Policht
encodes information not only about the sender, such as indi- 2014; in previous publications, the Hiss has been termed
viduality, subspecies, age class, sex, and dominance status, but Threat, but we aim to be consistent in labeling all call types
also about the motivation of the sender (Cinková and Policht using onomatopoetic labels). The Hiss is suggested to serve
2014, 2016; Cinková and Shrader 2020) and that conspecifics as first warning, for example, as a reaction to the approach or
were able to extract sex and subspecies in playback experi- presence of another individual, whereas the Grunt signals a
ments (Cinková and Policht 2016; Cinková and Shrader 2020). more pronounced motivation to fight. When the recipient does
For the other call types, the potential for individual signatures not react, Hisses are often followed by Grunts in combination
is still unknown. with agonistic displays such as horn clashing (Owen-Smith
In this study, we investigated the potential for coding sender 1973; Policht et al. 2008). Hisses and Grunts are emitted com-
identity in three of the most common call types of the vocal monly by females or adolescents in response to the presence
repertoire of the southern white rhinoceros (C. s. simum; of a male (Owen-Smith 1973; Policht et al. 2008; personal ob-
Fig. 1). These three call types were emitted in different con- servations). Hisses sometimes also are emitted in interactions
texts, at different distances of the caller from their recipient, between females or adolescents (Owen-Smith 1973; Policht
and differed in their level of harmonicity. Rhinoceros calls et al. 2008; personal observations). Both call types differ in
therefore are a promising model to explore the above hy- their level of tonality. Thus, the Grunt is a broadband call that
potheses on call-type-related differences in distinctiveness. contains low-frequency harmonic components, whereas the
The Snort is uttered during general activities, such as feeding Hiss is a broadband call without tonal structure. To compare
or resting. It is a noisy call, which sounds like an air blow our data with the results of Cinkova and Policht (2014) for
through the nostrils or the mouth (e.g., Owen-Smith 1973; Pant calls, we calculated the information criterion (Hs), which4 JOURNAL OF MAMMALOGY
is rather insensitive to differences in sample size (Beecher observation period; however, he had visual and olfactory con-
1989). In addition, we used discriminant function analysis tact with the adult females.
(DFA) and potential for individual identity coding (PIC) as At Augsburg Zoo, the rhinoceros group consisted of three
reported in the literature (see Appendix I) to compare the level adult females and one adult male. The rhinoceroses were ob-
of individual distinctiveness between different call types. served in a 14,000-m2 outdoor enclosure where they lived to-
To test the three hypotheses, we made the following predic- gether during the day with Cameroon sheep (Ovis aries) and
tions about how the level of individual distinctiveness should blesbok (Damaliscus pygargus phillipsi). At Osnabrück Zoo,
Downloaded from https://academic.oup.com/jmammal/advance-article/doi/10.1093/jmammal/gyab007/6178982 by guest on 26 March 2021
differ between call types (Table 1). For the social function hy- we recorded three adult females and one adult bull that were
pothesis, we predict that the Pant, the Hiss, and the Grunt, ut- kept in a 2,000-m2 outdoor enclosure together with red river
tered during specific social interactions, will have a higher level hogs (Potamochoerus porcus) and Chapman’s zebras (Equus
of individual distinctiveness than Snorts uttered during general quagga chapmani). At Dortmund Zoo, we observed two adult
activities, such as resting or feeding. Moreover, the level of in- females in their 2,250-m2 outdoor enclosure. One of the fe-
dividual distinctiveness should be higher for the Pant uttered males had a 5-month old calf. At Gelsenkirchen Zoo, the rhi-
during affiliative social interactions than for the Hiss and Grunt noceros group consisted of two adult females and one adult
uttered during agonistic interactions. For the distance commu- bull. The rhinoceroses were observed in a 5,000-m2 outdoor en-
nication hypothesis, we predict that Pant and Snort uttered at closure where they lived together with several antelope species.
variable distances will show a higher level of individual dis- At Erfurt Zoo, we recorded two adult females and one adult
tinctiveness than Hiss and Grunt uttered during close-distance bull kept together in a 3,500-m2 outdoor enclosure during the
interactions. For the acoustic structure hypothesis, we predict day. At Serengeti-Park Hodenhagen, the rhinoceros group con-
that the Grunts in which a harmonic structure and formants sisted of 9–11 individuals (2012: six adult females, one adult
are obvious will show the highest level of individual distinc- male, two infants; 2014: five adult females, one adult male, two
tiveness, Hisses and Pants containing formant-like structures juveniles, three infants). The adult male was occasionally sep-
will show an intermediate level, and nasal Snorts will show the arated from the herd. Data were mainly recorded in the 9-ha
lowest level of individual distinctiveness. drive-through outdoor enclosure where the rhinoceroses lived
together with several other species (e.g., Watusi cattle—Bos
primigenius f. taurus; zebras—E. q. chapmani; ostriches—
Materials and Methods Struthio camelus; lechwes—Kobus leche; addax antelopes—
Subjects and study site.—Recordings were made on two ju- Addax nasomaculatus; dromedaries—Camelus dromedarius).
venile and 23 adult southern white rhinoceroses ranging from Our research followed the ASM guidelines (Sikes et al. 2016).
2 to 45 years of age at the following six zoological institutions The article contains only observational data of zoo animals
(Table 2): Serengeti-Park Hodenhagen (February–March 2012, during their daily routine without any manipulation of the
May–June 2014), Dortmund Zoo (September–October 2014), animals.
Augsburg Zoo (July–August 2014), Osnabrück Zoo (April– Data collection.—Recordings took place throughout the day
May 2014), Erfurt Zoo (April–May 2015), and Gelsenkirchen between 0600 and 1700 h. Audio and video data were collected
Zoo (August–September 2015). Due to the fact that there is using the focal animal sampling method (Altmann 1974). Each
no evidence for seasonal trends in reproduction in female rhi- rhinoceros of a group was observed for a 10-min interval in
noceroses in zoos (Roth 2006), and that reproductive cyclicity block-randomized order. When all subjects had been observed
in females occurs throughout the year (Patton et al. 1999; once, the next block of focal observations started. Overall,
Brown et al. 2001), we hypothesize that the different dates had a total of 384 h of data were recorded and analyzed. We re-
no influence on vocalizations. For five of the six institutions, corded 81 h at Augsburg Zoo, 54 h at Osnabrück Zoo, 60 h
the groups were observed when the adult bull was kept together at Erfurt Zoo, 95 h at Serengeti-Park Hodenhagen, 40 h at
with the adult females and their offspring. In the Dortmund Gelsenkirchen Zoo, and 54 h at Dortmund Zoo. Recordings
Zoo the adult bull was separated physically during the whole were mainly made in the outdoor enclosures from the visitor or
Table 1.—Predictions of level of individual distinctiveness for southern white rhinoceros call types (including acoustic structure, mouth pos-
ition, context in which they are given, and typical distance at which they are exchanged) and predictions for acoustic variability and individual
distinctiveness based on the different hypotheses; SF = social function hypothesis, DC = distance communication hypothesis, AS = acoustic
structure hypothesis; inter. = intermediate.
Call Acoustic structure Mouth Context Distance Hypotheses and
type position predictions
SF DC AS
Snort noisy closed not obvious, during general activities various distances (close/inter./far) low high/inter. low
Grunt low frequency, harmonic components open aggressive interactions, powerful warning close inter. low high
Hiss low frequency, noisy closed aggressive interactions, first warning close inter. low inter.
Pant bouts of repetitive noisy calls closed/ friendly approach, during isolation various distances (close/inter./far) high high/inter. inter.
openLINN ET AL.—SENDER IDENTITY IN WHITE RHINOCEROS CALLS 5
Table 2.—Demographic data of southern white rhinoceroses included in the study and number of selected high-quality calls per call type used
for the acoustic analyses.
Individual Sex Age* (years) Zoo No. of analyzed calls
Grunt Hiss Snort
Floris M 37 Osnabrück 6 8
Amalie F 7 Osnabrück 8 12
Marsita F 9 Osnabrück 5 20
Downloaded from https://academic.oup.com/jmammal/advance-article/doi/10.1093/jmammal/gyab007/6178982 by guest on 26 March 2021
Lia F 11 Osnabrück 20
Bantu M 8 Augsburg 13 11
Baby F 42 Augsburg 10 20 20
Chris F 9 Augsburg 11 20 17
Kibibi F 9 Augsburg 12 20 14
Shakina F 9 Dortmund 20 18
Natala F 44 Dortmund 12 11
Dino M 21 Erfurt 14
Temba F 17 Erfurt 7
Numbi F 19 Erfurt 7
Lekuru M 11 Gelsenkirchen 5 20
Cera F 11 Gelsenkirchen 20 15
Tamu F 12 Gelsenkirchen 20 8
Martin M 18 Hodenhagen 8
21
Abasi M 2 Hodenhagen 5 8
Molly F 43 Hodenhagen 5
45
Doris F 42 Hodenhagen 16 13
44
Uzuri F 6 Hodenhagen 17 20 13
8
Kiyanga F 8 Hodenhagen 20 14
10
Claudia F 13 Hodenhagen 5 20 14
15
Jessica F 17 Hodenhagen 5 6 6
Lara F 3 Hodenhagen 15 17
*White rhinoceros females can be regarded as adults from the age of 6 years, males from the age of 10 years (Owen-Smith 1973).
keeper area. Occasionally, recordings were made in the indoor good signal-to-noise ratio, no clipping). The recordings from
enclosures, when the rhinoceroses had to stay indoors due to different zoos were affected by different ambient noise (e.g.,
weather conditions. Baker and Logue 2007; Maciej et al. 2011) such as urban,
Since it has been suggested that white rhinoceros produce traffic, and building construction noise. Since low frequency
infrasound vocalizations (Muggenthaler et al. 1993) acoustic signals travel over long distance, even noise sources far away
data were obtained using a Sennheiser omnidirectional micro- from the recording site necessarily affect the sound recordings,
phone (MKH 8020; Sennheiser, Wedemark, Germany) with even in high-quality recordings. We used a noise reduction
a frequency response of 10 – 60,000 Hz (frequency response method as applied in other studies, when animal vocalizations
from 10 to 20,000 Hz ± 5 db) equipped with a windshield were hampered by site-specific noise (e.g., Liu et al. 2003;
and a boom pole. The microphone was connected to a Sound Baker and Logue 2007; Nair et al. 2009). Namely, we pre-
Devices 722 State Recorder (Sound Devices, LLC, Reedsburg, processed the sound files using a bandpass filter of 10 – 10,000
Wisconsin; frequency response of the recorder: 10 ± 20,000 Hz followed by the Wiener Noise Suppressor with Harmonic
Hz; settings: 44.1 kHz sampling rate, 16 Bit, uncompressed. Regeneration Noise Reduction (HRNR) algorithm (Plapous
wav format). Concomitant video recordings were done using a et al. 2005, 2006) in Matlab (2018) (script modified from
digital camcorder (Sony DCR-SR36E, Tokyo, Japan). To allo- Pascal Scalart version 1.1.0.0.). We determined a 200-ms noise
cate vocalizations to individuals, the observer (SNL) noted the segment shortly prior to or after the vocalization of interest,
identity of the caller. which was used as a statistical estimate of the ambient noise
Acoustic analysis.—The spectrograms of all audio re- and filtered from the original recording of the vocalization to
cordings were inspected visually using Batsound Pro (2013; obtain an estimate of the underlying vocalizations (Wiener
settings: fast Fourier transformation [FFT] 512, Hanning Filter). Since the Grunts contained a fundamental frequency
window). Calls were classified visually based on previously with harmonics, we decided to use additionally the HRNR
published vocal repertoires (Policht et al. 2008; Linn et al. method, which is suggested to reduce harmonic distortions
2018). In these studies, call classification was validated using for small signal-to-noise ratios (Plapous et al. 2005, 2006).
multivariate statistics. For further acoustic analyses, we only Afterwards, the preprocessed audio files were stored as sepa-
selected calls of high quality (no overlap with other sounds, rate wave files for further acoustic analysis.6 JOURNAL OF MAMMALOGY
We are aware that filtering the acoustic recordings might Table 3.—Description of measured acoustic parameters.
influence the acoustic measurements and that filtering can
Parameter Definition
cause harmonic distortions known as musical notes. We tried
DUR [s] a
Time between the onset and the offset of a call
to reduce these effects as much as possible by using 1) high- timeMAXPEAK Time between the onset and the time point of maximum
quality calls, 2) the same procedure for all recordings, 3) a [s]a amplitude of a call
long noise segment directly preceding or following the re- VOI [%]a Percentage of voiced frames of a call
spective vocalizations without any distinct sound events (e.g., COG [Hz]a Center of gravity—mean frequency of the spectrum
Downloaded from https://academic.oup.com/jmammal/advance-article/doi/10.1093/jmammal/gyab007/6178982 by guest on 26 March 2021
weighed by the amplitude
bird calls, human speech) to calculate the statistical back- SD [Hz]a Standard deviation of the frequency in a spectrum
ground noise, and 4) by using a noise reduction method sug- SKEa Skewness of the spectrum—difference between the
gested to reduce harmonic distortions. For Hisses and Snorts, spectral distribution below and above the COG pro-
we listened to all filtered vocalizations and selected only calls viding a measure of symmetry
KURa Kurtosis of the spectrum—difference between the spec-
where musical notes could not be perceived by the experi- trum
menter. Taking a random sample of all Hisses and Snorts led around the COG and a Gaussian distribution
to comparable statistical results as taking a sample of these F1 [Hz]a** First formant—first frequency band in the sonogram
call types including only filtered vocalizations without detect- BDF1 [Hz]a** Bandwidth of the first formant
F2 [Hz]a** Second formant—second frequency band in the sono-
able musical notes. Thus, for the Grunts, for which a limited gram
sample size was available, all calls were used. Sonograms of BDF2 [Hz]a** Bandwidth of the second formant
examples of the original and filtered calls are presented in HNRa Harmonic-to-noise ratio
ENTRa Wiener entropy—ratio of geometric to arithmetic en-
Supplementary Data SD1.
ergy
Because the number of calls per call type and individual MIN(max) [Hz]b Minimum frequency at which the amplitude is 20 db
varied widely, we randomly selected 5 – 20 calls per individual below the peak amplitude measured at the time window
of every call type for acoustic analysis to have a call balanced of maximum amplitude
MAX(max) [Hz]b Maximum frequency at which the amplitude is 20 db
data set. Individuals with less than five calls per call type were
below the peak amplitude measured at the time window
not taken into account. In total, 651 calls were included in the of maximum amplitude
acoustic analysis (Table 2; 60 Grunts, 286 Hisses, 305 Snorts). BAND(max) [Hz]b Bandwidth difference between maximum and minimum
We also recorded Pants in the present study. However, due frequency using a threshold of 10 db to the peak ampli-
to their low amplitude and interferences with environmental tude measured at the time point of maximum amplitude
25% Frequency of the power spectrum at which 25% of the
sounds in the outdoor enclosures, most of these Pants did not QUART(max) total energy is reached measured at the time point of
satisfy our quality criteria. Therefore, we referred to the results [Hz]b maximum amplitude
reported in Cinkova and Policht (2014) for comparisons. 50% Frequency of the power spectrum at which 50% of the
The spectral and temporal parameters that were measured QUART(max) total energy is reached measured at the time point of
[Hz]b maximum amplitude
differed depending on the call types. We described the spectral 75% Frequency of the power spectrum at which 75% of the
composition using Praat (2018; self-written script—Boersma QUART(max) total energy is reached measured at the time point of
1993, 2001) by measuring the following nine acoustic param- [Hz]b maximum amplitude
eters for all call types: call duration (DUR), time of maximum MIN(mean) [Hz]b Minimum frequency at which the amplitude is 20 db
below the peak amplitude measured over the mean
amplitude (timeMAXPEAK), percentage of voiced frames
spectrum of the entire call
(VOI), the center of gravity (COG) of the spectrum, standard MAX(mean) [Hz]b Maximum frequency at which the amplitude is 20 db
deviation of the frequency (SD) in the spectrum, the skewness below the peak amplitude measured over the mean
(SKE) as a measure of symmetry of the spectrum, the kur- spectrum of the entire call
BAND(mean) Bandwidth difference between maximum and minimum
tosis (KUR) describing the deviation of the spectrum from a
[Hz]b frequency using a threshold of 10 db to the peak ampli-
Gaussian distribution, harmonic-to-noise ratio (HNR), and tude measured over the mean spectrum of the entire call
Wiener entropy (ENTR). For full definitions of all acoustic 25% Frequency of the power spectrum at which 25% of the
parameters, see Table 3. Since harmonic-to-noise ratio and QUART(mean) total energy is reached measured over the mean spec-
Wiener entropy values are based on logarithmic scaling, we [Hz]b trum of the entire call
50% Frequency of the power spectrum at which 50% of the
have converted these logarithmic values to a linear scale for all QUART(mean) total energy is reached measured over the mean spec-
subsequent calculations. [Hz]b trum of the entire call
If no fundamental frequency contour could be determined 75% Frequency of the power spectrum at which 75% of the
in the sonogram (noisy calls) for a time frame, the time frame QUART(mean) total energy is reached measured over the mean spec-
[Hz]b trum of the entire call
was set as unvoiced for the calculation of the percentage of MINF0 [Hz]a* Minimum fundamental frequency of a call
voiced frames (VOI). For the harmonic Grunt, we included MAXF0 [Hz]a* Maximum fundamental frequency of a call
four additional parameters characterizing the contour of the MEANF0 [Hz]a* Mean fundamental frequency of a call
fundamental frequency (F0): minimum F0 (MINF0), max- SDF0 [Hz]a* Standard deviation of the fundamental frequency of a
call
imum F0 (MAXF0), mean F0 (MEANF0), standard deviation
of the F0 (SDF0). We used a semiautomatic procedure for pitch a
Measured in PRAAT.
tracking. If necessary, we corrected the pitch tracking manually b
Measured in AVISOFT at the location of maximum and mean amplitude.
by matching the extracted contour with the sonogram (settings: *Only measured for the Grunt.
submenu: “To pitch”; min pitch: 10 Hz; max pitch: 3,000 Hz; **Only measured for the Grunt and the Hiss.LINN ET AL.—SENDER IDENTITY IN WHITE RHINOCEROS CALLS 7
time steps: 0.005). However, since it has been suggested that P-value and thereby in a rejection or acceptance of the null hy-
noisy calls might be well suited for extraction of filter-related pothesis. The degrees of freedom represent twice the number of
formants (e.g., Plotsky et al. 2013; Gamba 2014), we addition- included P-values. Based on the significant parameters in the
ally measured four formant parameters using Praat sub-menu linear mixed model, we carried out a principal component anal-
“quantify formant”: first formant (F1), bandwidth of the first ysis (PCA) and extracted principal components (PCs) with an
formant (BDF1), second formant (F2), and bandwidth of the eigenvalue higher than 1 to reduce the number of parameters. In
second formant (BDF2). For the Grunts, we estimated the ex- that manner, correlating acoustic parameters were represented
Downloaded from https://academic.oup.com/jmammal/advance-article/doi/10.1093/jmammal/gyab007/6178982 by guest on 26 March 2021
pected number of formants based on the following formula by the same PC. To investigate whether calls can correctly be
(Pfefferle and Fischer 2006): classified to the respective individuals, we carried out an in-
dependent DFA based on these PCs using the leave-one-out
2×L method for cross-validation. To test whether the number of cor-
N= × fc
c rectly classified calls was significantly higher than expected by
chance, we performed a binomial test for each subject and cal-
where N = number of formants, L = vocal tract length [m], culated the level of agreement using the kappa test (Scheumann
c = speed of sound (340 m/s), and fc = cutoff frequency of the et al. 2007). The level of agreement was defined as follows:
measurement range [Hz]. We based our calculation on the oral Cohen’s kappa < 0.00 = poor agreement, 0.00–0.20 = slight
vocal tract length (0.72 m) of a cadaver measured by R. Frey agreement, 0.21–0.40 = fair agreement, 0.41–0.60 = mod-
(Leibniz Institute for Zoo and Wildlife Research, pers. comm.) erate agreement, 0.61–0.80 = substantial agreement, and 0.81–
to get an indication of how many formants we can expect. 1.00 = almost perfect agreement (Landis and Koch 1977). To
Based on the calculated values and on visual inspections of the estimate which parameters were important for classification,
sonogram, we used the following setting for Grunts: number of we investigated the correlation between the DFA function with
formants: 4; max formant value: 1,000 Hz; time steps: 0.05 s. the PCs and afterwards the correlations of the PCs with the
For the Hiss we were not able to use the formula since the ex- acoustic parameters. Parameters with a loading factor higher
pected formant frequencies did not correspond to the dominant than 0.7 were considered as having a strong impact on the re-
frequency bands in the sonogram. To track these frequency spective PC.
bands we based our setting on visual inspection of the sono- In addition, we calculated potential for individual iden-
grams and used the following settings: number of formants: 3; tity coding (PIC) for each parameter and call type ac-
max formant value: 5,000 Hz; time steps: 0.05 s. For Snorts, cording to Robisson et al. (1993). The PIC tested whether
the frequency band of high energy was reflected by the center the interindividual variation of a call type was larger than its
of gravity. Further emphasized frequency bands were barely intraindividual variation. For the PIC analysis, we calculated
detected. Therefore, we measured no formants for Snort calls. the mean (MEANWithin) and standard deviation (SDWithin) of
In addition, we measured the minimum frequency (MIN), each subject for each acoustic parameter as well as for the
maximum frequency (MAX), and bandwidth (BAND), as well mean (MEANBetween) and standard deviation (SDBetween) of the
as the frequencies of the first, second, or third quarter of total en- whole data set. Using these parameters, we obtained the within-
ergy in the spectrum (25%QUART, 50%QUART, 75%QUART; individual (CIWi) and between-individual (CIB) coefficients of
FFT 1024, Hanning window) for all call types using the auto- variation (CI = 100 * (1 + 1/4n) * SD/MEAN), where n is the
matic measurement routine of Avisoft (2018). Measurements number of calls. Further, we calculated the CIW by averaging
were taken at the time point of maximum amplitude (max) as the CIWi of all subjects. We determined the PIC for each pa-
well as across the whole call (mean). rameter by calculating the ratio PIC = CIB/CIW (e.g., Ligout
Statistical analysis.—In the first part of the analysis, we in- et al. 2004; Bouchet et al. 2012). A value of PIC > 1 indicates
vestigated the potential of each call type to encode sender iden- that this parameter is potentially capable of encoding individ-
tity using the whole data set. Using the Kolmogorov–Smirnov uality. Additionally, we calculated the PICOverall as mean of all
test, we confirmed that the majority of acoustic parameters for PIC values across the parameters (Salmi et al. 2014).
the majority of individuals were normally distributed (P ≤ 0.05). In the second part of the analysis, we aimed to compare the
We tested whether the acoustic parameters differed between in- level of individual distinctiveness across call types. Since the
dividuals by calculating a linear mixed model with the acoustic results of the DFA are affected by the number of individuals
parameter as the dependent variable, the sender as predictor included in the analysis (e.g., Beecher 1989), we balanced our
variable, and zoo as a random variable (“nlme” package; sample and compared the six individuals for which data on all
Rstudio Team 2016), and tested the effect of the sender using three call types were available. Then, we performed again the
the “anova” function. The random variable zoo was added to DFA as described before.
account for call adaptations in response to site-specific noise, or The information capacity criterion (Hs) according to
similarities based on relatedness of individuals in a given zoo. Beecher (1989) is based on information theory and calcu-
To control for multiple testing of the same null hypothesis, we lated in bits. The value 2Hs estimates the number of indi-
carried out the Fisher-Omnibus test (Haccou and Melis 1994). viduals that can be potentially discriminated based on the
This test combines the P-values of the different ANOVAs into considered acoustic parameters of the call. We carried out a
a single chi-square distributed variable resulting in an overall one-way ANOVA testing whether the PC scores of the above8 JOURNAL OF MAMMALOGY
described PCA differed between individuals. We used the P < 0.001; Table 4). A PCA based on these significant param-
mean squares (MS) of the significant PC components (e.g., eters (except MINF0, MAXF0, and MEANF0, which could not
Beecher 1989; Bouchet et al. 2013) to calculate the estimates be obtained for all Grunt calls and the other call types) extracted
for within-individual variance (S2W = MSW) and between- five PCs with an eigenvalue higher than 1 explaining 85% of
individual variance (S2B = (MSB – MSW)/n0 according to the variance. An independent DFA based on these five PCs was
Lessells and Boag (1987). Thereby, MSB is the mean square able to classify 65% of the calls to the respective individual
of between-individual variance, MSW is the mean square of (cross-validation: 57%). Significantly more calls were correctly
Downloaded from https://academic.oup.com/jmammal/advance-article/doi/10.1093/jmammal/gyab007/6178982 by guest on 26 March 2021
within-individual variance and n0 is a coefficient related to classified than expected by chance for five out of six individuals
the sample size. The value of n0 is calculated using following (binomial test: P ≤ 0.036). The kappa test resulted in a moderate
ï a Å a ãò
2 a agreement between the results of the DFA and the observed data
formula: n0 = [1/(a − 1)] × ni − n / ni
i=1 i=1 i=1
(0.56). The DFA calculated five DFs. DF1 and DF2 explained
(a = number of groups; ni = number of calls in the ith group) 75% of the variation in the calls. DF1 showed the highest cor-
and represents the mean sample size per individual. Based relation to PC2 (r = −0.604) and DF2 to PC1 (r = 0.732). PC1
on these estimated variances, we calculated the information showed the highest loading on parameters 50%QUART(mean),
criterion (Hi = log2 (S2T/S2W)). The total variance S2T was cal- 25%QUART(mean), MAX(mean), BAND(mean), and COG
culated as the sum of S2W + S2B. To estimate the information (r ≥ 0.810). PC2 showed the highest loading on parameters
capacity of a call the information criterions of all significant 25%QUART(max) and 50%QUART(max) (r ≥ 0.796). Thus,
PCs were summed (Hs = ∑Hi). spectral parameters play a predominant role in encoding sender
For the comparison of the level of individual distinctiveness, we identity. Twenty-four of 29 parameters showed a PIC > 1 sug-
also calculated the PICoverall and the Hs for the balanced data set. gesting a potential for identity coding (Table 4).
Hiss.—The ANOVAs revealed that 17 out of 24 param-
eters were significantly different across individuals (F20, 265 ≥
Results 2.0, P ≤ 0.030; Fisher-Omnibus test: χ 2 = 248.10, d.f. = 48,
Grunt.—The ANOVAs revealed that 21 out of 29 acoustic P < 0.001; Table 5). A PCA based on these significant param-
parameters were significantly different across individuals eters extracted five PCs with an eigenvalue higher than 1 ex-
(F5, 54 ≥ 5, P ≤ 0.040 and for MINF0, MAXF0, and MEANF0 plaining 78% of the variance. An independent DFA based
F5, 36 ≥ 4, P ≤ 0.010, Fisher-Omnibus test: χ 2 = 281.58, d.f. = 58, on these five PCs was able to classify 26% of the calls to
Table 4.—Individual differences in the acoustic parameters of the Grunt of the southern white rhinoceros. PIC = potential for individual
identity coding, CIB = between-individual coefficient of variance, CIW = within-individual coefficient of variance. Bold indicates PIC > 1.0
and P > 0.05; *F5, 36.
Descriptive PIC ANOVA
Mean SD CIB CIW PIC F5, 54 P
DUR [s] 1.78 0.97 54.61 54.92 1.0 1.4 0.234
timeMAXPEAK [s] 1.01 0.86 85.59 82.63 1.0 2.3 0.057
VOI [%] 37.46 31.85 85.36 98.20 0.9 4.2 0.003
COG [Hz] 339.12 126.89 37.57 35.28 1.1 5 < 0.001
SD [Hz] 294.64 190.43 64.90 48.70 1.3 3.6 0.008
SKE 8.40 5.19 61.98 51.09 1.2 6.9 < 0.001
KUR 305.61 433.10 142.31 85.30 1.7 3.2 0.014
F1 [Hz] 235.77 57.40 24.45 19.33 1.3 5 < 0.001
BDF1 [Hz] 38.61 43.23 112.44 96.66 1.2 0.6 0.713
F2 [Hz] 467.73 73.31 15.74 15.11 1.0 1.0 0.447
BDF2 [Hz] 157.86 187.76 119.44 110.06 1.1 1.8 0.127
HNR 1.60 0.46 29.04 17.00 1.7 9 < 0.001
ENTR 0.35 0.12 33.12 28.12 1.2 6 < 0.001
MIN(max) [Hz] 89.17 74.61 84.03 43.05 2.0 5.6 < 0.001
MAX(max) [Hz] 912.50 487.44 53.64 46.38 1.2 3.1 0.016
BAND(max) [Hz] 816.67 473.83 58.26 50.46 1.2 2.5 0.040
25% QUART(max) [Hz] 257.33 134.57 52.51 36.52 1.4 9 < 0.001
50% QUART(max) [Hz] 354.50 156.16 44.23 34.24 1.3 10 < 0.001
75% QUART(max) [Hz] 622.17 304.72 49.18 48.23 1.0 2.3 0.056
MIN(mean) [Hz] 80.33 36.17 45.21 29.59 1.5 1.3 0.299
MAX(mean) [Hz] 1,168.00 369.80 31.79 24.37 1.3 6 < 0.001
BAND(mean) [Hz] 1,080.67 372.57 34.62 26.36 1.3 6 < 0.001
25% QUART(mean) [Hz] 301.17 87.95 29.33 24.07 1.2 6 < 0.001
50% QUART(mean) [Hz] 489.33 149.63 30.71 24.78 1.2 7 < 0.001
75% QUART(mean) [Hz] 877.67 489.73 56.03 37.26 1.5 6 < 0.001
MINF0 [Hz] 53.43 8.57 16.13 13.47 1.2 4* 0.006
MAXF0 [Hz] 69.21 17.89 26.00 22.90 1.1 4* 0.010
MEANF0 [Hz] 59.92 8.92 14.97 12.42 1.2 6* < 0.001
SDF0 [Hz] 3.99 3.19 80.60 64.65 1.3 0.7* 0.615LINN ET AL.—SENDER IDENTITY IN WHITE RHINOCEROS CALLS 9
Table 5.—Individual differences in the acoustic parameters of the Hiss of the southern white rhinoceros. PIC = potential for individual identity
coding, CIB = between-individual coefficient of variance, CIW = within-individual coefficient of variance. Bold indicates PIC > 1.0 and P > 0.05.
Descriptive PIC ANOVA
Mean SD CIB CIW PIC F20, 265 P
DUR [s] 0.53 0.24 45.16 33.12 1.4 5 < 0.001
timeMAXPEAK [s] 0.23 0.13 57.04 45.57 1.3 3 < 0.001
COG [Hz] 785.27 161.41 20.57 17.34 1.2 3 < 0.001
Downloaded from https://academic.oup.com/jmammal/advance-article/doi/10.1093/jmammal/gyab007/6178982 by guest on 26 March 2021
SD [Hz] 491.35 213.18 43.42 37.73 1.2 4 < 0.001
SKE 5.72 3.47 60.75 45.52 1.3 2 0.008
KUR 121.66 201.59 165.85 87.38 1.9 1 0.401
F1 [Hz] 845.30 82.06 9.72 8.06 1.2 4 < 0.001
BDF1 [Hz] 233.71 218.80 93.70 78.63 1.2 2 0.057
F2 [Hz] 2,214.04 248.56 11.24 9.70 1.2 5 < 0.001
BDF2 [Hz] 450.44 331.49 73.66 52.59 1.4 1 0.132
HNR 1.18 0.42 35.64 28.63 1.2 4 < 0.001
ENTR 0.71 0.08 11.84 11.41 1.0 2 0.002
MIN(max) [Hz] 261.89 196.21 74.99 70.00 1.1 3 < 0.001
MAX(max) [Hz] 1,716.40 713.70 41.62 41.50 1.0 1 0.100
BAND(max) [Hz] 1,449.27 746.91 51.58 50.02 1.0 2 0.030
25% QUART(max) [Hz] 648.50 210.19 32.44 33.25 1.0 2 0.005
50% QUART(max) [Hz] 832.69 192.72 23.16 22.18 1.0 2 0.001
75% QUART(max) [Hz] 1,301.40 465.17 35.77 35.36 1.0 2 0.060
MIN(mean) [Hz] 152.55 121.47 79.69 54.48 1.5 3 < 0.001
MAX(mean) [Hz] 2,286.33 665.67 29.14 27.90 1.0 1 0.213
BAND(mean) [Hz] 2,128.01 690.63 32.48 30.44 1.1 1 0.144
25% QUART(mean) [Hz] 643.53 132.03 20.53 16.39 1.3 7 < 0.001
50% QUART(mean) [Hz] 908.43 143.55 15.82 13.11 1.2 3 < 0.001
75% QUART(mean) [Hz] 1,559.13 482.97 31.00 29.49 1.1 3 < 0.001
the respective individual (cross-validation: 19%). The kappa Comparison of call types—The DFA based on a balanced
test revealed a slight agreement (0.20) between the observed sample of an identical number of individuals per call type
data and the classification by the DFA. For 11 out of 21 in- (nind = 6, 5–20 calls per individual; Table 7) revealed a classifi-
dividuals significantly more calls were correctly classified cation accuracy of 65% in Grunts (cross-validation: 57%), 44%
than expected by chance (binomial test: P ≤ 0.047). The DFA in Hisses (cross-validation: 38%), and 30% in Snorts (cross-
calculated five DFs. DF1 and DF2 explained 71% of the vari- validation: 25%). Thus, classification accuracy decreased from
ation in the calls. DF1 showed the highest correlation to PC2 Grunts to Hisses to Snorts. This was supported by the kappa
(r = 0.627) and DF2 showed the highest correlation to PC5 values, which also decreased from 0.56 for Grunts, suggesting
(r = 0.794). PC2 showed the highest loading on factors SD, moderate agreement, to 0.32 for Hisses, suggesting a fair
ENTR, and MIN(max) (r ≥ |0.701|). Seventeen out of these agreement, to 0.13 for Snorts, reflecting a slight agreement.
24 parameters showed a PIC > 1 and thus could potentially be In addition, the overall PIC and the Hs showed the same pat-
involved in the encoding of individuality (Table 5). tern. Based on the subject balanced data set, the PICOverall and
Snort.—The ANOVAs revealed that 16 out of 20 parameters the Hs were lowest for Snorts (PIC = 1.1; Hs = 0.59), interme-
that were measured for Snort vocalizations differed signifi- diate for Hisses (PIC = 1.2; Hs = 0.91), and highest for Grunts
cantly across individuals (F22, 282 ≥ 2, P ≤ 0.028; Fisher-Omnibus (PIC = 1.3, Hs = 2.63; Table 7). The values obtained for the
test: χ 2 = 219.20, d.f. = 40, P < 0.001; Table 6). The PCA based balanced data set did not vary much from the total data set for
on these acoustic parameters extracted three PCs with an eigen- Snorts (PICOverall = 1.2, Hs = 0.50) and only slightly for Hisses
value higher than 1 explaining 77% of the variance. An inde- (PICOverall = 1.2, Hs = 1.25).
pendent DFA based on these three PCs was able to classify 16%
of the calls to the respective individual (cross-validation: 14%).
The kappa test showed only a slight agreement (0.11). For six Discussion
out of 23 individuals, significantly more calls were correctly All three call types, the Grunt, the Hiss, and the Snort, possessed
classified than expected by chance (binomial test: P ≤ 0.039). an acoustic structure capable of encoding individual identity
The DFA calculated three DFs. DF1 and DF2 explained 77% according to their overall PIC (larger than 1) but differed in
of the variation in the calls. DF1 showed the highest correlation their acoustic variability and individual distinctiveness (Table
to PC2 (r = 0.840), whereas DF2 showed the highest correla- 7). Based on the calculated information criterion (Hs), the level
tion to PC1 (r = 0.923). PC1 showed the highest loading on of individual distinctiveness increased from Snort to Hiss to
almost all filter-related parameters (r ≥ |0.700| for all except Grunt. The Hs for the Pant reported by Cinková and Policht
MIN(max) and 25%Quart(max)). PC2 showed highest loading (2014; Hs = 3.15) was much higher than the Hs determined
on MIN(max) (r = 0.747). All 20 parameters showed a PIC > for the call types analyzed in the present study. Our analysis
1 and could potentially be involved in the encoding of individ- revealed that the differences in the degree of individual distinc-
uality (Table 6). tiveness across call types are barely explained by the distance10 JOURNAL OF MAMMALOGY
Table 6.—Individual differences in the acoustic parameters of the Snort of the southern white rhinoceros. PIC = potential for individual identity
coding, CIB = between-individual coefficient of variance, CIW = within-individual coefficient of variance. Bold indicates PIC > 1.0 and P > 0.05.
Descriptive PIC ANOVA
Mean SD CIB CIW PIC F22, 282 P
DUR [s] 0.52 0.18 33.66 29.34 1.2 2 < 0.001
timeMAXPEAK [s] 0.17 0.09 54.99 49.30 1.1 2 0.009
COG [Hz] 866.02 395.94 45.76 41.26 1.1 3 < 0.001
Downloaded from https://academic.oup.com/jmammal/advance-article/doi/10.1093/jmammal/gyab007/6178982 by guest on 26 March 2021
SD [Hz] 972.70 362.40 37.29 33.40 1.1 3 < 0.001
SKE 4.17 2.34 56.09 45.93 1.2 4 < 0.001
KUR 33.51 45.14 134.82 91.71 1.5 5 < 0.001
HNR 0.82 0.17 21.03 19.97 1.1 1 0.406
ENTR 0.71 0.08 10.48 9.66 1.1 3 < 0.001
MIN(max) [Hz] 104.70 97.15 92.86 72.82 1.3 2 0.028
MAX(max) [Hz] 2.408.58 1,668.55 69.33 66.03 1.1 1 0.117
BAND(max) [Hz] 2.299.48 1,663.32 72.39 68.93 1.1 1 0.103
25% QUART(max) [Hz] 494.16 320.96 65.00 55.97 1.2 3 < 0.001
50% QUART(max) [Hz] 991.39 603.28 60.90 54.81 1.1 2 0.004
75% QUART(max) [Hz] 2.286.17 1,061.80 46.48 43.30 1.1 3 < 0.001
MIN(mean) [Hz] 79.03 41.21 52.19 33.63 1.6 1 0.512
MAX(mean) [Hz] 3.667.83 1,939.55 52.92 50.16 1.1 2 < 0.001
BAND(mean) [Hz] 3.583.61 1,941.46 54.22 51.45 1.1 2 0.001
25% QUART(mean) [Hz] 613.35 239.37 39.06 32.79 1.2 4 < 0.001
50% QUART(mean) [Hz] 1.307.84 533.86 40.85 37.75 1.2 3 < 0.001
75% QUART(mean) [Hz] 2.831.87 939.58 33.21 30.84 1.1 3 < 0.001
Table 7.—Comparison of the potential for individual identity coding and classification accuracy between the call types Grunt, Hiss, and Snort
of the southern white rhinoceros. PIC = potential for individual identity coding, Hs = information criterion, DFA = discriminant function analysis,
Total = total data set, Bal. = subject balanced data set, n = number of individuals, PC = principal component.
Grunt Hiss Snort
Total = Bal. (n = 6) Total (n = 21) Bal. (n = 6) Total (n = 23) Bal. (n = 6)
Overall PIC 1.3 1.2 1.2 1.2 1.1
Hs 2.63 1.25 0.91 0.50 0.59
No. of PC factors 5 5 4 3 2
DFA Original classification [%] 65 26 44 16 30
Cross-validation [%] 57 19 38 14 25
Mean chance level per individual [%] < 28% < 7% < 19% < 7% < 24%
Kappa test 0.56 0.20 0.32 0.11 0.13
Classification category moderate slight fair slight slight
communication hypothesis, partly by the acoustic structure hy- (Sébe et al. 2010), oral calls are considerably louder than those
pothesis, and best by the social function hypothesis. emitted through the nose or trunk. As vocalizations with low
The present data provide no support for the distance com- amplitude will not propagate as far as those with high ampli-
munication hypothesis. Individual distinctiveness was much tude, it is questionable whether the Pant and the Snort are used
higher in the Grunt and the Hiss used for short-distance com- for long-distance communication. That the Pant indeed is a
munication than in the Snort that is uttered at variable distances low-amplitude call is supported by the difficulties we had to
to other individuals (Linn et al. 2018). However, the hypothesis record high-quality Pant calls during social interactions. In the
is supported when taking into account the Pant with its high present study, we recorded 690 Pant calls. However, due to its
degree of individual distinctiveness, which has been suggested low amplitude characteristics, interferences with sounds from
to serve for long-distance communication since this call type animal locomotion or Hisses of female conspecifics, in partic-
has been recorded in situations with conspecifics several hun- ular, we were not able to extract a sufficiently large number of
dred meters away (Cinková and Policht 2014). The Pant is ut- calls satisfying our quality criteria. We therefore compared our
tered with the mouth closed (sometimes only the lip is moving data with the data set published by Cinková and Policht (2014)
due to flehmen during vocalizations; Linn et al. 2018; per- who recorded Pant calls from 14 animals in an isolation con-
sonal observations) as is the Snort, and sound pressure levels text, thus obtaining better signal-to-noise ratios.
of nasal vocalizations in general are much lower than those Our results partly support the acoustic structure hypothesis
of oral sounds due to the fact that in most mammalian spe- because the only harmonic call, the Grunt, is more individu-
cies the nasal passages are convoluted and filled with spongy ally distinctive than the Hiss, containing formant-like struc-
absorbing tissue (Wiley and Richards 1978). Thus, in African tures, followed by the noisy Snort. Even though we measured
elephants (Loxodonta Africana—Stoeger et al. 2012) and sheep all parameters commonly used in the literature, it could be thatLINN ET AL.—SENDER IDENTITY IN WHITE RHINOCEROS CALLS 11
other parameters may be better suited to measure individual Linn et al. 2018). Individual distinctiveness was highest in Pants
signatures in Snorts and Hisses. Nevertheless, our findings functioning as a contact call during socio-positive interactions
are in accordance with the assumption that narrow-band har- as compared to Grunts and Hisses uttered during socio-negative
monic calls are better suited for coding sender identity than interactions. Pants are produced mainly in two distinct social
broadband noisy calls (Yin and McCowan 2004; Leliveld et al. contexts. First, white rhinoceroses emit Pants during social co-
2011). Thus, the dense energy distribution by the narrow- hesive interactions as a kind of “greeting” when approaching or
spaced harmonics favors the projection of formants. However, following a conspecific or a group of individuals (Policht et al.
Downloaded from https://academic.oup.com/jmammal/advance-article/doi/10.1093/jmammal/gyab007/6178982 by guest on 26 March 2021
the Pant showed the highest level of individuality (Cinková and 2008; Linn et al. 2018). Moreover, Pants play an important role
Policht 2014) although it has a broadband acoustic structure in the mating behavior of white rhinoceroses as bulls emit this
without fundamental frequency. The analysis of Cinková and call during mate guarding and mating encounters (Owen-Smith
Policht (2014) showed that sender identity was mainly encoded 1973; Policht et al. 2008). In both contexts it may be essential
by temporal parameters such as the duration or the number of for a white rhinoceros to assess the identity of the caller, pro-
elements (Cinková and Policht 2014), whereas in our analysis viding information about physiological and morphological at-
temporal parameters were not important. Although individual tributes such as body size, dominance rank, or hormonal state.
differences based on frequency characteristics have been found There is strong male–male competition and female mate choice
in various mammals (e.g., Bastian and Schmidt 2008; Leliveld in white rhinoceroses (Kretzschmar et al. 2020) and males use
et al. 2011; Mumm et al. 2014), identity coding based on tem- acoustic cues to gather information about rivals (Cinková and
poral features has also been described for some species (e.g., Shrader 2020).
Shapiro 2006, 2010). In calls consisting of bouts of repet- Our finding is in agreement with the expansion of the so-
itive elements, the number of units per call and thereby the cial function hypothesis by Lemasson and Hausberger (2011)
call duration are primarily dependent on individual lung ca- which assumes that individual distinctiveness is higher in calls
pacity and the control of the air flow speed (Fitch and Hauser related to affiliative contexts as compared to calls related to ag-
1995). Individual-specific information based on the variance in onistic contexts. Our results agree with other studies showing
temporal features, such as duration or temporal arrangement that individual distinctiveness increases with increasing affilia-
of frequency elements, has been found in bats (Brown 1976; tive social value of a call type (Appendix I; e.g., Lemasson and
Masters et al. 1995) and nonhuman primates (Lemasson et al. Hausberger 2011; Bouchet et al. 2013; Ancillotto and Russo
2010; Bouchet et al. 2012). Temporal variation often is related 2016). Selection may have favored more individually distinct
to differences in the arousal state of an animal, which affects calls in situations such as social cohesion in which vocal recog-
the mammalian vocal production mechanism (Kirchhübel et al. nition is useful. On the other hand, in situations where context
2011). Arousal and anxiety are known to reduce saliva produc- (e.g., aggression) is of greater importance than caller identity,
tion and to increase muscle tension in mammals (Kirchhübel selection will favor the suppression of individual vocal distinc-
et al. 2011). In dwarf mongooses (Helogale parvula), it was tiveness to reduce signal ambiguity and facilitate a rapid re-
shown that calls emitted during high-arousal situations show sponse by receivers (Shapiro 2010). From this point of view, it
less individual variation as compared to calls emitted during makes sense that evolution has favored individual distinctive-
low-arousal states (Rubow et al. 2018), whereas in domestic ness in a contact and mating call, such as the Pant, providing
kittens (Felis catus) no difference in the level of individual signalers with benefits, but less so in aggressive calls such as the
distinctiveness was found between high- and low-arousal con- Grunt or the Hiss. Nevertheless, in agonistic contexts it may be
texts (Scheumann et al. 2012). The southern white rhinoceros important to estimate the potential outcome of an agonistic in-
uttered two call types during aggressive interactions. Hisses teraction by assessing the identity of the opponent, which may
acted as a first warning signal, whereas Grunts were a more account for the individual distinctiveness in Grunt calls. For
powerful warning signal indicating a more pronounced moti- example, in northern elephant seals (Mirounga angustirostris),
vation to fight (Policht et al. 2008). The Grunts thus may signal individuals remember the fighting abilities of potential oppon-
a higher level of arousal, yet they exhibited more pronounced ents based on individual acoustic signatures (Casey et al. 2015).
individual differences compared to Hisses produced at a lower Due to the fact that previous studies have used a wide va-
arousal level. riety of statistical methods to analyze and compare individual
Our findings best support the social function hypothesis, as distinctiveness in vocalizations of different mammalian spe-
the level of individual distinctiveness increases from Snort, cies (Appendix I) and that the published results thus may
to Hiss, to Grunt, to Pant. Thus, the lowest level of individual have been influenced by the methods used, we compared the
distinctiveness was found in the Snort, which often is used three most prominent methods used in the literature when
in nonsocial situations such as feeding, resting, or locomo- analyzing our data set to compare the level of individual dis-
tion (Policht et al. 2008; Linn et al. 2018). On the other hand, tinctiveness between different call types: DFA, potential for
calls with a strong intragroup social function have high levels individual identity coding (PIC), and the information crite-
of acoustic variability, potentially allowing callers to convey rion (Hs). Comparing the results of the DFA based on subject
a range of individual-specific information. These calls play a balanced and unbalanced data sets (Table 7), we confirmed
major role in affiliative (Pant) and agonistic interactions (Grunt that the classification accuracy is influenced by the number
and Hiss) with a specific social partner (Policht et al. 2008; of individuals included in the analyses (e.g., Beecher 1989).You can also read