Indonesia's Energy Support Measures: International Institute ...
←
→
Page content transcription
If your browser does not render page correctly, please read the page content below
Indonesia’s
Energy Support
Measures:
An inventory of incentives
impacting the energy transition

GSI REPORT

                                                                             Anissa Suharsono
                                                                             Murtiani Hendriwardani
                                                                             Theresia Betty Sumarno
                                                                             Jonas Kühl
                                                                             Martha Maulidia
                                                                             Lourdes Sanchez
© 2022 International Institute for Sustainable Development | IISD.org /gsi   June 2022
Indonesia’s Energy Support Measures
© 2022 International Institute for Sustainable Development
Published by the International Institute for Sustainable Development
This publication is licensed under a Creative Commons Attribution-
NonCommercial-ShareAlike 4.0 International License.
International Institute for Sustainable Development
The International Institute for Sustainable Development (IISD) is an Head Office
award-winning independent think tank working to accelerate solutions
111 Lombard Avenue,
for a stable climate, sustainable resource management, and fair
Suite 325
economies. Our work inspires better decisions and sparks meaningful
Winnipeg, Manitoba
action to help people and the planet thrive. We shine a light on what
Canada R3B 0T4
can be achieved when governments, businesses, non-profits, and
communities come together. IISD’s staff of more than 120 people, plus Tel: +1 (204) 958-7700
over 150 associates and consultants, come from across the globe and Website: www.iisd.org
from many disciplines. With offices in Winnipeg, Geneva, Ottawa, and Twitter: @IISD_news
Toronto, our work affects lives in nearly 100 countries.
IISD is a registered charitable organization in Canada and has 501(c)(3)
status in the United States. IISD receives core operating support from
the Province of Manitoba and project funding from governments inside
and outside Canada, United Nations agencies, foundations, the private
sector, and individuals.
Global Subsidies Initiative
The IISD Global Subsidies Initiative (GSI) supports international Global Subsidies Initiative
processes, national governments and civil society organizations to align
International Environment
subsidies with sustainable development. GSI does this by promoting
House 2,
transparency on the nature and size of subsidies; evaluating the
7–9 chemin de Balexert
economic, social and environmental impacts of subsidies; and, where
1219 Châtelaine
necessary, advising on how inefficient and wasteful subsidies can best be
Geneva, Switzerland
reformed. GSI is headquartered in Geneva, Switzerland, and works with
Canada R3B 0T4
partners located around the world. Its principal funders have included
the governments of Denmark, Finland, New Zealand, Norway, Sweden, Tel: +1 (204) 958-7700
Switzerland and the United Kingdom, as well as the KR Foundation. Website: www.iisd.org/gsi
Twitter: @globalsubsidies
Indonesia’s Energy Support Measures: An inventory of incentives
impacting the energy transition
June 2022
Written by Anissa Suharsono, Murtiani Hendriwardani, Theresia Betty
Sumarno, Jonas Kühl, Martha Maulidia, and Lourdes Sanchez
IISD.org/gsi iiIndonesia’s Energy Support Measures
Acknowledgements
The authors are very grateful for the valuable insights and recommendations received
throughout the writing of this report. A special thank you to Balasubramanian Viswanathan
and Tara Laan of the IISD for their contributions to the methodology and data estimates, as
well as the following individuals:
• Surya Darma, Indonesia Renewable Energy Society (METI-IRES)
• Dewa Ekayana, Badan Kebijakan Fiskal (Fiscal Policy Agency), Ministry of Finance of
Republic of Indonesia
• Thomas Capral Henriksen, The Royal Danish Embassy in Indonesia
• Nicki Khorram-Manesh, Embassy of Sweden in Indonesia
• Bronwen Tucker, Oil Change International
• Cahyadi Indrananto and Florian Kitt, Asian Development Bank, Jakarta
• Elrika Hamdi, Vibhuti Garg, and Putra Adhiguna, Institute for Energy Economics and
Financial Analysis
• Angela Picciariello, Chido Muzondo, Greg Muttitt, Jobit Parapat, Lucile Dufour,
Lucky Lontoh, Max Schmidt, M. Jeffry Giranza, Philip Gass, and Richard Bridle, of
the International Institute for Sustainable Development.
IISD.org/gsi iiiIndonesia’s Energy Support Measures
Executive Summary
Access to affordable, reliable, and clean energy is critical for economic and social
development. Most governments—including Indonesia’s—therefore provide financial support
and incentives for energy production and consumption. Careful scrutiny of these policies is
necessary to determine whether they are helping or hindering the government’s objectives to
expand energy access, improve energy security, and promote the transition to clean energy.
The Government of Indonesia (the “government” or the “GoI”) provides a range of energy
support measures, incentives, and interventions that stimulate energy production and
consumption, some of which are directed to support and protect the vulnerable segments
of the population (e.g., poor households and small businesses). The COVID-19 National
Economic Recovery Program is one such support measure that, like many others provided
to the energy sector, disproportionately benefited the fossil fuels sector. There are also other
measures aiming to promote a transition toward clean and renewable energy, although today,
government support is still predominantly addressed to the fossil fuel sector.
This first-of-a-kind report has been developed to identify all the support measures and
incentives that are available and have been given to the Indonesian energy sector by the GoI.
This stocktaking report takes into account support provided for six types of energy: 1) oil and
gas, 2) coal, 3) electricity, 4) renewable energy,1 5) biofuels, and 6) electric vehicles (EVs) and
batteries for EV (EV and batteries). A substantial amount of support was provided for the
fossil fuels sector, comprising oil and gas, coal, and electricity.2
The definition of “support measure” used in this report is based on the definition of
“subsidy” from the Agreement of Subsidies and Countervailing Measures of the World Trade
Organization (WTO) (1994), while the estimation methods were based on the Methodology
for SDG Indicator 12.c.1 (Wooders et al., 2019).
The report covers the period from FY 2016 to FY 2020.3 Throughout the time period
observed, a total of 78 measures were identified. Out of those measures, 37% (29 measures)
were estimated, representing at least IDR 1,225 trillion (~USD 83.7 billion)4 of support to the
energy sector, distributed as follows (see Figure ES1):
• 94.1% of the total value estimated or IDR 1,153 trillion (~ USD 79 billion) has been
given to support the production and consumption of fossil fuels—oil and gas ( 38.8%),
coal (18%), and electricity (37.3%).
1 Indonesia defines clean, renewable energy as Energi Baru Terbarukan (EBT) or New and Renewable Energy
(MEMR, 2008), but the definition of what constitutes “Baru” (or “new”) is unclear (i.e., specific types or sources
of energy). In this report, the term renewable energy includes energy from hydro, geothermal, solar, wind, biomass,
biogas, and other clean and renewable forms of energy generation.
2 In Indonesia, over 90% of electricity consumed is sourced from fossil fuels. Therefore, measures supporting the
electricity sector are considered fossil fuel support.
3The fiscal year for the State Budget of the Government of Indonesia starts in January and ends in December.
The State Budget for the following year is usually ratified before November of the previous year.
4 IDR to USD Exchange Rate is based on the rate published by the Indonesian Central Bank, Bank Indonesia, as
of May 20, 2022.
IISD.org/gsi ivIndonesia’s Energy Support Measures
• Less than 1% of the total value of support measures estimated (0.94%) has been
provided to incentivize the renewable energy sector.
• 5% of estimated support, IDR 61 trillion (~ USD 4.2 billion), went to the biofuels
industry, most of which (97%) was derived from a levy on crude palm oil export
allocated to a dedicated fund known as the Crude Palm Oil Supporting Fund.
• 0.002% of estimated support or IDR 19 billion (USD 1.3 million) went to the
emerging but growing EV and EV battery industries.
Figure ES1. Support measures provided to the energy sector in Indonesia, FY 2016 to
FY 2020
300
EV and batteries
Renewable
250
Biofuels
Coal
Electricity
200 Oil and gas
IDR trillion
0.002%
150 EV and battery
0.94%
Renewable energy
4.97%
100
Biofuels
50
94.1%
Fossil fuels
0
2016 2017 2018 2019 2020
Source: Authors’ calculations.
IISD.org/gsi vIndonesia’s Energy Support Measures
These figures are likely to be an underestimation since many of the support measures
could not be quantified due to data limitations (data not available, data cannot be verified,
or identified support or incentive has yet to be disbursed). Whenever available, official
government data were used to provide quantitative estimates.
Most of the support measures 77% identified (60 measures out of 78) were for the benefit of
energy producers. Only 20% of all measures were given to support consumers, and the rest of
the measures (three) were provided to benefit both producers and consumers.
Over the 5-year period observed, the number of support measures given to the Indonesian
energy sector has steadily increased throughout the years, with a particularly sharp increase in
2020. This is largely attributed to the economic recovery packages that were given mostly to
the fossil fuel sector through state-owned enterprises bailouts (Energy Policy Tracker, 2020).
Indonesia is a net oil importer, and under the current context of high international oil prices,
the risk of a price increase would impact the retail prices in Indonesia. In turn, this could
translate into the GoI increasing the amount of support to protect purchasing power and
control inflation. As this report is being published, the GoI announced an increase in fossil
fuels subsidies in response to the record-high international oil prices (Anggela, 2022; Antara,
2022; Ulya, 2022).
Given its nationally determined contribution (NDC) and renewable energy targets, it would
be reasonable for Indonesia to focus more on creating effective incentive mechanisms to
further promote the adoption and development of renewable energy. Shifting or reallocating
support from fossil fuels to renewable energy would be a good start.
Key Findings From Our Research
Government support for fossil fuels and fossil fuel-generated electricity
remains substantially higher than for renewable energy, undermining the
effort to achieve 23% of renewable sources in the energy mix by 2025 and net-zero
carbon emissions by 2060. This support also serves to lock in fossil fuel production
and consumption. Switching support from fossil fuels to clean energy would help
Indonesia accelerate its energy transition and reach its renewable energy targets.
Support measures for oil and gas have been fluctuating rather
significantly. Based on the total quantified measures, the amount provided
increased from IDR 73 trillion (USD 5.4 billion) in FY 2016 to its peak of
IDR 126 trillion (USD 8.7 billion) in FY 2018, before tapering off to IDR 73.5
trillion (USD 5 billion) in FY 2020. Most of the support for oil and gas was
in the form of tax exemptions or relaxations (government revenue foregone)
intended to encourage exploration activities, therefore mainly benefiting
producers. A total of 23 support measures have been identified for oil and gas,
but only seven were quantified.
Support for coal has also risen considerably and is likely to continue to
rise. In real terms, total quantified support measures for coal increased between
FY 2016 and FY 2020, from IDR 19.5 trillion (USD 1.5 billion) to IDR 61.04
IISD.org/gsi viIndonesia’s Energy Support Measures
trillion (USD 4.2 billion). Support for coal was also mostly in the form of tax
exemptions or relaxations (government revenue foregone), mainly benefiting coal
producers. In total, 12 support measures were identified for coal, but only three
were quantified. In the future, the number of coal support measures will most
likely increase, as new measures to encourage the coal derivatives industry, such
as dimethyl ether, are anticipated.
PT Perusahaan Listrik Negara, the state-owned electricity provider,
continues to benefit from government support. The most important support
received was in the form of direct transfers from the government to compensate
for the below-market pricing of the retail tariff. This compensation accounted for
between 65% and 80% of all the quantified spending to support the electricity
sector between FY 2016 and FY 2019 and about 82% in FY 2020. The sector
also benefits from several tax exemptions and relaxations for producers of
electricity (non-renewable), most of which could not be quantified. Most
electricity in Indonesia (~91%) is generated using fossil fuels, notably coal, thus
support for electricity can be considered to be supporting fossil fuels. In total, 12
support measures were identified for fossil fuel-based electricity, but only seven
were quantified.
Incentives for renewable energy are undermined by the support given to
fossil fuels, despite geothermal enjoying most of the related funding from
the government. Renewable energy received less than 1% of all support provided
to the energy sector over the past 6 years, despite the target of achieving 23%
renewable mix by 2030. The high potential for capturing solar energy is not reflected
in government support. More support for renewables to mobilize at least IDR 500
trillion (USD 30 billion) in additional investment is required (Pribadi, 2019) if
Indonesia is to meet its NDC and renewable energy targets. A total of 16 support
measures were identified for renewable energy: only five were quantified, and some
of them (like the feed-in tariff) were phased out within the period considered.
Support for biodiesel from the Crude Palm Oil (CPO) export levy
accounted for the majority of subsidies for biofuels. The total quantified
subsidies received from FY 2016 to FY 2020 increased from IDR 10.8 trillion
(USD 740 million) to IDR 31 trillion (USD 2.1 billion). Since incentives for
biofuel given to biodiesel producers are dependent on the fluctuating CPO market
price, the amount of incentives going forward might fluctuate. Three support
measures were identified for biofuels.
Since both the EV and EV battery industries are emerging sectors, most
of the identified measures are relatively new, and they were not readily
quantifiable. For the most part, the GoI has only supported the EV and EV
battery industries since 2019, when Bali became the first provincial government to
implement electric bus regulations (Thorn, 2021). A total of 12 support measures
were identified for EV and EV batteries, but only three were quantified. Most of
these measures were government revenue foregone in the form of tax breaks or
special taxes that benefit the consumers.
IISD.org/gsi viiIndonesia’s Energy Support Measures
Table of Contents
Introduction............................................................................................................................................................................. 1
The Energy Landscape in Indonesia .................................................................................................................................... 2
Approach and Scope ........................................................................................................................................................................ 3
1.0 Oil and Gas....................................................................................................................................................................... 5
Measures Quantified ........................................................................................................................................................................6
Measures not Quantified................................................................................................................................................................7
Future Trends............................................................................................................................................................................................8
2.0 Coal...................................................................................................................................................................................... 9
Measures Quantified......................................................................................................................................................................10
Measures not Quantified.............................................................................................................................................................11
Future Trends..........................................................................................................................................................................................11
3.0 Electricity........................................................................................................................................................................13
Measures Quantified ..................................................................................................................................................................... 14
Measures not Quantified ............................................................................................................................................................15
Future Trends ........................................................................................................................................................................................15
4.0 Renewable Energy...................................................................................................................................................... 17
Measures Quantified ..................................................................................................................................................................... 18
Measures not Quantified ............................................................................................................................................................19
Future Trends.........................................................................................................................................................................................20
5.0 Biofuels............................................................................................................................................................................21
Measure Quantified ........................................................................................................................................................................ 23
Measures not Quantified ........................................................................................................................................................... 24
Future Trends......................................................................................................................................................................................... 24
Measures Quantified...................................................................................................................................................................... 28
Measures not Quantified............................................................................................................................................................ 29
Future Trends......................................................................................................................................................................................... 29
Concluding Thoughts and Remarks .........................................................................................................................31
References ............................................................................................................................................................................33
Appendix 1. Approach and Methodology............................................................................................................... 39
Appendix 2. Indonesia’s Energy Support Measures by Energy Source.....................................................41
IISD.org/gsi viiiIndonesia’s Energy Support Measures
List of Figures
Figure ES1. Support measures provided to the energy sector in Indonesia, FY 2016 to FY 2020.....v
Figure 1. Indonesia’s primary energy supply by source, 2021 .................................................................................... 2
Figure 2. Energy sectors observed....................................................................................................................................................4
List of Tables
Table 1. Quantified government support for oil and gas in Indonesia by mechanism
(in IDR trillion)....................................................................................................................................................................................................7
Table 2. Quantified government support for coal in Indonesia by mechanism
(in IDR trillion)................................................................................................................................................................................................10
Table 3. Quantified government support for electricity in Indonesia by mechanism
(in IDR trillion).................................................................................................................................................................................................15
Table 4. Quantified government support for renewable energy in Indonesia by mechanism
(in IDR trillion).................................................................................................................................................................................................19
Table 5. Quantified government support for biofuel in Indonesia by mechanism
(in IDR trillion)................................................................................................................................................................................................ 24
Table 6. Quantified government support for EV & battery in Indonesia by mechanism
(in IDR billion)................................................................................................................................................................................................. 28
IISD.org/gsi ixIndonesia’s Energy Support Measures
Introduction
The Indonesia’s Energy Support Measures: An Inventory of Incentives Impacting the Energy
Transition report is the first of its kind. It is a report—an inventory—designed to identify all
support measures available for the energy sector in Indonesia from FY 2016 to FY 2020. The
report includes support measures given to various types or sources of energy, and it serves as
a starting point for the Government of Indonesia (GoI), as well as all stakeholders, concerned
citizens, and the wider public to allow them to “follow the money”: to track the flow of public
funding and to understand how public money is being spent on different types of energy.
Through data visualization of the flow and allocation of the support measures throughout the
period observed, this report also aims to shed light on government spending for fossil fuels vis-
à-vis renewable energy and clean technology.
This stocktaking report takes into account support provided over 5 years, from FY 2016 to
FY 2020, for six energy sources: 1) oil and gas, 2) coal; 3) electricity; 4) renewable energy5; 5)
biofuels; and 6) electric vehicles (EVs) and battery for EV (EV and batteries).
This report has three parts:
1. This companion brief.
2. A catalogue of all the support measures identified during the period observed, FY
2016 to FY 2020, presented in a table format in Appendix 2: Indonesia Energy
Support Measures by Energy Source.
3. A data visualization of all support measures that is available and can be accessed
through the following link.
The support measures identified in this report benefit mostly energy producers rather than
consumers. The report defines “support measure” following the definition of “subsidy”
from the Agreement of Subsidies and Countervailing Measures (ASCM) of the World Trade
Organization (WTO) (1994). Thus, “support” refers to a government policy or program that
creates a financial contribution or infers a policy advantage to non-government actors, and the
report finds that support measures for the Indonesian energy sector come in many different
kinds or forms, including incentives, interventions, loan and credit guarantees, as well as
measures that are not clearly and/or consistently outlined in the state budget.
In all, 78 support measures were identified as having been provided by the GoI through the
following types of mechanisms:
• 55 in the form of government revenue foregone
• 16 in the form of direct and indirect transfer of funds
• 6 in the form of income or price support
• One in the form of provision of goods or services below market value.
5 Indonesia defines clean, renewable energy as Energi Baru Terbarukan (EBT) or New and Renewable Energy
(MEMR, 2008), but the definition of what constitutes “Baru” or “new” is unclear (i.e., specific types or sources of
energy). In this report, the term “renewable energy” includes energy from hydro, geothermal, solar, wind, biomass,
biogas, and other renewables.
IISD.org/gsi 1Indonesia’s Energy Support Measures
Due to data limitations (e.g., data not available, source of data could not be verified, and/or
measures are not yet applicable), only 29 support measures identified were quantified (37%),
while the rest (63%) were not quantified. Data availability and transparency would be critical
to arrive at a more comprehensive understanding of the size and number of support measures
available for the energy sector in Indonesia.
It is anticipated that this report would encourage further research and a more in-depth
analysis of the size and types of support measures, prioritization of the different support
measures and energy sources, as well as the socio-economic and policy implications of such
measures going forward.
The Energy Landscape in Indonesia
Indonesia is a vast archipelago with over 17,000 islands (Badan Perencanaan Pembangunan
Nasional - BAPPENAS, 2022; Ministry of Trade, n.d.) and more than 270 million people
(World Bank, n.d.). It is the largest member of the Association of Southeast Asian Nations
and accounts for 40% of energy consumption in the region. Energy demand in Indonesia
is predicted to increase by 80%, while electricity demand is anticipated to triple by 2030
(Badan Koordinasi Penanaman Modal (Indonesian Investment Coordinating Board)
[BKPM], 2021). The Indonesian economy is based on agriculture and crude oil production,
and the energy sector is the second highest contributor of greenhouse gas emissions after
agriculture (BKPM, 2021).
According to a recent energy sector assessment by the Asian Development Bank (2020),
energy production in 2019 was based mostly on fossil fuels, comprising 616 million metric
tons of coal, 2.8 million standard cubic feet of natural gas, and 272 million barrels of oil.
Fossil fuels also remain the main source of energy, with coal, gas, and oil accounting for the
largest share of primary energy supply by source (see Figure 1)—approximately 84% for 2021
(Ministry of Energy and Mineral Resources [MEMR], 2022).
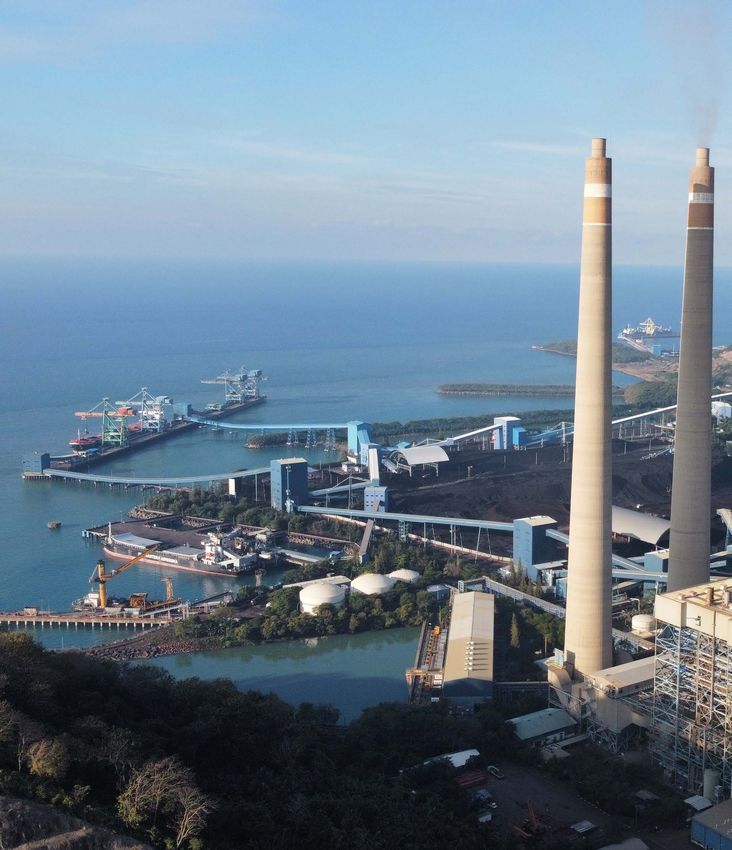
Figure 1. Indonesia’s primary energy supply by source, 2021
4.24%
11.35% Biofuels
Renewable energy
16.16%
Gas
36.15%
Coal
32.10%
Oil
Source: Authors’ diagram based on MEMR, 2022.
IISD.org/gsi 2Indonesia’s Energy Support Measures
The GoI has recognized the need to move toward clean, sustainable energy (Asian
Development Bank, 2020; BKPM, 2021), and to that effect it has committed to achieve
23% of renewable energy mix by 2025 and net-zero by 2060. In 2020, total electricity
consumption was about 265 TWh, down from 271 TWh in 2019 (International Energy
Agency, 2020), but the electricity mix in Indonesia remains dominated by oil and coal (BP,
2021; Enerdata, 2022).
With Indonesia holding the G20 Presidency in 2022, this is a momentous opportunity for
the government to show that Indonesia has an important role to play in ensuring that public
money is being used appropriately and effectively to achieve a sustainable recovery and
clean energy transition, which are the priority issues for the Indonesia G20 Presidency (G20
Indonesia 2022, n.d.).
Indonesia has announced its commitment to reach net-zero by 2060 and to prioritize the
clean energy transition (Ministry of Finance, 2021); as such, this report will be relevant to see
whether Indonesia’s policy settings are helping achieve this goal.
Approach and Scope
The report defines “support measure” following the definition of “subsidy” from the WTO
ASCM, which includes the following features (WTO, 1994):
1. Direct and indirect transfers of funds and liabilities, or the potential transfer of funds
and liabilities (such as budget outlays, loans, and credit guarantees).
2. Government revenue foregone (reduced tax rates and tax exemptions).
3. Provision of goods or services below market value (such as land or water).
4. Income and price support through market regulations (including non-enforcement).
For the purpose of this report, the term “support measure” has a slightly wider scope
than the WTO ASCM subsidy definition. For example, we also include Domestic Market
Obligation (DMO) and the Crude Palm Oil (CPO) Fund for biofuels. Therefore, “support”
refers to a government policy or program that creates a financial contribution or confers a
policy advantage to non-government actors that could include direct budgetary transfers,
tax expenditures, loans from public institutions, credit guarantees, spending by state-owned
enterprises, and certain forms of government debt.
To calculate the monetary value of the support provided, the Methodology for SDG Indicator
12.c.1 (Wooders et al., 2019) has been used to arrive at an estimate for all six types of energy
that serve as the primary sources of electricity in Indonesia, as illustrated in Figure 2:
IISD.org/gsi 3Indonesia’s Energy Support Measures
Figure 2. Energy sectors observed
Oil and gas Coal Electricity Renewable Biofuels EV and
energy batteries
Whenever available, official government data were used to provide quantitative estimates.
Based on data availability, 29 of the identified support measures were quantified (37%), while
the rest (63%) were not quantified.
A support measure is considered quantified if there is data available for any given year. When
data are not available for a quantified measure, the value of the support measure is noted as
N/A (not available) for the relevant year. When not yet applicable, which can be due to the
support measure not being provided for the particular year or the measure being for future
implementation (i.e., approved but to be implemented in the following year), it is indicated as
N/P (not applicable).
A detailed explanation of the methods by which the various support measures have been
calculated and categorized is provided in Appendix 1: Approach and Methodology.
Appendix 2: Indonesia’s Energy Support Measures by Energy Source provides a
comprehensive listing of all 78 support measures identified.
IISD.org/gsi 4Indonesia’s Energy Support Measures
1.0
Oil and Gas
IISD.org/gsi 5Indonesia’s Energy Support Measures
Crude oil production in Indonesia has been declining since 2009. The production
decline is mainly caused by mature oil wells, while the growth of new wells
is relatively limited. Since then, Indonesia has mainly been relying on crude
oil imports to meet domestic demand (Dewan Energi Nasional, 2019). As a
consequence, the GoI has provided various incentives and support measures to promote
investment in the oil and gas upstream sector through tax deductions in the exploration and
exploitation phases, as well as new schemes for upstream oil and gas contracts. Most of the
support measures are in the form of government revenue foregone and aim to encourage
exploration activities, therefore mainly benefiting the producers.
A total of 23 support measures for the oil and gas sector from FY 2016 through FY 2020 have
been identified. Of these, four are for the benefit of the consumers and the rest are for the
benefit of the producers. These measures can be classified as follows:
1. 19 measures represent government revenue foregone (tax exemptions and reductions).
2. Two are in the form of income or price support.
3. One is in the form of direct and indirect transfer of funds.
4. One is in the form of the provision of goods or services below market value.
The total quantified support measures for oil and gas in FY 2020 reached IDR 73.5 trillion
(USD 5 billion). The overall amount of support provided has been fluctuating, with an
upward trend between FY 2016 and FY 2018, from IDR 73 trillion (USD 5.4 billion) in FY
2016 to IDR 126 trillion (USD 8.7 billion) in FY 2018, and then a downward trend from
FY 2019. The lower amount of support provided in FY 2020 was caused by lower oil prices
and also lower demand due to the COVID-19 pandemic. Only 30% (seven out of 23) of the
subsidies could be quantified due to the lack of necessary data.
Table 1 summarizes the total estimates between FY 2016 and FY 2020, while details on
the different support measures for oil and gas can be found in Appendix 2. A: Oil and Gas
Support Measures.
Measures Quantified
Out of the 23 oil and gas support measures that were identified, only seven were quantified.
The top two quantified measures in order of magnitude are:
• Total Reimbursement for PT Pertamina (both already paid and still due6). The
number throughout FY 2016–FY 2020 reached IDR 432 trillion (USD 30.8 billion).
• Value-added tax (VAT) exemption for crude oil and natural gas sales, totalling IDR
27 trillion (USD 1.94 billion) throughout FY 2016–FY 2020, with the largest amount
distributed in 2017.
6 The amount for Total Reimbursement for PT Pertamina is taken from their Annual Report, where it includes
the number for paid and due reimbursement from the GoI. As of the end of 2021, the GoI still owes PT Pertamina
IDR 109 trillion (USD 7.6 billion) in unpaid support throughout the year. The amount of support measure that is
still due is recorded separately for each financial year.
IISD.org/gsi 6Indonesia’s Energy Support Measures
The reimbursement for PT Pertamina is for below-market pricing of certain fuels for
consumers. The GoI has set retail prices for certain types of gasoline, diesel fuel (“Solar”), and
kerosene below market since 1967. Three-kg liquefied petroleum gas (LPG) canisters are also
subsidized.
In 2015, following a decline in oil prices, the subsidies for gasoline (Premium) were entirely
removed, and diesel was set at IDR 1,000/litre. Given the unfavourable market conditions at
the time, this temporary removal saved the GoI around IDR 211 trillion. The compensation
from the GoI for Pertamina’s losses as the result of the lower selling price is recorded as a
support measure for fuel, with the 3-kg LPG canister as the highest item subsidized. The
amount recorded for the item “VAT exemption for crude oil, coal and natural gas” was
estimated based on the foregone revenue (10% VAT) from the annual sales value for the
commodities.
Table 1. Quantified government support for oil and gas in Indonesia by mechanism (in
IDR trillion)
Mechanism FY 2016 FY 2017 FY 2018 FY 2019 FY 2020
Direct and indirect transfer
54.51 90.76 120.03 98.34 68.58
of funds and liabilities
Government revenue
foregone (tax exemptions 18.47 8.71 6.03 4.99 4.93
and reductions)
Total volume of quantified
support measures 72.98 99.47 126.06 103.33 73.52
(in IDR trillion)
Source: Authors’ calculations.
Measures not Quantified
Due to the lack of available data, 16 of the identified support measures were not quantified:
they were in the form of government revenue foregone, where no official government data
were available to facilitate quantification. These incentives were given to the oil and gas sector
in the form of tax deductions or relaxations, such as import duty exemptions and income tax
Article 22 exemptions, where these items are not recorded in the state budget, nor is there
any requirement for the beneficiaries to declare them. Information on the effective tax rate or
the extent to which the tax deduction was utilized by the oil and gas companies was also not
available. Unlike quantified tax subsidies, such as the VAT exemption, it was also not possible
to identify an appropriate benchmark to use as a reference to estimate the tax exemptions.
IISD.org/gsi 7Indonesia’s Energy Support Measures
Future Trends
The total reimbursement for PT Pertamina for under-pricing the retail price of fuel has been
the largest form of support for all the years observed and remains so to date (see Appendix
2. A: Oil and Gas Support Measures). There have been several plans to reform the support
provided for retail fuel, including the request from PT Pertamina to eliminate Premium
RON 88 (Asmarini, 2021), a subsidized fuel. In addition to eliminating Premium, PT
Pertamina has also suggested the reformation of the distribution method, from reimbursing
Pertamina to giving out targeted support measures directly to eligible individuals, according
to the Integrated Social Welfare Database (Data Terpadu Kesejahteraan Sosial/DTKS). This
targeting method would be in line with the incentive reform for 3-kg LPG canisters already
approved by the Parliament (Putri, 2021), in which the support measures have already been
distributed directly to the targeted individuals. This move is expected to reduce the amount of
government support for oil and gas.
However, with Indonesia being a net oil importer, the risk of increasingly high oil prices
would eventually impact the retail prices in Indonesia. This could, in turn, translate into the
government increasing the amount of support measures to protect purchasing power and
control inflation.
IISD.org/gsi 8Indonesia’s Energy Support Measures
2.0
Coal
IISD.org/gsi 9Indonesia’s Energy Support Measures
Coal plays an important role in the Indonesian economy. Indonesia became a
major coal-producing and -consuming country after the coal mining sector was
reopened to foreign investment in the 1990s (Indonesia-Investments, 2018). In the
first half of 2021, the coal industry contributed around USD 38 billion in export
earnings for the country (Nangoy & Suroyo, 2021). Coal is an important source of electricity
in Indonesia. It is considered crucial to economic growth and, therefore, heavily subsidized
(Suharsono & Gençsü, 2019).
Twelve coal support measures provided from FY 2016 through FY 2020 have been identified,
four of which have been quantified. All of the identified coal support measures are provided
for coal producers in the form of tax benefits that improve production margins.
Details on the different support measures for coal can be found in Appendix 2. B: Coal
Support Measures.
In real terms, the total quantified support measures for coal increased significantly throughout
the period observed, from IDR 19.4 trillion (USD 1.4 billion) in FY 2016 to IDR 61.04
trillion (USD 4.2 billion) in FY 2020.
The 12 support measures identified can be classified as follows:
• Nine measures are in the form of government revenue foregone.
• Two measures are direct and indirect transfers of funds and liabilities.
• One measure is for income or price support.
Measures Quantified
Table 2 summarizes the total coal support measures estimated, covering the period from
FY 2016 to FY 2020. Only measures in the form of government revenue foregone were
quantified. Government support for coal reached its peak in FY 2019, totalling IDR 66 trillion
(USD 4.8 billion). In FY 2020, the value decreased slightly, possibly due to a drop in overall
electricity generation (as coal is the main source) and a decline in coal exports attributable to
COVID-19 (MEMR, 2021; Oxford School of Enterprise and the Environment, 2020).
Table 2. Quantified government support for coal in Indonesia by mechanism (in IDR
trillion)
Mechanism FY 2016 FY 2017 FY 2018 FY 2019 FY 2020
Government revenue
19.41 21.78 51.76 66.34 61.04
foregone
Direct transfer 0.092 – – – –
Total volume of quantified
support measures 19.5 21.78 51.76 66.34 61.04
(in IDR trillion)
Source: Authors’ calculations.
IISD.org/gsi 10Indonesia’s Energy Support Measures
The three largest support measures could be quantified based on in-house estimates:
• Preferential royalty and corporate tax rates for small coal mining licence holders.
Although the report is only able to quantify the last 3 years for one province (FY
2018–FY 2020) using production data from only one main coal-producing province
(East Kalimantan), the number reached IDR 93 trillion (USD 3.5 billion).
• Preferential export tax rate on coal totalling IDR 71.6 trillion (USD 5.1 billion)
throughout FY 2016–FY 2020, with the largest amount occurring in 2018, because of
the higher price of coal at the time. The amount was estimated based on the foregone
revenue from the applicable 1.5% coal export tax rate compared to the 7.5% export
tax rate that applies to other mineral commodities.
• VAT exemption for coal (also applying to crude oil and natural gas), totalling IDR
55 trillion (USD 3.9 billion) throughout FY 2016–FY 2020, with the largest amount
occurring in 2019—IDR 13.6 trillion (USD 966 million). The amount was estimated
based on the foregone revenue (10% VAT) from the annual sales value for coal.
Measures not Quantified
Due to the lack of or limited data to estimate the value of support measures provided, eight
support measures are not quantifiable, and most of these measures (seven) were in the form of
government revenue foregone.
This was because tax deductions or relaxations are not recorded in the state budget, nor is
there any requirement for the beneficiaries to declare them. Unlike the quantified measures,
it was not possible to identify either a benchmark rate, a subsidized rate, or the extent to
which the measures were utilized as tax deductions by companies. The only non-tax measures
are a loan guarantee and above-market pricing for low-quality coal provided to mine-mouth
power plants. These were not quantified because no official government data were available to
facilitate quantification.
Given the number of unquantifiable measures, it is reasonable to assume that the actual
amount of support given to the sector is much larger than what has been identified, with an
annual amount that is steadily increasing, from IDR 19.4 trillion (USD 1.45 billion) in FY
2016 to IDR 61.04 trillion (USD 4.2 billion) in FY 2020.
Future Trends
Since the ratification of the Job Creation Law (UU no. 11/2020) in 2020, the coal sector
has been receiving more support, mostly in the form of preferential taxation and facilitation
of business practices such as ease in getting contract extensions and removal of the limit on
mining production areas. Although the law now includes coal as a taxable good on which a
10% VAT will be imposed starting in 2020, this tax will be borne by the state-owned electricity
company, PT Perusahaan Listrik Negara (PLN). This will translate into a higher financial
burden for PLN.
IISD.org/gsi 11Indonesia’s Energy Support Measures
The rise of coal prices in 2021 caused many coal producers to prefer exporting production
at international prices instead of fulfilling the DMO—which mandates domestic coal
producers to sell part of their production to the domestic market at discounted prices, where
it is generally used in coal-fired power plants to generate electricity—raising concerns of a
domestic coal shortage that peaked in late 2021. This resulted in a short-lived export ban
in January 2022. On the same day the export ban was lifted, it was also announced that the
government is currently discussing a new scheme for PLN to purchase coal for its power
plants, in which PLN will be required to purchase it at the market price, no longer using the
DMO price of USD 70 per metric ton.
Recently, Indonesia announced a new regulation that introduces a carbon tax at a minimum
rate of IDR 30 (USD 0.0021) per kilogram of carbon dioxide equivalent to be applied only
to coal-fired power plants starting in July 2022, at the floor rate. Although the announcement
of the carbon tax is generally welcomed, it has already faced resistance from the coal industry.
The Indonesia Coal Miners Association requested a postponement of the implementation of
the tax until further discussions. PLN has also expressed concern over rising power prices that
will translate into either a higher electricity tariff to the customer or increasing subsidies and
compensation from the government (Ungku & Christina, 2021).
Following its commitment from the 26th Conference of the Parties to the United Nations
Framework Convention on Climate Change and PLN’s Electricity Supply Business Plan
(RUPTL) 2020–2028 to dial back the usage of coal power, the GoI is now looking to
develop the coal derivatives industry, especially the conversion from coal to dimethyl ether,
in the hopes of reducing LPG imports (Wareza, 2022). The President has also expressed his
intention to ban the export of coal as a raw mineral (Kencana, 2022). The form of support
to the coal industry in the future will most likely be along the lines of encouraging the coal
derivative industry.
IISD.org/gsi 12Indonesia’s Energy Support Measures
3.0
Electricity
IISD.org/gsi 13Indonesia’s Energy Support Measures
Over the past decade, installed electricity capacity in Indonesia more than doubled,
from about 33 GW in 2010 to about 70 GW in 2020, with most capacity generated
from coal, followed by gas. Part of this increase was to significantly improve
Indonesia’s electricity access rate to 99.4% in 2021, up from 67% in 2010.
In all, 12 support measures for electricity from FY 2016 to FY 2020 have been identified.
Nine of these measures were applicable throughout the entire period, while three measures
were applicable only in 2020 as part of the government’s COVID-19 recovery package.
The electricity support measures can be classified as follows:
• Six in the form of direct transfers of funds.
• Five in the form of government revenue foregone.
• One in the form of income or price support.
With the exception of one measure, all of the electricity support measures almost equally
benefit producers (five measures) and consumers (six measures). Of the identified measures,
58% (seven out of a total of 12 measures) were quantified, and mostly given to poor
households within the R-1 tariff group (450 VA–2200 VA). Measures identified under
“electricity” mostly benefit fossil fuels, as the vast majority of electricity is generated from coal,
oil, and gas (91% of total electricity generation). Therefore, they can be considered fossil fuel
support.
Details on the different support measures for electricity can be found in Appendix 2. C:
Electricity Support Measures.
Measures Quantified
A total of seven measures could be quantified (i.e., data for these support measures are
available), including three COVID-19-related support measures for 2020. Five of these
quantified measures took the form of direct transfers of funds, while the remaining two
measures represent government revenue foregone and income or price support.
All but one of these quantified measures benefit the consumers. The other quantified measure
is for the benefit of electricity producers.
Until FY 2019, the quantified amount remained fairly stable in the range of IDR 85
trillion and IDR 94 trillion. In FY 2020, the amount of the quantified measures increased
significantly by about 72% compared to FY 2019, mainly as a result of the additional
COVID-19-recovery related support. Throughout the years, the largest quantified measure
was a transfer that the government paid to PLN. This transfer was provided in the annual
state budget (APBN) to compensate PLN for losses that occur due to the below-market tariff
setting by the government for end-user electricity prices. This compensation accounted for
between 58% and 67% of all the quantified spending to support the electricity sector between
FY 2016 and FY 2019 and about 40% in FY 2020.
The VAT exemption for electricity procurement and the DMO were the second and third
largest quantified support measures between FY 2016 and FY 2019.
IISD.org/gsi 14Indonesia’s Energy Support Measures
All three measures explained above (direct transfer to PLN, DMO, and VAT exemption)
contributed to the below-cost pricing of electricity in Indonesia; however, there are
differences regarding who benefits from the support provided. For example, all consumers
benefit from the DMO, and all consumers (except households with power connections
above 6,600 VA) benefit from the VAT exemption whereas only households, businesses,
and government buildings with 450 VA–950 VA power capacity benefit from the below-
cost tariffs. In 2020, the one-time compensation payment to support PLN as part of the
COVID-19 Economic Recovery Program was the second largest quantified measure. To
a large extent, all of these quantified measures were support given to the fossil fuel sector
since the vast majority of electricity is generated by coal, oil, and gas (roughly 91% of total
electricity generation) (PLN, 2021a).
Table 3. Quantified government support for electricity in Indonesia by mechanism (in
IDR trillion)
Mechanism FY 2016 FY 2017 FY 2018 FY 2019 FY 2020
Direct and indirect transfer
63 51 71.5 74 92.1
of funds and liabilities
Government revenue
23.8 5.7 6.4 6.6 6.4
foregone
Income or price support 9.4 10.3 11.2 12.2 13.3
Total volume of quantified
support measures 96.2 67 89.2 92.7 111.7
(in IDR trillion)
Source: Authors’ calculations.
Measures not Quantified
Five measures could not be quantified. Four of them were in the form of tax exemptions,
and one was a direct transfer of funds in the form of a credit support through the Indonesia
infrastructure guarantee fund that provides government guarantees for public–private
partnership infrastructure projects in Indonesia. The tax exemption measures include an
import duty exemption covering equipment and machines for all types of power-generation
projects, an income tax deduction, and an extension period of income tax deductions on losses
arising from investment on losses to support new types of fossil power generation, such as
those using hydrogen, coalbed methane (an unconventional form of natural gas found in coal
deposits or coal seams), and liquefied coal or gasified coal.
Future Trends
According to PLN’s RUPTL 2021–2030, electricity demand will grow at an average rate
of 4.9% per year until 2030. To meet this growing demand, electricity capacity needs to be
further expanded, and the RUPTL aims to increase capacity by 40.6 GW by 2030, 51.6%
IISD.org/gsi 15Indonesia’s Energy Support Measures
of which is to be met through renewable sources and the rest (48.4%) through fossil fuels
(PLN, 2021b).
In addition, the building of almost 48,000 km of transmission lines is planned, as well as
substations with a capacity of about 76,000 megavolt amperes for distribution. All these
require PLN—as well as independent power producers—to invest an average of around IDR
129 trillion annually (Pratiwi, 2021).
Yet, PT PLN is carrying a large debt of several hundred trillion IDR, which is why the GoI
is considering restructuring the company to increase its budget efficiency (Pratiwi, 2021).
According to the plan, to be finalized in 2022 and fully implemented by 2025, two sub-entities
are being considered:
• One is a holding company that will focus on
° Handling transmission, distribution, and retail, GENCOs7 subsidiary (with
transferred assets) to handle generation assets.
° Another subsidiary that will focus on non-power business (e.g., fibreoptics and
charging stations).
• A second holding company that will focus on power plant expansion and electricity
generation will enable the necessary transition toward renewable energies (Agung, 2022).
To accelerate the energy transition and reduce carbon emissions, PT PLN plans to build new
and renewable energy (EBT) plants with a total capacity of 648 MW, with a target operating
date of 2022 (Christian, 2022). However, it was unclear at the time of publication whether
this target would be achieved. To support this, PLN is not only intensifying the construction of
EBT plants, but also in parallel, modelling an early-retirement scenario of steam power plants
(Pembangkit Listrik Tenaga Uap, or PLTU) in several stages up to 2056. In the first stage, by
2030, PLN will reduce 5.5 GW of steam power plants as power supply contracts come to an
end. In the second stage, PLN will retire 10 GW of subcritical steam power plants by 2040.
Meanwhile, in 2050, PLN will close 18 GW of subcritical and 7 GW of supercritical power
plants (Hendartyo & Silaban, 2022).
To improve its financial position, the GoI plans to remove the electricity support measure
and instead provide social support directly to poor households and small businesses. As
a consequence, PLN will price electricity at the market price, thereby eliminating under-
recoveries. This reform plan was approved by the budget committee of the House of
Representatives in 2021, and the GoI was aiming to begin implementation in June 2022
(Umah, 2021a).
7This holding company is comprised of the five Korean generation companies known as GENCOs: KOSEP,
KOMIPO, KOWEPO, KOSPO and EWP, which are all KEPCO's subsidiaries (KEPCO, n.d.).
IISD.org/gsi 16Indonesia’s Energy Support Measures
4.0
Renewable Energy
IISD.org/gsi 17Indonesia’s Energy Support Measures
Indonesia has enormous renewable energy potential. Across six major renewable
energy sources, Indonesia can potentially generate upwards of 400 GW in
renewable power from the following sources: solar (207.8 GW), hydropower (75
GW), wind (60.6 GW), bioenergy (32.6 GW), tidal (17.9 GW), and geothermal
(11 GW) (Mulyana, 2018).
Even though the largest potential lies in solar energy (Mulyana, 2018), the GoI is currently
not providing any specific support for solar energy. Instead, support is generally available for
all other types of renewable energy and particularly for geothermal energy.
A total of 16 renewable energy support measures have been identified for the period from
FY 2016 through FY 2020. These measures can be classified into the following types of
support mechanisms:
• 10 are in the form of government revenue foregone.
• Five are in the form of direct or indirect transfers.
• One is in the form of income or price support.
All of the support measures identified for renewable energy benefit producers. Due to the lack
of or limited data, only 31% (five out of 16) of these measures could be quantified.
Details on the different support measures for renewable energy can be found in Appendix 2.
D: Renewable Energy Support Measures.
Measures Quantified
Five measures that could be quantified include four direct transfers from the state budget and
one price support (a feed-in tariff [FiT] instrument for renewable energy).
The GoI provided support for renewable energy projects in certain regions through the
Special Allocation Fund for Small Scale Energy until 2018. Since FY 2019, renewable energy
support has been provided as part of consolidated funding for line agencies, without separate
program accounting, making it difficult to identify the support allocation for renewable energy.
Some funding in FY 2019 and FY 2020 was also provided through the Geothermal
Infrastructure Financing Fund, which had been transferred from the Government Investment
Centre to PT Sarana Multi Infrastruktur (PT SMI). The government granted state capital
participation (Penyertaan Modal Negara, or PMN) to PT Geo Dipa Energi (Persero),
amounting to IDR 700 billion in the 2020 fiscal year as a state equity. The provision of state
capital participation is a form of commitment from the House of Representatives and the GoI
to encouraging the achievement of the target of utilizing geothermal energy of 7,000 MW as
an EBT mix in 2025 (PT Geo Dipa Energi, 2019).
As an income or price support, the GoI also provided FiTs for new renewable energy
generation until 2016, but this was reformed in 2017 by basically moving from fixed
tariffs to indexed tariffs to PLN’s price of production (BPP, basic electricity generation
cost), which is mostly determined by coal. The fixed tariff was established at 85% of
BPP. Therefore, the new tariff system does not provide subsidies because the tariff levels
IISD.org/gsi 18You can also read