Institute for Ship Structural Design and Analysis - M-10 Sören Ehlers - DGMK
←
→
Page content transcription
If your browser does not render page correctly, please read the page content below
Institute for Ship Structural
Design and Analysis
M-10

Sören Ehlers
Prof. DSc. (Tech) / Institutsleiter

                                      12/11/20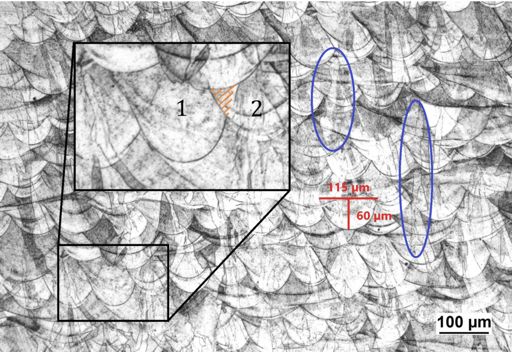
Institute for Ship Structural
Design and Analysis (M-10)
Sören Ehlers: Design and analysis of ships and offshore structures

Teaching                                               Research
   • Fundamentals of engineering                          • Analytical, numerical and experimental
      design                                                 structural analysis
   • Ship structural design I, II and III                 • Structural analysis and design under extreme
   • Introduction to ship structural                         conditions
      analysis                                            • Fatigue of Ships and Offshore structures
   • Arctic technology                                    • Design of Ships and Structures for polar regions
                                                          • Structural optimisation

                                            12/11/20                                                           2
Marine Technology
 Students at TUHH
Teaching in the current situation:            Registered students 2020:
                                              § Quite a drop in recent years
§ Teaching is primarily online with live or   § New Master students: 8
  pre-recorded presentations                  § New Bachelor students: 18
                                              § Total registered students: 71

  § General trend is a decreasing amount of students in mechanical engineering
  § Especially for Marine Technology I feel that we fail to communicate the
    diversity and cutting-edge technology we deal with. Often the one
    associates naval architecture with steel and iron work of heavy labor at a
    yard alone

                                   12/11/20                                      3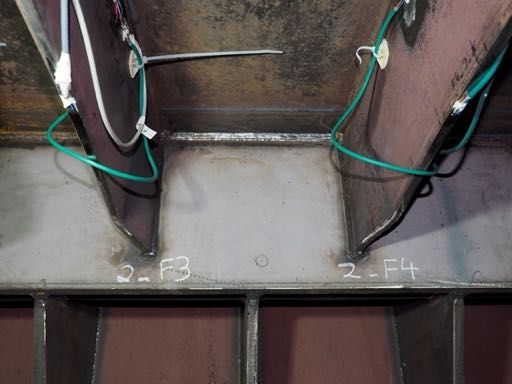
Research Areas
Fatigue/fracture mechanics                         Ice loads
• Detail design                                    • Ice-structure interaction
• New cutting and welding methods                  • Ice-pressure-distribution
• New materials                                    • Thin sections
• Production and in-service                        • Friction testing
   influences on fatigue and fracture
   behavior

Nonlinear Waves under Solid Ice                    Numerical Simulations
• Nonlinear wave propagation                       • Component design
• Dispersion of waves                              • Structural optimization
• Swell conditions                                 • Fatigue assessment
• Ice breakup mechanism                            • Material models
                                                   • Simulation of collision and
                                                     grounding

                                        12/11/20                                   4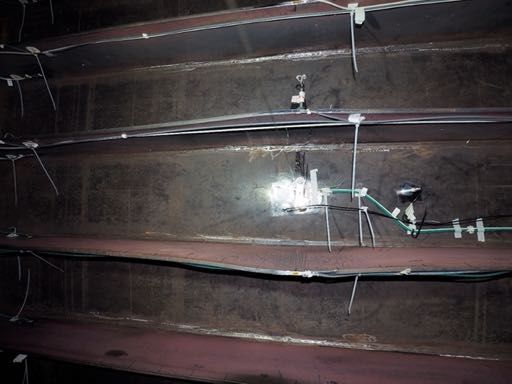
Research Areas
Residual stresses and laser scanning              Ship structural design for ice loads
• Hole-drilling rosette method                    • Ice-structure interaction
• Weld surface geometry scanning                  • Ice-pressure-distribution
• Plate deformation                               • Thin sections
                                                  • Friction testing

Structural behavior                               Ship acoustics
• Design of ships and equipment                   • Sound sources
• Collision and grounding                         • Sound propagation through
• Production and in-service                          structures
   influences on structural strength              • Sound radiation into water
• Influence of corrosion

                                       12/11/20                                          5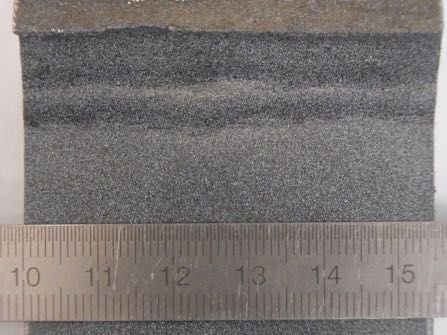
Fatigue strength and
residual stresses
Motivation                                                                                                             Dokumentierte Schäden
                                                                                                                       in Offshore Strukturen 1
§       Vielseitige Schadensfälle für Schiffe und
        Offshore Strukturen 1
§       Oft kombinierte Schäden 2
§       Ein Großteil der Schäden sind auf schlechtes
        design und operative Fehler zurückzuführen 2
§       Materialwahl kann Schäden beeinflussen 3

                          Image © Structural Integrity Associates, Inc.

Ref.:
1 A. Dehghani, F. Aslani, A review on defects in steel offshore structures and developed strengthening techniques.

Structures, 20 (2019) 635-657. https://doi.org/10.1016/j.istruc.2019.06.002
2
  S.J. Price, R.B. Figueira, Corrosion Protection Systems and Fatigue Corrosion in Offshore Wind Structures: Current
Status and Future Perspectives. Coatings, 7 (2017). https://doi.org/10.3390/coatings7020025
3 V. Igwemezie, A. Mehmanparast, A. Kolios, Materials selection for XL wind turbine support structures: A corrosion-

fatigue perspective. Marine Structures, 61 (2018) 381-397. https://doi.org/10.1016/j.marstruc.2018.06.008

11.12.20                                                                                                                                          7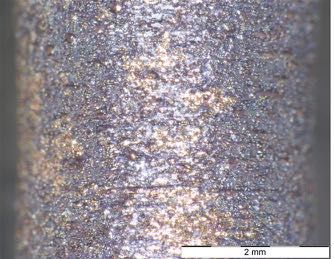
Post-weld improvement and retrofitting
§ TIG-dressing as a repair
method up to 2.3 mm crack 20
depth without reduction in r = -0.02
p = 0.92
S700 R=0.1 (Pedersen et al., 2009 )
A36 R=0 (Mendez et al., 2017)
S31803 R=0.1 (Baptista e
Grade 43A R=-1 (Booth, 1
fatigue strength 1 A36 R=0 (Mendez et al., 2017) Grade 43A R=0.5 (Booth,
15 Low carbon micro alloyed R=0.1
Grade 43A R=0 (Knight, 1
§ Recent results on TIG- (Haagensen, 1993)
S420 R=0 (Miki et al., 1999) Grade 43A R=0 (Knight, 1
dressing and grinding S355 R=0.5 A (Huther et al., 2001)
S355 R=0.5 B (Huther et al., 2001)
Grade 43A R=0 (Knight, 1
Supereiso70 R=0 (Knight
Slope m
support and assessment 10
S355 R=0.5 C (Huther et al., 2001)
S355 R=0.5 D (Huther et al., 2001)
Supereiso70 R=0 (Knight
Supereiso70 R=0 (Knight
based on a slope m = 4 2,3 DH36 R=0.1 (Polezhayeva et al., 2009) BS15 R=-1 (Gurney, 1968
DH36 R=0.1 (Gao et al., 2015) S355 R=0 (Braun et al., 2
§ Higher fatigue strength "
! = 3.9 S355 R=0.1 (Zhang and Maddox, 2009)
Grade A R=0.1 (Rutherford et al., 2006)
F51 R=0 (Braun et al., 20
S690 R=0 (Braun et al., 2
improvement for weld 5 S700 R=0.2 (Lieurade et al., 2005)
S275 R=0 (Hansen et al., 2007)
S900 R=0 (Braun et al., 2
SUS316L R=0.1 (Iwata et
profiling than for burr grinding 304L R=0.1 (Baptista et al., 2007)
S31803 R=0.1 (Baptista et al., 2007)
m=3
Median of m=3.90
and disc grinding 2
0
§ Highest improvement for 0 5 10 15 20 25
combination of grinding and Numbers of specimens in data series n
peening 3
Ref.:
1
Al-Karawi et al., Fatigue crack repair in welded structures via tungsten inert gas remelting and high frequency mechanical impact. Journal of Constructional Steel Research, 172 (2020).
https://doi.org/10.1016/j.jcsr.2020.106200
2 Braun & Wang, A review of fatigue test data on weld toe grinding and weld profiling. International Journal of Fatigue, submitted for publication (2020)
3
Ahola et al., Fatigue strength assessment of ground fillet-welded joints using 4R method. International Journal of Fatigue, 142 (2021). https://doi.org/10.1016/j.ijfatigue.2020.105916
11.12.20 8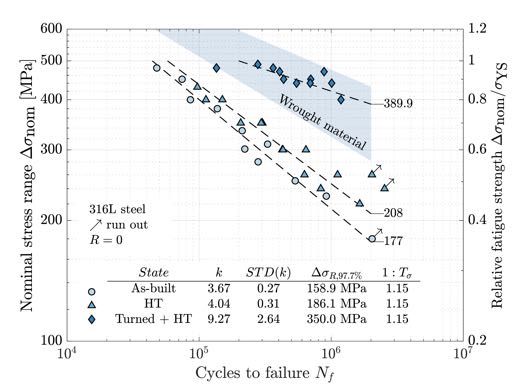
2.5

           Kt
                 2

Weld geometry assessment
                      0                               20          40        60            80               100               120              140                 160
                                                                                 Weld Length [mm]
                                                                                                                                                  Local Extreme
                                                                                                                                                  Global Extreme
                           (a)                                                                                                                                            (b
                                                           Weld 1                Weld 2                     Weld 3                          Weld 4

                                                                                                                                                                         Radius [mm]
                                         1.5

                           Radius [mm]
                                              1

                                         0.5
                                                  0          20        40          60           80             100             120             140               160
                                                                                        Weld Length [mm]

                                      160

                                                                                                                                                                        Angle [°]
                          Angle [°]
                                      140
                                      120

                                                  0          20        40          60           80             100             120             140               160
                                                                                        Weld Length [mm]

                            Leg Length [mm]
                                          10

                                              8

                                              6
                                                  0          20        40          60           80             100             120             140               160
                                                                                        Weld Length [mm]
                                         2.5                                                   Ref.: Renken et al. (2020). An algorithm for statistical evaluation of
                          K t,b [-]

                                                                                               weld toe geometries using laser triangulation, under preparation.
                                              2
11.12.20                                                                                                                                                     9
                                         1.5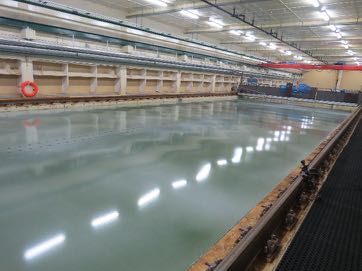
Weld geometry assessment

§    IIW Round Robin study on weld geometry measurement systems &
     algorithm
§    First results published 1
§    Higher measurement effort leads to more locations that do not fulfil
     ISO5817 requirements 2

Ref.:
1 Schubnell et al. (2020). Influence of the optical measurement technique and evaluation approach on the

determination of local weld geometry parameters for different weld types. Welding in the World, 64(2), 301-316.
https://doi.org/10.1007/s40194-019-00830-0
2
  Renken et al. (2020). An algorithm for statistical evaluation of weld toe geometries using laser triangulation,
under preparation.

11.12.20                                                                                                            10
Fatigue strength assessment Ref.: N. Friedrich, Experimental investigation on the
influence of welding residual stresses on fatigue for two
different weld geometries. Fatigue Fract Eng M, 43 (2020)
2715-2730. https://doi.org/10.1111/ffe.13339
considering residual stresses
§ Gesamtlebensdauer-Wöhlerlinien
§ deutlicher Eigenspannungseinfluss
Schweißzustand spannungsarm geglüht
Nennspannungsschwingbreite [MPa]
Nennspannungsschwingbreite [MPa]
R = 0 (Schweißzustand) R = 0 (spannungsarm)
R = -1 (Schweißzustand) R = -1 (spannungsarm)
R = -3 (Schweißzustand) R = -3 (spannungsarm)
R = -∞ (Schweißzustand) R = -∞ (spannungsarm)
Lastwechsel Ngesamt Lastwechsel Ngesamt
11.12.20 11Schweißsimulation
Vereinfachter FE-Simulationsansatz
(1) transiente thermische Analyse
Last: einheitliche Temperatur auf
Nahtquerschnitt keine ng
l i b r i eru °C
Ka 00
13
Ergebnis: Temperaturverteilung über der
Zeit
Temperatur [°C]
(2) elastisch-plastische Strukturrechnung
Last: Temperauren aus (1)
Ergebnis: Eigenspannung und VerzugSchweißsimulation
• angewendet auf fiktive Kleinprobe mit
Kreuzstoß
• angenommener Werkstoff: S355
4
6
2
1
3 5
=
b mm
0 Quer
15 (zur htung
Naht
)
l = 37
5 mmSchweißsimulation
330 mm
Que Naht)
(zur
rrich
tung
55 mm
Quereigenspannung [MPa]Eigenspannungsmessung
Eigenspannungsmessungen:
• Röntgendiffraktometrie
(ifs TU-Braunschweig)
• Messtiefe bis ~ 5 μm
• auf 3 ProbenEigenspannungsmessung
Eigenspannungsmessungen:
• Bohrlochverfahren
• Auswertung unter Annahme
(gleiche Farbe ≙ gleiche Probe)
konstanter Eigenspannungen
bis 1 mm TiefeÜberlagerung mit äußerer Last
F
F
σ
$!"#
"= =% " =-1 " =-∞
$!$% t
mit Eigenspannungen
$!$% ohne Eigenspannungen
Nahtübergang [MPa]
Spannung am
$!"#
mit Eigenspannungen mit Eigenspannungen
ohne Eigenspannungen ohne Eigenspannungen
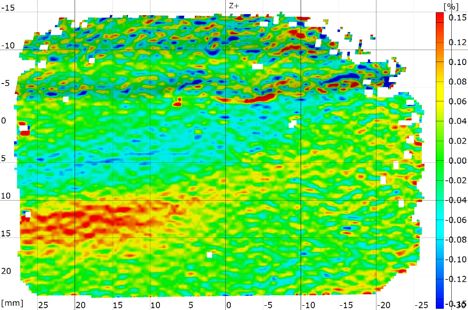
Nennspannungsschwingbreite [MPa]Schwingversuche – Risserkennung
Risserkennung mittels
Schweißnaht
digitaler Bildkorrelation
Fzyklisch
iss
[%]
R 0.15
1.00
0.12
0.95
Schweißnaht 0.09
0.90
0.85
0.06
0.80
0.03
Fzyklisch
Dehnung
0.00
0.75
-0.03
0.70
0.65
-0.06
-0.09
0.60
-0.12
0.55
-0.15
0.50
Versuchsbeginn7. Schwingversuche – Risserkennung
Schwingversuche – Risserkennung
Ice-structure interaction and
temperature effects
Collision scenario
   Ice Floe:                            Ship:
                                                                Source: Victor (distributed via shipspotting.com)

   • Diameter d = 8.5 m
   • Thickness t = 0.8 m (acc. FSICR)

   • Total mass for a circular plate:           Service

   à "!"!#$ = "%$"& + "'()*" = 82.6 +
                                                                   Container ship comparable to ship
                                                                              „FORESIGHT”
                                                              that transited the Northern Sea Route in 2009

                                                            Ice class:                   FSICR IA

                                                            Length:                      134.4 m
                                                TankSide    Beam:                        22.5 m

                                                            Draught:                     8.08 m

                                                            Engine:                      8400.0 kW

                                                            Ship speed (acc.             1.543 m/s (3 kn)
                                                            POLARIS):
                                                            Wind and Current             0 m/s
                                                            speeds:

                                                           TankDoublebottom

11.12.20                                                                                                            22
Heat transfer Service = -59°C
Tank1 = -54°C
How cold could a ship structure can actually Tank2 = -31°C
Tank3 = -18°C
T∞,air
become in winter? Tank4 = -12°C
T
∞,
se
• In the rules and guidelines of the classification rv
ic e
societies -60 °C can be found as the lowest T∞,cargohold
T
temperature for material tests on steels used in ∞,
ta
nk
shipbuilding. This value corresponds well with 1
different temperature measurements where Averaged temperature
T∞
extreme values below -50 °C were measured in the over the , ta
nk height of the
2
area of the Northern Sea Route. collision area ≈ -20°C
T
∞,
ta
• In contrast, liquid seawater cannot become colder nk
3
than -2 °C
T
∞,
ta
nk
4
Ref.: Kubiczek et al. (2019). Simulation of temperature distribution in ship structures for
the determination of temperature- dependent material properties, 12th European LS- b
DYNA Conference Koblenz. T ∞,tank,d
T∞,water
11.12.20 23Temperature dependent material properties and the
effect on the structural response in case of collision
20°C -20°C -60°C max Force [-] perm. deflection [-]
700 1.05 +3%
+1%
600 1.00
eng. stress [N/mm²]
500 0.95
-10%
400 0.90
300 0.85
200 0.80 -22%
100 0.75
0 0.70
0.00 0.10 0.20 0.30 0.40 20°C -20°C -60°C
eng. strain [-] material temperature
à neglecting the structural temperature leads to a conservative overestimation of the
permanent deflection.
à consideration of extreme values leads to an underestimation of the permanent deflection
because the structure is assumed to be too stiff.
11/12/2020 24Measurement locations on board Polarstern § Strain gauges and temperature sensors in void space 100 § Strain gauges on F-Deck (10800 aB) § Strain gauges and temperature sensors in void space 92
Temperature measurements

§   Temperature measurement
    on steel structure with
    PT1000 sensors every 5
    minutes
Data provided by the ship's
weather station:
§   Measurement of water
    temperature 5m below
    waterline
§   Measurement of air
    temperature 29m above
    waterline
Temperature measurements
V92_p1 V92_p2 V92_p3 V92_p4 ambient_air ambient_water
40
Ship in drydock Ship in water
35
30
temperature [°C]
25
20
15
31.7 1.8 2.8 3.8 4.8 5.8 6.8 7.8
date [-]Temperature measurements
Ship: R.V. Polarstern
Cruise-No.: PS 122/1
Date: 20.09.2019 –
15.12.2019
Port: Tromsö – Arctic Ocean
temperature [°C]
Source: https://dship.awi.de/
Source: http://www.awi.de date [-] in 2019Material tests to relate
DBTT and FTT
Research ∆"
Fatigue tests
S–N curve
Development of fatigue
assessment methods that take
temperature effects into
approach
(-20 °C)
account based on micro-
structural support effect
Comparison with state-
S–N curve hypothesis
of-the-art methods
(RT)
∆" Low temperature
§ Two steels
# FE modelling S–N curve
Temperature
modification
§ Three weld details Charpy tests Design curve
factor
§ Two methods %& #
Charpy
transition
curve
$
Extension of SED and
stress averaging Conclusions and
approach recommendations for
∆" further work
S–N curve
independent of
Statistical assessment of temperature
fatigue test results
∆"
#
Regression curve
$
11.12.20 29Averaged strain energy density
(a)
W [Nmm/mm 3 ]
0.01
0.1
1
5
10 4
S235
11.12.20
S500
WT RT
WR RT
10
WT -50 °C
WT -20 °C
WR -50 °C
WR -20 °C
5
Cycles to failure N
10
f
6
Rc(T)
Fatigue strength deviation
N dev = N -N
run out
om f,exp f,pred,97.5%
0.058
0.192
in
10
St -1
0.1050
1
2
3
ru a
7
ct ls
ur tre
al ss
st m Predicted cycles to failure N
(b)
St re et f,pred
ru ss ho
ct ex d
+ SD
- SD
ur tra
for P s = 97.7%
al
Xi st po
104
105
106
107
ao re la
& ss tio
n
104
Ya lin
m ea
Ef ad riz
ec a at
tiv 1 io
e m n
no m
tc co
h nc
st ep
re
105
t
±2 life factor
SE
D ss
Line of equality
Unconservative
co co
nc nc
ep ep
(a) Weld toe failure
tR t
SE c (T
D =
R
106
co T)
nc
ep
tR
Conservative
RT
c (T
-50°C
-20°C
)
Experimental cycles to failure N f
107
N
om
St in
ru al
ct st
u re
-1
0
1
2
3
ra s
with state-of-the-art methods
l s
st
re m
et
St
ru s s ho
ct ex d
ur tra
al po
Xi st la
ao re t
ss io
& lin n
Ya
m ea
riz
Ef ad
ec a at
io
1 n
tiv
e m
no m
tc co
h nc
st ep
SE re
ss t
D co
co nc
nc ep
ep t
tR
(b) Weld root failure
SE c (T
Results for SED method and comparison
D =
co R
T)
n ce
pt
30
R
RT
c (T
)
-50°C
-20°CIce load measurements
Ship: R.V. Polarstern
Cruise-No.: PS 122/1
Date: 20.09.2019 –
15.12.2019 measured shear strains
Port: Tromsö – Arctic Ocean
during a winter storm
Frame 1
strain [µm/m]
Frame 2
Frame 3
Frame 4
Frame 5
Frame 6
Source: http://www.awi.de
date [-] in 2019I. Test Program large scale tests
Rigid structure Deformable structureTest setup for the deformable structures
Panel 2
Panel 1
Panel 2 & 3
Panel 1 Plate thickness 10
mm
Spacing: 350 mm
FB 240 x 12
11.12.20 33Force curve of the brittle test run
against Panel 1
Stroke 1 Reconstruction Stroke 2Deformation of the panel
Initial PostDeformation of the stiffeners
Stroke 1 Stroke 2
Ice-Extrusion Test simulations

            D=100      D=200      D=800
           Cone 100   Cone 200   Cone 800

11.12.20                                    39
Results Ice-Extrusion Tests
Konus200_G25_A20_V10_1 Dyna_Simulation
180
160
140
Force [kN] 120
100
80
60
40
20
0
0 20 40 60 80 100 120 140
Displacement [mm]
11.12.20 40Ice Pessures - Cone 200
The loaded area of the LS-Dyna simulation is currently larger than measured. Accordingly, the
contact pressures (F/loaded area) are underestimated. The maximum pressures of the
simulation are in the magnitude of 30 to 50 MPa. This in accordance with the TekScan results.
11.12.20 41Application to the large scale extrusion
tests
Panel 1
Panel 2
Panel 1
Panel 2Untersuchung der Schwingfestigkeit hybrid additiv und subtraktiv gefertigter Proben aus AISI 316L M. Braun, S. Hellberg, I. Kryukov, S. Böhm, R. E. Wu, S. Ehlers, S. Sheikhi
Motivation
              SLM Cu-10Sn bronze propeller   Crankshaft of medium-speed four-stroke diesel engine

Ref.: Scudino et al. (2015)

                                                                                     Ref.: Köhler et al. (2011)

11.12.20                                                                                                    44
Hybrid additive and subtractive
manufacturing
1. Powder distribution 2. Laser processing 3. Milling
Powder distribution Metal Spindle
powder Laser
Base plate
Lifting Table Base plate Base plate
Lifting Table Lifting Table
'n' repetitions Every 'n' repetitions
Back to step 1
11.12.20 45Specimen preparation
§ Material: 316L
§ Renishaw AM250-System
§ 200W Ytterbium fibre laser
§ Argon atmosphere
§ Layer thickness: 40 µm
§ Specimens shape acc. to ASTM E466-15
§ Built in vertical direction
© Renishaw
11.12.20 46Test program
Condition As-built Heat-treated Machined
+ Heat-treated
Heat – 2h @ 650 °C 2h @ 650 °C
treatment (furnace cooled) (furnace cooled)
Machining – – 1 mm thickness
reduction by turning
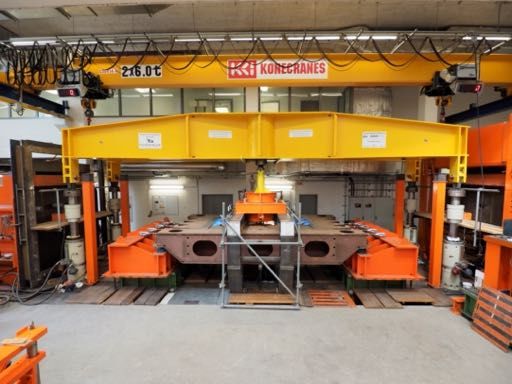
11.12.20 47Material characterisation
§ High strength and ductility
§ Grains partially extend over several
layers
11.12.20 48Computer tomography scan 11.12.20 49
Computer tomography scan

11.12.20                   50
Post-treatment of selective laser melted parts
                                        Unbehandelt       Bearbeitet

                    Rautiefe Rt        41,929 ± 0,065   5,062 ± 0,063

                    Mittenrauwert Ra    6,295 ± 0,041   1,024 ± 0,005

11.12.20                                                                51
Fatigue test results 11.12.20 52
Effect of surface roughness
                                                           1
                                                                           Data by Rennert (2012)

                                   for Rm = 600 N/mm 2
§ Surface roughness as-built:                            0.95
                                                                    f SR = 0.147e-0.1035Rz

                                   Surface factor f SR
!, ≈ 6.3 µm → !- = 20 – 55 µm                                            + 0.8528e0.0005721Rz
                                                          0.9
                                                                    R2 > 0.99

§ Surface roughness machined:                            0.85
!, ≈ 1.0 µm → !- = 4 – 16 µm
                                                          0.8

§     Estimated difference: ≈10%                         0.75
                                                                0                  100                     200
                                                                Surface roughness Rz

                                                          Ref.: Rennert, R. (Ed.) (2012): FKM Richtlinie

11.12.20                                                                                                    53
Thank you for your attention!
12/11/20You can also read