Institutional Presentation - International ...
←
→
Page content transcription
If your browser does not render page correctly, please read the page content below
Institutional Presentation
December/ 2019

Pepperoni                    1
Pizza

Disclaimer

The material that follows is a presentation of general background information about International Meal Company Alimentação
S.A. (“IMC” or the “Company”) as of the date of the presentation. It is information in summary form and does not purport to be
complete. No representation or warranty, express or implied, is made concerning, and no reliance should be placed on, the
accuracy, fairness, or completeness of this information.

This presentation may contain certain forward-looking statements and information relating to the Company that reflect the
current views and/or expectations of the Company and its management with respect to its performance, business and future
events. Forward looking statements include, without limitation, any statement that may predict, forecast, indicate or imply
future results, performance or achievements, and may contain words like “believe”, “anticipate”, “expect”, “envisages”, “will
likely result”, or any other words or phrases of similar meaning, which speak only as of the date the statement was made.
Such statements are subject to a number of risks, uncertainties and assumptions. We caution you that a number of important
factors could cause actual results to differ materially from the plans, objectives, expectations, estimates and intentions
expressed in this presentation. Neither the Company nor any of its affiliates, directors, officers, agents or employees shall be
liable before any third party (including investors) for any investment or business decision made or action taken in reliance on
the information and statements contained in this presentation or for any consequential, special or similar damages.

This presentation does not constitute an offer, or invitation, or solicitation of an offer, to subscribe for or purchase any
securities. Neither this presentation nor anything contained herein shall form the basis of any contract or commitment
whatsoever.

The market and competitive position data, including market forecasts, used throughout this presentation was obtained from
internal surveys, market research, publicly available information and industry publications. Although we have no reason to
believe that any of this information or these reports are inaccurate in any material respect, we have not independently verified
the competitive position, market share, market size, market growth or other data provided by third parties or by industry or
other publications.

This presentation and its contents are proprietary information and may not be reproduced or otherwise disseminated in whole
or in part without the Company’s prior written consent. Please, for any investment decision, read the risk factor section in the
Company’s “Formulário de Referência”, available in our IR website.

                                                                                                                           2
IMC at a Glance - Geographic Footprint*

                                                                 POINTS OF SALE
     Brazil                                                           453                                    United States
               193                            52

                 66                           15
                                                                                                                   22
                  25                             6¹

                  28                             2

                   6

     Colombia                                                                                                    Panama
                   13                                                                                              13

                       8                                                                                           9

                       8                                                                                           1
                                                                     Airport Restaurants (multiple brands)

                                                                                                                        3
*As of September/2019. (¹) Includes two operations at airports
IMC at a Glance – P&L Figures

    Financial Figures – LTM
                                                                                                                                     Net Debt/
           Net Revenues                                     Gross Profit                               Adj. EBITDA
                                                                                                                                    Adj. EBITDA

                                                            R$499                                      R$137                       R$1.4x
          R$1,565                                          32% margin                                 8.7% margin
                                                                                                                                  R$185mm net
                                                                                                                                      debt

                         Revenues – LTM                                                            Adjusted EBITDA – LTM

                                                                                                                           Brazil: 28%
                          Caribbean¹
                                                                                                    Caribbean¹
                                           12%                                                                                Roads

                                                                                                                                  Airports
                                  29%                                                                                              Malls
                                                              59%
                         USA                                          Brazil

                                                                                                                     USA
                                                                                                                                                  4
LTM Non IFRS-16 Figures - last reported figures 3Q19 ¹ Caribbean consists of Colombia and Panama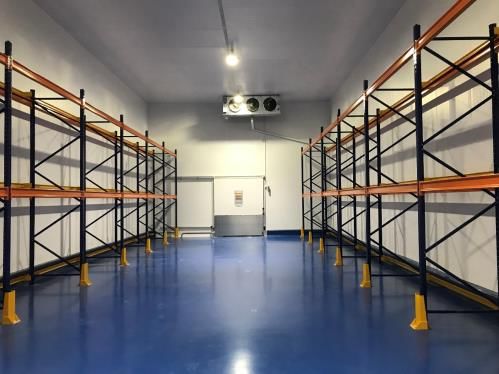
Brands Portfolio

       IMC main* brands with traditional history among consumers
                                                         Relevant
                          Brands                                                         Start Date                       Number of Stores                                        Highlight
                                                         Country

                                                                                              1952                                      25                            Pioneer roadside restaurant

                                                                                                                                                                 Buffet style restaurant specialized
                                                                                              1975                                      521
                                                                                                                                                                         in Brazilian cuisine

                                                                                                                                                                      Jimmy Buffett’s Caribbean-
                                                                                          1987/2011                                  18² / 4
                                                                                                                                                                         inspired restaurant

                                                                                                                                                                  One of the largest Italian Casual
                                                                                              1982                                       6³
                                                                                                                                                                 Dining Restaurant Chain in the US

                                                                                                                                                                 Airport catering operations, mainly
                                                                                              1958                                    6⁴ / 8⁴
                                                                                                                                                                         at regional airports

                  Airport Restaurants                                                            -                                      51                                     Several brands

                                                                                                                                                                 World's second-largest restaurant
                                                                                              1930                                      66
                                                                                                                                                                              chain

                                                                                                                                                                     World's largest pizza chain in
                                                                                              1958                                     193
                                                                                                                                                                          terms of locations

Source: As of September, 2019; Notes: *Represents 96% of the footprint. (¹) Includes Viena, V. Café, Viena Express, Viena Snacks, Viena Café, Viena Delicatessen, Viena Gourmet and Viena Delish. (²) Includes
                                                                                                                                                                                                                  5
two operations at hospitals (Viena Pizza and Pollo Tropical) and one Viena at MIA airport. (³) Includes two operations at airports. (⁴) At the catering division, please consider airports in which we operate.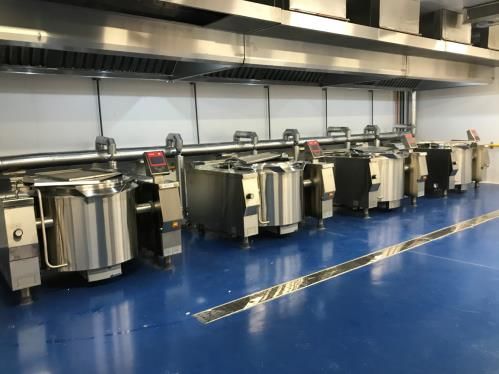
IMC Adjusted EBITDA Evolution

                                                      +10%
                                                             136

                                        +20%   121                         Flat

                                                                    116           116
                                 101

      Adj. EBITDA
                                 6.5%          8.1%          8.6%   9.6%           9.8%
        Margin

R$ million Non-IFRS 16 Figures                                                            6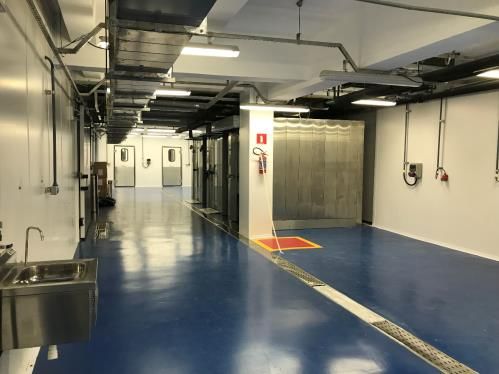
IMC Strategy Plan
  Growth with high ROIC

                                                                 Brown field expansion on
                                               Frango Assado                                         •   Active conversations
                                                   Expansion     the southeast region
                                                                                                     •   3 acquisitions per year for 5 years*

                                                         US      Expansion within touristic          •   10 new locations (2020-2021)
                                                   Expansion     cities at iconic locations          •   3 openings per year for 5 years*

                                                                 Expand both brands restaurants      •   Expansion through franchise and own stores
                                            Pizza Hut and KFC
                                                                 base                                •   Franchisee Acquisitions
                                                   Expansion
                                                                                                     •   40 openings per year per brand 50% own stores*
  Margin

                                                                 Unification and automation of our
                                                      Central                                        •   Central Kitchen ready
                                                                 central kitchen to improve
                                                      Kitchen                                        •   Soft start in late November
                          Central Kitchen                        margins in Brazil
  Structure

                                                                                                     •   Viena stores conversion or store sale to
                                                          IMC                                            focus at Airports and Hospitals
                                                                 Reduce business complexity
                                                Simplification
                                                                                                     •   Evaluate sale of other brands

*Beginning 2020
                                                                                                                                                7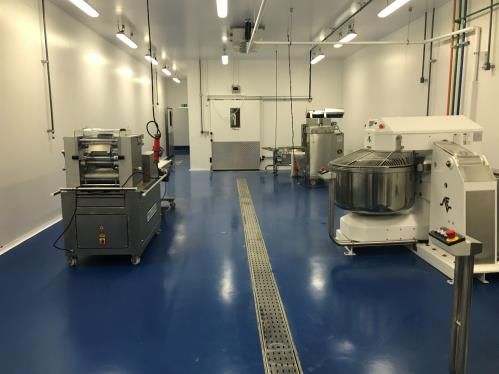
1
Frango Assado Expansion

  Solid SSS performance on                       Existing market is huge and                   Looking for brownfield
  tough macro environment                                fragmented                          opportunities with high ROIC

                                                 ~1,100 highway gas stations only in the            Target Southeast Region
                                                           state of São Paulo

                                                                                           ~ R$10 million per unis (capex + key Money)

                                                                                                       4-5 years payback

                                                                                                        3 units per year
     *Truckers strike effect over the 2Q18

                                                                                                                                  8
2
Margaritaville and LandShark Expansion

 Strong cash generation within    Expansion supported by the                          Expansion at iconic locations in the
        the businesses           landlord generating high ROIC                        USA, following the American tourists

                                                                                                    Expansion until 2021 already
                                                                                                             secured

                                                    50%   Landlord
                                                                       Mgmt. fee
                                      Capex                          ~3-4% of sales
                                                    50%

    Above 80% of the EBITDA
    converting to cash in 2018        Total Capex
                                                                                           Hawaii

                                                            ~US$ 5M/store
                                                                                                         10 new locations
                                                                                                          3 units per year
                                                            ~US$ 3M/store              Existing store

                                                                                       New store

                                                                                                                             ~70% of our guests
                                                                                                                                are tourists

                                                                                                                                      9
USA Expansion 2
Recent opened stores with good returns
LandShark Daytona – 20 LandShark Branson - 7 Pipeline 2020-2021
Months Months
15 months Payback Currently at 11% of Invested Capital 10 restaurants already signed
• River Center, San Antonio, TX (2020)
• Bayside, Miami, FL (2020)
• Times Square, NYC, NY (2020)
(928)
+654 +131 (1.041) +113 • Barefoot Landing, Myrtle Beach, SC (2020)
• Oahu, Hawaii, HI (2021)
• Times Square, NYC, NY (2020)
(524)
• Bayside, Miami, FL (2020)
• Faneuil Hall, Boston, MA (2020)
Initial Capex Bizz Performance Return Initial Capex Bizz Perfomance Return
• Pocono Springs, Poconos, PA (2021)
• Oahu, Hawaii, HI (2021)
Business Performance (EBITDA – Maintenance Capex – Taxes)
104
Central Kitchen
Construction Done
Located at Louveira/SP, 60 km from São Paulo
67% less employees
2.3x more production capacity
Equipments are being assembled
Operating in December/2019
Soft start of the new Central Kitchen in the end of November
and the closure of Viena’s Old Kitchen in December
Gradual implementation at the
restaurants within 1H20
Start on January 2020 – End on June 2020
Roll-out in phases to mitigate risks
113
MultiQSR Agreement
New shares issued New Board in place 14 Post Merger Integration
Flávio Benício Jansen
Chairman 1. IT
~196 million shares 2. Treasury
Marcel Fleischmann 3. Supply
outstanding 4. S&OP
José Agote 5. HR
6. Quality
Rodrigo Furtado
7. Pricing
Joseph Call 8. FP&A
9. Legal
~13% Martins Family Lincoln Martins 10. Accounting
Educação
11. Internal Communication
~2% Yum! Brands Charles Martins 12. Product Registration
13. Internal Audit
14. Tax
123
Why do we like the deal? - Market
Attractive growth in the fast Pizza Market is big and Chicken is the most consumed
food market in Brazil fragmented protein in Brazil
(kg/per capita 2017)
10% CAGR between Market Size ($)
2012-2017 United
States
Brazil
18%
1 st
2 nd
PIZZA 50%
36k
restaurants 32%
Source: Company Source: ECD and Statista
Pizza Hut with 0.5%
Market Share Largest Chicken
Restaurant Chain is KFC
wiht more than 60 stores
133
Why do we like the deal? - Company
Iconic and valuable brands Variety of stores type Franchise business helps to
globally increases addressable market expand store base without capex
2018 world's most valuable and
strongest restaurant brands.
Food Court
(Shopping Malls)
1st
2nd Royalties
DELCO Franchisee
Capex % Sales
(Delivery/Carryout)
3rd
KFC
7th Free Standing
Source: Brand Finance Restaurants
143
Why do we like the deal? - Synergies
Significant suppliers synergies Store-in-store at our Frango Conversion of non-performing
Assado Restaurants Viena stores
IMC: 1.1 Ton
Chicken
MultiQSR: 2.5 Ton Immediate access to 25 high
traffic locations (Frango Assado) in Malls
IMC: 1.6 Ton
Flour
MultiQSR: 1.6 Ton
Credit Card IMC: R$600mn
Transactions MultiQSR: R$400mn And/
or
Equipment and
Others
153
Pizza Hut and KFC Expansion Plan
10 new stores (6 Pizza Hut and 4 KFC) since Mar/19
259 stores end of Sep/19 Pizza Hut KFC
+10 stores vs. Mar/19 +6 Stores vs. Mar/19 +4 stores vs. Mar/19
193 66
13 Owned 20 Owned
KFC
180 Franchisees 46 Franchisees
16IMC Expansion Plan
Beginning 2020 Expansion Guidance
Pizza Hut and KFC Frango Assado Margaritaville and LandShark
+80 stores/year at 50% owned +3 Stores/year +3 Stores/year
+40 +40
KFC
Owned +20 +20
Hawaii
Franchise +20 +20
Existing store
New stores already signed
17Financial Highlights
Financial and Operational Highlights

     Net Revenue                                                                     Adjusted EBITDA and EBITDA Margin
   (R$ Million)                                                                     (R$ Million and %)
                                                                                     2000

                                                                                                                                            9.6%         9.8%
                                                                                                                               8.6%
                                                                                                                 8.1%

                  1,541                       1,582                                               6.5%
                             1,495
                  195                          191
                              179
                                                          1,206   1,189
                  391         368              439         142     141
                                                           359     366
                                                                                                                               136
                                                                                                                  121                        116         116
                                                                                                   101
                  955         947              952
                                                           705    682

                  2016        2017            2018        9M18    9M19                             2016           2017         2018         9M18         9M19

                            Brazil      USA       Caribbean

     Same Store Sales (SSS)                                                          Number of Stores
   (Growth in R$,%)                                                                 (#)

                                                                                            252   242     241
                                                                                             26                    231   227      222
                                                                                                  24      24                               213     212   210
                                                                                             20                     23    22         22                         195
                                                                                                  19      20        20                      21      21    21          194
                                                                                             22   22      22              22         22
                                                                                                                    21                      22      22    22    21    21
                                                                                                                          21         21                         22
                                                                                                                                            21      22    22          22
                                                                           -2.8%                                                                                23    23
                                                                            -4.6%
                                                                            -4.9%
                                                                          -10.3%            184   177     175      167   162      157      149     147   145    129   128

       1Q17 2Q17 3Q17 4Q17 1Q18 2Q18 3Q18 4Q18 1Q19 2Q19 3Q19                               1Q17 2Q17 3Q17 4Q17 1Q18 2Q18 3Q18 4Q18 1Q19 2Q19 3Q19

                      IMC            Brazil           Caribbean    USA                                          Brazil   Panama           USA      Colombia

                                                                                                                                                                       19
Financial and Operational Highlights
Indebtedness (3Q19)
Debt and Leverage Breakdown by Type
(R$ Million)
1.4x Foreign Libor
24% 24%
0.5x
0.2x
-0.3x
552
334
160 206 185
22 66
-31
2016 2017 2018 3Q19
Local CDI
Gross Debt Net Debt Net Debt/ Adj. EBTDA LTM 76% 76%
Debt Amortization Schedule
234
175
102
92
68
37
Cash and Cash Equivalents Short-Term 2021 2022 2023 2024+
20Speakers
CEO
Newton Maia Alves
IRO
Luis Felipe Bresaola
Phone: +55 11 3041.9653
ri@internationalmealcompany.com
www.internationalmealcompany.com/ir
21You can also read