Retail - The Future of Retail is Stores that Aren't Stores - By Deborah Weinswig - ULI Asia Pacific Summit
←
→
Page content transcription
If your browser does not render page correctly, please read the page content below

Retail – The Future of
 Retail is Stores that
    Aren’t Stores
    By Deborah Weinswig

                          deborahweinswig@fung1937.com   1
In 2023

          deborahweinswig@fung1937.com   2
One in Five Department Stores Will Have Closed
   Over 1,000 department stores could close by 2023, reducing total
                 sector store numbers by one-fifth.

                                                          deborahweinswig@fung1937.com   3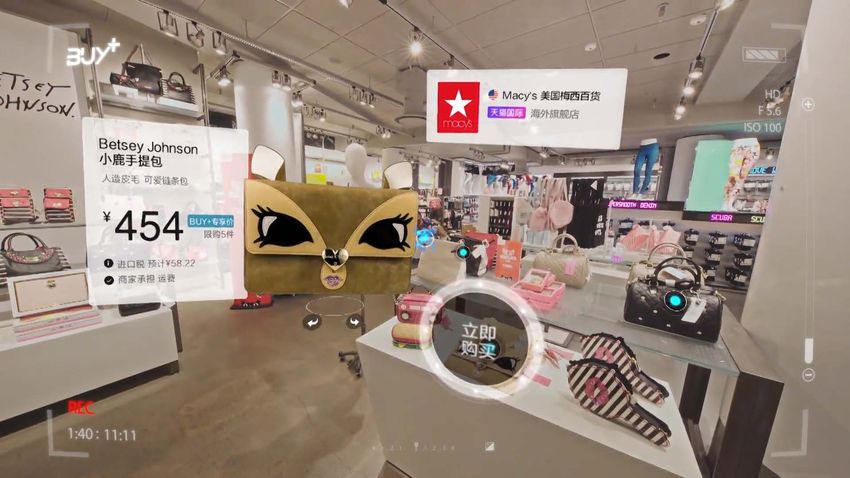
One in Five Department Stores Will Have Closed

                             US: Number of Full-Line Department Stores
                                                                      1,100–1,200 Closures
                                                    5,900
               6,000

               5,000                                                                         4,750

               4,000

               3,000

               2,000

               1,000

                    0
                                                     2017                                    2023E

               Figures exclude off-price department stores.
               Source: Euromonitor International/Coresight Research

                                                                                                     deborahweinswig@fung1937.com   4
Shoppers Will Be Redirecting a Further $78 Billion
     in Spending from Retail to Services
By 2023, we expect consumers will be redirecting an additional $78 billion
     to discretionary services at the expense of discretionary goods.

                                                             deborahweinswig@fung1937.com   5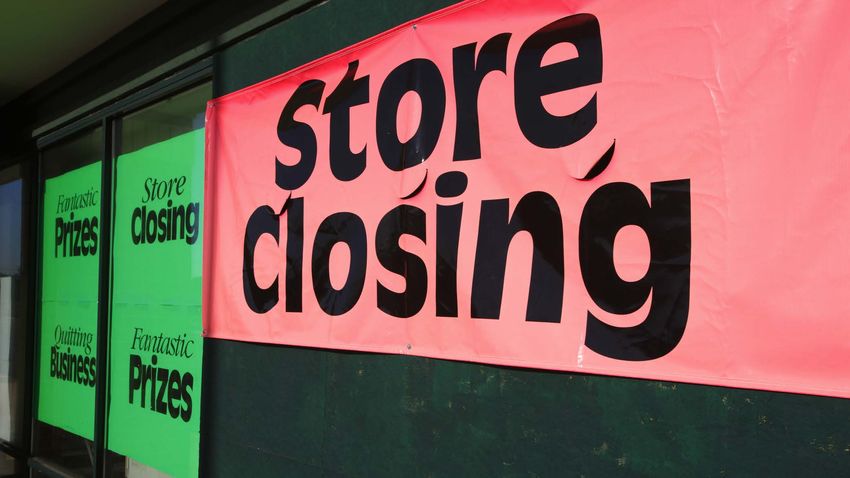
Shoppers Will Be Redirecting a Further $78 Billion in
Spending from Retail to Services
                                        US Discretionary Spending: Split of Goods vs. Services (%)

                                                       Discretionary Goods                                      Discretionary Services
           58.0
                                                                                                                                                                                       56.7
                                                                                                                                                                                56.4
                                                                                                                                                                         56.0
                                                                                                                                                                  55.7
           56.0                                                                                                                                            55.4
                                                                                                                                                    55.0
                                                                                                                                      54.6   54.7
                                                                                                                               54.2
                                                                                                                        53.7
           54.0                                                              53.1   53.1                         53.1
                                                                                           52.7   52.6   52.8
                                                                      52.5
                                                        51.7   52.0
                                                51.6
           52.0                          51.3
                          50.4   50.7
                   50.0
           50.0
                   50.0
                          49.6   49.3
           48.0                          48.7
                                                48.4    48.3   48.0
                                                                                                                                      $78 Bil. in "Lost" Spending
                                                                      47.5                 47.3   47.4   47.2    46.9
           46.0                                                              46.9   46.9
                                                                                                                        46.3
                                                                                                                               45.8
                                                                                                                                      45.4   45.3
           44.0                                                                                                                                     45.0
                                                                                                                                                           44.6
                                                                                                                                                                  44.3
                                                                                                                                                                         44.0   43.6   43.3
           42.0

          Source: US Bureau of Economic Analysis/Coresight Research

                                                                                                                                                                         deborahweinswig@fung1937.com   6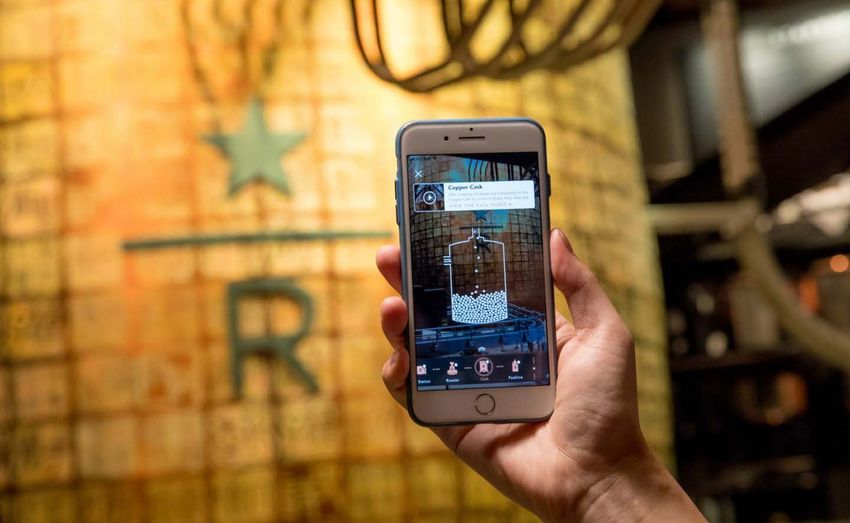
Consumers Will Buy $73 Billion More Worth of
             Apparel Online
 Online apparel sales will more than double between 2017 and 2023,
meaning an additional $73 billion of apparel purchases will switch from
                        stores to e-commerce.

                                                           deborahweinswig@fung1937.com   7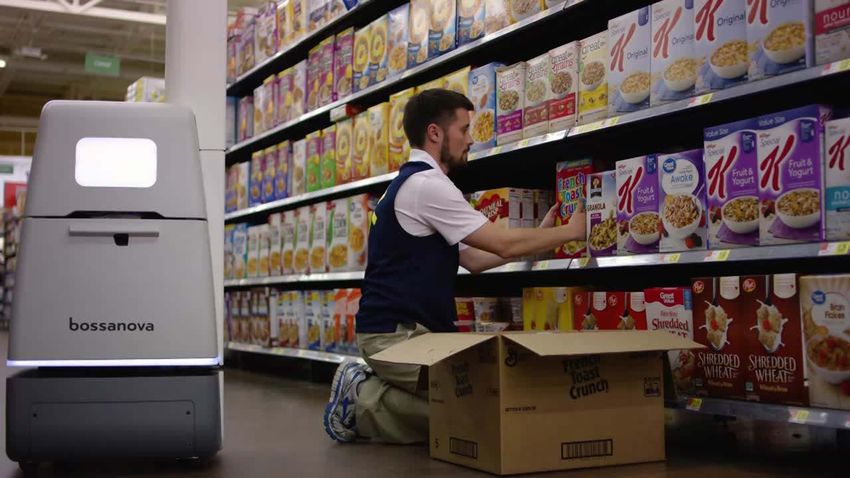
Consumers Will Buy $73 Billion More Worth of Apparel Online

                  E-Commerce Clothing and Footwear Sales as a Share of Total
                              Clothing and Footwear Sales (%)

                35.0                                    $73 Billion More   34.2
                                                        Spent Online
                30.0

                25.0

                                                     20.4
                20.0

                15.0

                10.0

                  5.0

                  0.0

                                                    2017                   2023E
                Source: Euromonitor International/Coresight Research

                                                                                   deborahweinswig@fung1937.com   8
Millennials Will Control $5 Trillion of
             Consumer Spending
We estimate that US millennial households will wield over $5 trillion of
                     spending power by 2023

                                                           deborahweinswig@fung1937.com   9
Millennials Will Control $5 Trillion of Consumer Spending

                                         US: Gen Zers and Millennials as % of Population (Left Axis)
                                            and Midpoint of Millennials’ Age Range (Right Axis)
                                                        Gen Zers                   Millennials                    Millennials: Age Midpoint
          60.0%
                                                                                                                                               32       33       35

                                                                                                                 30                   31
                                                                       28                   29                                                                   30
          50.0%
                            26                   27

                                                                                                                                              28.4%    28.3%     25
          40.0%
                                                                                                              28.5%                28.4%
                                                                    28.6%                28.5%
                         28.7%                28.6%                                                                                                              20
          30.0%
                                                                                                                                                                 15

          20.0%
                                                                                                                                                                 10

                                                                                                              24.8%                25.9%      27.1%    28.2%
          10.0%          20.2%                21.3%                 22.5%                23.6%
                                                                                                                                                                 5

            0.0%                                                                                                                                                 0
                            2016                 2017                 2018E                2019E                2020E                 2021E    2022E    2023E

          We define millennials as being born between 1980 and 2000 and Gen Zers as being born after 2000, so Gen Zers include children.
          Source: US Census Bureau/Coresight Research

                                                                                                                                                        deborahweinswig@fung1937.com   10
Retail-as-a-Service Will Peel Away $17 Billion
from Traditional Retail Channels
By 2023, US shoppers will be spending an estimated $17 billion on online
meal kits, beauty and personal care subscriptions, online apparel resale
and online apparel rental.
deborahweinswig@fung1937.com 11Retail-as-a-Service Will Peel Away $17 Billion from Traditional
Retail Channels
Market Size of Selected Retail Alternatives (USD Bil.)
Online Meal Kits Beauty and Personal Care Subscriptions
Apparel Resale Sites Online Apparel Rental
20.0
17
16% Average Annual
Growth
15.0
10.0
7
5.0
0.0
2017 2023E
Source: Coresight Research
deborahweinswig@fung1937.com 12RETAIL OUTLOOK
deborahweinswig@fung1937.com 13Retail M&A Activity
Industry M&A activity continues at a healthy pace.
Selected Retail/Apparel Transaction Announcements
Date Acquirer Target Company Value (USD Mil.)
5/2/18 Macy’s Story Undisclosed
4/30/18 Sainsbury’s Asda $9,667
3/19/18 Authentic Brands Nautica Undisclosed
3/16/18 L’Oréal ModiFace Undisclosed
2/27/18 Amazon Ring $1,000
2/5/18 EG Group Kroger convenience stores $2,150
2/2/18 Albertsons Rite Aid $3,063
1/22/18 Richemont Yoox Net-a-Porter $3,119
1/11/18 Shareholders Puma $4,267
12/13/17 Target Shipt $550
Source: Bloomberg
deborahweinswig@fung1937.com 14Store Closures Continue to Exceed Store Openings
Major US Store Closing Announcements: Year to Date 2018
740
Walgreens 600
267
Best Buy 250
200
Mattress Firm 200
110
Sears and Kmart 103
100
Southeastern Grocers 94
94
Claire's 92
Gap
71
70
63
Total: 3,335 Total: 10,000
Abercrombie & Fitch 60 announced store closures expected store closures in 2018
49 year to date
Bon-Ton 47
24
Vera Bradley 17
13
J.Crew
Macy’s
13
12
11
Total: 1,769 Total: 7,066
10 announced store openings
JCPenney 8 announced store closures
6 year to date in 2017
Island Pacific 6
4
Nordstrom 1
0 100 200 300 400 500 600 700 800
Year to date through April 13. Coresight Research has calendarized the announcements of store closures, which involves an estimation for some retailers. Ascena Retail will close 268–667
stores by July 2019, depending on negotiations with landlords. The Children’s Place will close 300 stores by 2020. Gap will close 200 stores by 2020. Vera Bradley will close 50 stores by 2021.
Source: Company reports/Coresight Research
deborahweinswig@fung1937.com 15Retail Bankruptcies Continue
Retail Bankruptcy Announcements
YTD 2018 vs. Same Period in 2017
2018 2017
Month Revenue Month Revenue
• Six US retailers have filed for Company
Announced (USD. Mil)
Company
Announced (USD. Mil)
bankruptcy year to date as of A’gaci Jan 39 American Apparel Jan 545
the end of April, compared Kiko USA Jan 9 The Limited Jan 10
with 10 in the same period in
2017. Bon-Ton Feb 2,541 Wet Seal Feb 342
The Walking Company Mar 230 Eastern Outfitters Feb 446
• Bankruptcy filings seem to be Claire’s Mar 1,338 RadioShack Mar N/A
slowing relative to last year, Nine West Apr 1,910 Gordmans Stores Mar 632
when they hit a record—but
they are still at a HHGregg Mar 1,770
postrecession high. Gander Mountain Mar 219
Vanity Mar N/A
• More are likely to come. Payless ShoeSource Apr 266
Year to date through April 30
Source: Company reports
deborahweinswig@fung1937.com 16Amazon Continues to Outpace Retail and US E-Commerce
US: E-Commerce’s Share of Total Retail Sales (Left Axis) and
Amazon’s Share of E-Commerce Sales (Right Axis)
25.0% 23.5% 25.0%
20.3%
20.0% 18.7% 20.0%
15.0% 15.0%
10.0% 8.9% 10.0%
8.1%
7.3%
5.0% 5.0%
0.0% 0.0%
2015 2016 2017
US E-Commerce/Retail Amazon/E-Commerce
Source: Amazon/US Census Bureau/Coresight Research
deborahweinswig@fung1937.com 17Grocery Delivery Wars Are Escalating
• Amazon recently expanded its Amazon Key program to include delivery to car trunks
to deter “porch pirates.”
• Other retailers are partnering with delivery services for same-day grocery delivery.
Retailer Activities/Partners
Amazon • Amazon Prime Now delivery in 1–2 hours
• Whole Foods local delivery
• Amazon Key delivers inside homes and cars
Target • Announced acquisition of Shipt for $550 million in cash
• Expanded delivery to Northeast and NV, CO, TN, SC, LA, MS, TX, etc.
Walmart • Testing package delivery by employees
• Partnership with DoorDash
Kroger • Offers same-day home delivery in 45 markets
• Recently expanded partnership with Instacart
Source: Company reports
deborahweinswig@fung1937.com 18Healthy Retail Private-Label Activity
Retailers are boosting their private-label offerings.
Amazon offers 76 private-label Target offers 41 private-label and exclusive Walmart offers 28 private-label
brands, up from 35 in April 2017 brands, up from 33 in January 2017 brands, up from 26 in January 2017
76 brands, including: Selected brands: Selected brands:
Source: Company reports
deborahweinswig@fung1937.com 19Kohl’s Is Embracing New Formats
Kohl’s appointed doug howe as chief merchandising officer on may 2. He previously served as
global chief merchandising officer at qurate retail group, parent of QVC and HSN.
deborahweinswig@fung1937.com 20RETAIL TREND
deborahweinswig@fung1937.com 21VR in Retail
Alibaba launched the trial of Buy+, a VR set through which users can
access a virtual shopping experience that simulates shopping trips to
iconic locations such as Macy’s store on 34th Street in New York.
deborahweinswig@fung1937.com 22AR in Retail
Starbuck Reserve Roastery in Shanghai using AR technology to enhance
user experience and customer loyalty
deborahweinswig@fung1937.com 23AI in Retail
Walkways fused with artificial intelligence, an on-site farm for picking vegetables, and smart
lavatories that offer a health diagnosis
deborahweinswig@fung1937.com 24The CORE Framework for AI in Retail
Communication Optimize Pricing
Personalization, chatbots, voice Forecasting, competition and
dynamic pricing
Rationalize Inventory Experiential Retail
Demand forecasting, allocation, Engage, discover, shop, pay
auditing
deborahweinswig@fung1937.com 25VC Funding for AI Is Exploding and Was Up 240% in 2017
$16.0
$14.2
$14.0
$12.0
$10.0
$8.0
$6.0
$4.2
$4.0 $3.0
$1.7 $2.2
$2.0 $0.7 $0.7
$0.0
2011 2012 2013 2014 2015 2016 2017
Q1 Q2 Q3 Q4
Source: Venture Scanner
deborahweinswig@fung1937.com 26US Look to China, a New Leader in AI
New Retail refers to the integration of online and offline retail, logistics and data across a single value chain—AI and
automation are the keys to making everything work.
Offering New Pickup Options Such as Click-and-
Collect
Rolling Out O2O Services on Mobile Devices and
Social Networks
Pure Plays Opening Experiential Stores
Enhancing Mobile Payment Services In-Store
Forming Strategic Alliances with Internet
Companies to Drive Synergies
Using QR Codes In-Store to Encourage Customers
to Buy Online; Driving Online Traffic to Physical
Stores
deborahweinswig@fung1937.com 27AI Helped Alibaba and JD.com Achieve Record Sales
on Singles’ Day
Singles’ Day Online Sales
Key stats from the 2017 11.11 Global (USD Bil.)
Shopping Festival (Singles’ Day): 30
25.3
• Alibaba reported Singles’ Day sales of 25
$25.3 billion, up 39% year over year. $44.4 billion 19.14
20 17.8
in 2017
• JD.com reported sales of $19.14 billion, 15
14.3
up 50% year over year.
9.3 9.57
10
• Alibaba’s mobile penetration was 90%, 5.8
up from 82% in 2016. 5 3.0
0
• Alibaba processed 812 million packages, 2012 2013 2014 2015 2016 2017
up from 657 million in 2016.
Singles' Day (Alibaba) JD.com
Alibaba figures are sales made on November 11 (Singles’ Day); JD.com sales cover 11 days of transactions,
including Singles’ Day.
Source: Company reports
deborahweinswig@fung1937.com 28China’s Singles’ Day vs. US Thanksgiving Weekend Sales: 2017
30 60.0%
25 50.0% 50.0%
25.3
20 39.0% 40.0%
Sales (USD Bil.)
YoY % Change
19.1
15 30.0%
10 18.3% 16.9% 17.9% 20.0%
16.8%
7.9
5 6.6 10.0%
5
2.9
0 0.0%
Thanksgiving Black Friday Thanksgiving-Black Cyber Monday* Singles' Day Singles' Day
Friday (Alibaba)** (JD.com)***
*Estimate as of 10 p.m. on Cyber Monday
**Includes sales from Alibaba’s 11.11 pop-up stores and other physical stores
***Includes sales from November 1–11, 2017
Source: Adobe/ShopperTrak/company reports
deborahweinswig@fung1937.com 29AI Offers Personalization and Higher Conversion Rates
Alibaba uses AI to integrate data across a single value chain.
Merchants generated 60 billion personalized
Alibaba’s AI-based marketing platform
shopping pages on Taobao and Tmall during
generated 400 million ad banners on Singles’
Singles’ Day 2017
Day 2017
Conversion rates were 20% higher
Alibaba’s AI customer service handled
on personalized landing pages than on
95% of inquiries on Singles’ Day 2017
nonpersonalized pages on Singles’ Day 2016
Source: Alizila.com
deborahweinswig@fung1937.com 30Recommendation Types Differ on Amazon and Alibaba
Recommends More Paintbrushes (i.e., Goods) Recommends a Painting Class (i.e., Experiences)
deborahweinswig@fung1937.com 31Robotics for “Smart Warehousing” and Fulfillment
Walmart is testing at select locations is the Bossa Nova robot. It scans shelves for out of stock
items, incorrect shelving and wrong labels.
deborahweinswig@fung1937.com 32Robotics for “Smart Warehousing” and Fulfillment
Alibaba’s AGV Warehouse Robots
China is leading the charge when it comes to embracing
industrial robotics.
• China is the world’s biggest purchaser of industrial robots,
representing ~35% of global sales, according to the
International Federation of Robotics.
• Chinese appliance manufacturer Midea acquired German
robotic factory automation company Kuka for $5 billion.
At Alibaba’s smart warehouse in Huiyang, 60 automated Kuka Fulfillment Robot
guided vehicles (AGVs) can process 1 million shipments per
day.
• These Wi-Fi-equipped, self-charging machines are responsible
for moving goods in the warehouse.
• AGVs cut the time required to process an item for an order by
two-thirds and increase output threefold, according to
Alibaba.
Source: YouTube
deborahweinswig@fung1937.com 33Thank You
Deborah L. Weinswig
deborahweinswig@fung1937.com
deborahweinswig@fung1937.com 34You can also read